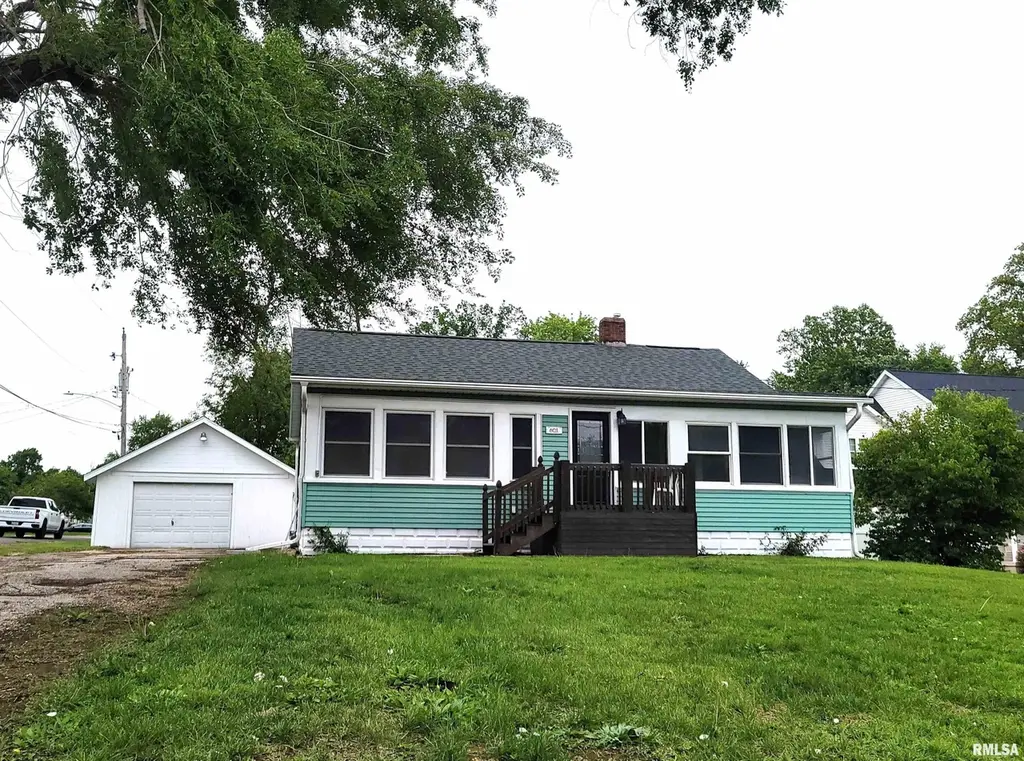
601 Pekin Ave · Creve Coeur, IL
Flood risk 1/10 · Minimal
- FEMA flood zone
- X (unshaded)
- Chance of flooding over 30 yrs
- 0.0%
- Est. flood insurance / yr
- $473 – $860
Fire risk 1/10 · Minimal
- Est. fire insurance / yr
- $804 – $1,492
Heat risk 3/10 · Minor
- Hot days now (above 103°F)
- 7 days/yr
- Hot days in 30 yrs
- 18 days/yr
Wind risk 2/10 · Minimal
- Chance of severe wind over 30 yrs
- 1.0%
Air-quality risk 3/10 · Minor
- Unhealthy air days now
- 1 days/yr
- Unhealthy air days in 30 yrs
- 3 days/yr
Risk factors via First Street. Map © Google.
Why this score? — see what drove the D grade
The composite is a weighted blend of 9 inputs, each scored 0–100. Each bar is that input's sub-score; the figure is the points it added to the 100-point composite (weight × sub-score).
- Cash flow +17.0/30.0
- DSCR +5.3/10.0
- ARV discount +5.3/15.0
- 1% rule +4.0/10.0
- Livability +3.2/5.0
- Rent growth +2.5/5.0
- Condition / age +2.5/5.0
- Schools +1.5/10.0
- Appreciation +0.0/10.0
$149,900
🖨 Deal sheet (PDF) 📄 Offer letter ✓ Due diligence
Listing remarks MLS
ESTATE SALE ! Price Reduced Making This A Fantastic Buy ! Nice bungalow In Nice Neighborhood on Generous Corner Lot. Old World Charm with 2 Bedrooms, 2 Enclosed Front Porches, Spacious Living & Dining room and Much More. Newer Roof and Furnace. Full Basement If You Need to Add Living Space. De-Watering System added April '09. Property being sold "as is". Room sizes and square footage is approximate and not guaranteed to be correct.
Key facts
- Formal dining room
- New bathroom
- French door
Tags
Property features AI
Exterior
- Parking: Detached oversized 1-car garage
- Utilities: Public water; Public sewer; Electric service (standard)
- Home design: Single-family residence; Built in 1928
- Construction: Shingle roof
- Exterior features: Fenced yard; Corner lot; Paved road access
Interior
- Kitchen: Refrigerator
- Bedrooms: 2 bedrooms (both on the main level with egress windows)
- Flooring: Carpet in bedrooms, living room, den/office and additional room; Laminate flooring in kitchen and sun room; Other flooring in basement laundry
- Bathrooms: 1 full bathroom
- Heating & cooling: Forced air heating (high-efficiency heating); Central air conditioning
- Interior features: Cable available; Ceiling fan(s); Replacement windows; Full basement
- Laundry & utility: Basement laundry room
Neighborhood map
What this means for you Summary
Snapshot
- This is a 3-bed/1.0-bath single-family listed at $150k.
Deal economics
- At list price, monthly cash flow is $103 ($1k/yr) — positive.
- The deal already cash-flows at list — no discount required.
- To meet the 1% rule (rent ≥ 1% of price), the offer needs to be $135k (9.9% below list).
- Recommended offer: $135k (9.9% below list) — sets the bar for 1% rule.
Location & tenants
- Location reads 63/100 on livability (#755 in IL) — a middle-class / working-renter tenant base. Strengths: cost of living A+, housing A-; Watch: employment D, amenities F, commute F.
- East Peoria Chsd 309 (suburban): math 17% / reading 15% proficiency, ranked #482 of 620 in IL (top 78%) — low school quality limits family demand, transient renter base, plan for 1-2y turnover.
- Zoned schools: Lasalle Elem School (math 12% / reading 8%, grade F, #1,517 of 2,056 statewide, top 78%, 254 students, 0% FRL); Parkview Jr High School (math 12% / reading 27%, grade F, #425 of 665 statewide, top 65%, 228 students, 0% FRL); East Peoria High School (math 17% / reading 15%, grade F, #457 of 693 statewide, top 66%, 947 students, 0% FRL).
- Market conditions: 24 active listings in the ZIP; 1 comparable units currently listed for rent nearby; 77 units permitted in Tazewell County in 2024 (0 in 5+ unit buildings).
Forward outlook
- Local home prices are declining (-3.0%/yr); year-one equity from $1k of loan paydown is wiped out by about $4k of value loss. Plan a longer hold.
- Tazewell County population projected at -15% by 2050 — secular population decline; favor cash flow + early exit over multi-decade hold.
Negotiation context
- Only 14 days on market — expect competitive offers; lowballing is unlikely to land.
- 2 sale attempts since 18y ago with the ask held roughly flat each time — persistent listings suggest the price (not the market) is what's stuck; bring a comps-based counter.
- Current owner paid $67k; list at $150k implies a 124% gain — meaningful room to come down on a strong offer.
Risks & watch-outs
- Watch-outs: built in 1928 — expect roof / HVAC / electrical / plumbing capex.
Questions for the listing agent
- Built in 1928 — when were the roof, HVAC, electrical panel, plumbing, and water heater last replaced?
- Is there a deadline driving the sale (1031 exchange, divorce, estate, relocation)? That informs how much negotiation room exists.
- Schools are F-rated, which usually means shorter tenancies and higher turnover. Who's the typical renter profile here, and what's been the actual vacancy rate?
- The area grade is low — what's the realistic commute time and amenity access for the typical tenant pool here? Any planned neighborhood developments (good or bad) we should know about?
- What's the average days-on-market for RENTAL listings here right now (not sales)? A rising rental-DOM trend means longer vacancies and softer asking-rent achievability than the comps imply.
- What's the recent tenant-quality profile in this submarket — average credit score on applications, eviction rate, late-payment / NSF rate, and stable-employment percentage? A property-management company in the area should have these aggregated.
- How much new for-sale + rental construction is in the pipeline within 1–3 miles? Heavy new supply typically softens prices + rents 12–24 months out; constrained supply supports both.
Investment metrics
- 1% rule
- 0.90% ✗
- Cap rate
- 7.11%
- Cash-on-cash
- 2.93%
- DSCR
- 1.13
- GRM
- 9.3
CMA / ARV
- ARV (on-the-fly)
- $142,800
- Comps found
- 12
Show comp detail 12 sales within ~0.75 mi
| Address | Dist | Beds/Ba | Sqft | Sold | Price | $/sf | Match |
|---|---|---|---|---|---|---|---|
| 121 Apple Ct | 0.10mi | 3/1.5 | 1,279 (-6%) | 3mo | $175,400 | $137 | 81 |
| 441 Velde St | 0.22mi | 4/1.5 (+1) | 1,307 (-4%) | 10mo | $195,000 | $149 | 68 |
| 617 N Stewart St | 0.42mi | 3/2.0 | 1,248 (-8%) | 3mo | $150,000 | $120 | 61 |
| 401 N Highland Ave | 0.59mi | 3/1.0 | 1,268 (-7%) | 3mo | $159,999 | $126 | 58 |
| 122 Holland Ct | 0.09mi | 4/2.0 (+1) | 1,182 (-13%) | 11mo | $124,000 | $105 | 56 |
| 441 Roberts St | 0.34mi | 2/2.0 (-1) | 1,235 (-9%) | 6mo | $82,000 | $66 | 55 |
| 328 Randolph St | 0.69mi | 3/1.5 | 1,275 (-6%) | 2mo | $75,000 | $59 | 54 |
| 572 Roosevelt St | 0.48mi | 3/1.0 | 1,222 (-10%) | 10mo | $105,000 | $86 | 52 |
| 304 Park Ave | 0.61mi | 3/1.5 | 1,256 (-8%) | 11mo | $157,000 | $125 | 48 |
| 411 W Muller Rd | 0.68mi | 2/1.0 (-1) | 1,302 (-4%) | 12mo | $121,500 | $93 | 46 |
| 436 Carola St | 0.43mi | 4/1.0 (+1) | 1,540 (+13%) | 12mo | $118,000 | $77 | 43 |
| 317 N Highland St | 0.59mi | 3/1.5 | 1,165 (-14%) | 10mo | $117,000 | $100 | 38 |
Match score weights: distance 35% · size 25% · config 20% · recency 20%. Top-matched comps best support the ARV.
Projected returns pro-forma
-3.0% appreciation · 3.0% rent growth · sell at horizon
- IRR
- -11.7%
- Equity multiple
- 0.58×
- Total profit
- $-17,784
- Equity at exit
- $22,351
- IRR
- -2.5%
- Equity multiple
- 0.83×
- Total profit
- $-7,174
- Equity at exit
- $12,961
Cash invested: $41,972 (down + closing). Projections, not guarantees.
Landlord ↔ Tenant lean methodology
- Overall (STATE)
- 43 Moderately Tenant-Leaning
- State Illinois
- 43 Moderately Tenant-Leaning · D+7
- County
- — inherits STATE
- City
- — inherits STATE
ZIP-level market 61610
- Home prices YoY
- -23.7%
- Active inventory
- 24
- Price-to-rent
- 9.3×
Monthly cashflow live
- Estimated rent
- $1,350 medium interval (Pro) →
- Mortgage (P&I)
- −$786
- Tax from tax record
- −$115 /mo · $1,385/yr
- Insurance
- −$62
- HOA
- −$0
- Vacancy / Maint / Mgmt
- −$284
- Net cashflow
- $103
Break-even live
Sensitivity live
| Price | -10% $187 | -5% $145 | +0% $103 | +5% $60 | +10% $18 |
|---|---|---|---|---|---|
| Rent | -10% $-4 | -5% $49 | +0% $103 | +5% $156 | +10% $209 |
| Rate | -1.0pp $178 | -0.5pp $141 | base $103 | +0.5pp $64 | +1.0pp $24 |
UW: 25.0% down · 7.5% · 30yr · 1.5% tax · 5.0% vac · 8.0% maint · 8.0% mgmt
Financing live
Cash to close
- Down payment
- $37,475
- Closing costs
- $4,497
- Reserves months
- —
- Total cash needed
- —
Loan-product check · same deal, 3 products live
Conventional
25% down · 7.5% · 30yr
- Down + closing
- —
- Monthly P&I
- —
- Monthly cashflow
- —
- DSCR
- —
- Eligible?
- —
Personal DTI + credit; lowest rate.
DSCR
20% down · 8.5% · 30yr
- Down + closing
- —
- Monthly P&I
- —
- Monthly cashflow
- —
- DSCR
- —
- Eligible?
- —
No personal income docs; deal must DSCR.
Hard money
10% down · 12.0% · 12mo
- Down + closing
- —
- Monthly P&I
- —
- Monthly cashflow
- —
- DSCR
- —
- Eligible?
- —
Short-term bridge; refi at stabilization.
Rent comps 1 comps
| Address | Beds | Baths | Sqft | Rent | $/sqft | DOM | Units | Dist |
|---|---|---|---|---|---|---|---|---|
| 204 Pekin Ave Apt 2 East Peoria, IL | 2.0 | 1.0 | 1150 | $1,350 | $1.17 | 15d | 1 | 0.98mi |
Listing history 8 events
-
2026-06-01statusdays on market $149,900 Pending 14 DOM
-
2026-05-31days on market $149,900 Active 13 DOM
-
2026-05-30days on market $149,900 Active 12 DOM
-
2026-05-18$149,900 Active
-
2021-08-06historical
-
2009-06-19soldstatus $67,000
-
2009-06-18soldstatus $66,950 449-char remark
Show marketing remark (449 chars)
ESTATE SALE ! Price Reduced Making This A Fantastic Buy ! Nice bungalow In Nice Neighborhood on Generous Corner Lot. Old World Charm with 2 Bedrooms, 2 Enclosed Front Porches, Spacious Living & Dining room and Much More. Newer Roof and Furnace. Full Basement If You Need to Add Living Space. De-Watering System added April '09. Property being sold "as is". Room sizes and square footage is approximate and not guaranteed to be correct.
-
2008-11-15$69,900 449-char remark
Show marketing remark (449 chars)
ESTATE SALE ! Price Reduced Making This A Fantastic Buy ! Nice bungalow In Nice Neighborhood on Generous Corner Lot. Old World Charm with 2 Bedrooms, 2 Enclosed Front Porches, Spacious Living & Dining room and Much More. Newer Roof and Furnace. Full Basement If You Need to Add Living Space. De-Watering System added April '09. Property being sold "as is". Room sizes and square footage is approximate and not guaranteed to be correct.
ⓘ Source: listings_history table (triggers on properties + properties_extension) + one-shot
backfill from property_details.listing_events for pre-trigger history.
Tax reassessment forecast IL · Partial reset (capped growth)
- Current annual tax
- $1,385 · $115/mo
- Projected year-2 tax
- $2,394 · $199/mo
- Expected delta
- +$1,009/yr (+$84/mo · 72.8%)
ⓘ Screening estimate from a state-policy table — verify with the county assessor before closing.
Climate risk First Street
- Flood 1/10 Low FEMA zone X (unshaded) · 0% chance over 30 yrs
- Wildfire 1/10 Low
- Heat 3/10 Moderate 7 d/yr ≥103°F today · 18 d/yr by 30 yrs out
- Wind 2/10 Low 100% chance of damaging wind over 30 yrs
- Air quality 3/10 Moderate 1 unhealthy d/yr today · 3 by 30 yrs out
Nearby sold comps map
Loading sold comps map…
Walkable amenities ~0.75 mi
Loading nearby amenities…
Taxation est. · year 1
- Rental income
- $16,200
- − Mortgage interest
- −$8,397
- − Property taxes
- −$1,385
- − Insurance
- −$750
- − Repairs & maintenance
- −$1,296
- − Management
- −$1,296
- − Depreciation
- −$4,361
- Taxable loss
- −$1,284
- Est. tax savings @ 24.0%
- +$308
- After-tax cash flow
- $1,539/yr
For passive investors: Depreciation is non-cash, so a rental often shows a tax loss while cash-flowing — sheltering income. Rental losses are passive: they offset passive income freely, and up to $25,000/yr can offset ordinary (W-2) income if you actively participate and your MAGI is under $100k (phasing out to $0 by $150k); unused losses carry forward. On sale, claimed depreciation is recaptured at up to 25%, and gains may owe capital-gains tax (a 1031 exchange can defer both). Figures are a year-1 estimate at your 24.0% rate — not tax advice; consult a CPA.
Schools (NCES district)
- District
- East Peoria Chsd 309
- NCES district ID
- 1713230
- Math proficiency
- 17% ▼ -6.00%
- Reading proficiency
- 15% ▼ -9.00%
- Median HH income
- $51,439
- Composite
- 14.75/100
- National rank
- #9394
- State rank
- #482 of 620 in IL
Livability — Creve Coeur
- Score
- 63/100
- State rank
- #755
- US rank
- #15292
Category grades
Schools grade is shown separately in the Schools card above.
Census & demographics
- Census place
- Creve Coeur, IL
- City population
- 4,572
- Population (ZIP)
- 4,572
Population outlook (Tazewell County) Hauer SSP2
- Today (2025)
- 131,252 people
- By 2030
- 128,028 · -2.5%
- By 2040
- 120,443 · -8.2%
- By 2050
- 111,872 · -14.8%
- By 2075
- 89,843 · -31.5%
- By 2100
- 66,468 · -49.4%
Race, ethnicity, and origin ACS 2023
- Neighborhood character
- Predominantly White (94%)
- Race & ethnicity
- White 94% Two or more races 3% Hispanic / Latino 2%
- Common ancestry
- Italian 12% Romanian 2% Lithuanian 1%
- Foreign-born
- 1% · Canada
- Languages at home
- 99% English-only · Spanish 1%
Political lean MEDSL · Tazewell
- 2024 margin
- Strong R (+26.7) · D 35.8% · R 62.5% · Other 1.8%
- 2008→2024 swing
- -20.6pp toward R · 2008: -6.0pp · 2024: -26.7pp
- All cycles
- 2024: R+26.7 2020: R+25.6 2016: R+28.5 2012: R+17.9 2008: R+6.0
Not yet ingested
- Civics
- —
Market trends
- HPI YoY
- ▼ -50.26%
- Current HPI
- 161.4938
- Rent YoY
- —
- Metro
- —
- State GDP YoY
- ▲ 1.59%
- F500 in state
- 60
Industry mix (Fortune 500 HQ in IL)
| Industry | F500 HQs | Revenue |
|---|---|---|
| Insurance | 4 | $201B |
|
||
| Consumer Goods | 4 | $87B |
|
||
| Industrial Machinery | 3 | $64B |
|
||
| Healthcare | 2 | $55B |
|
||
| Retail / Pharmacy | 1 | $148B |
|
||
| Agriculture / Food | 1 | $86B |
|
||
Price history
+114.4% since first listed5 events — show timeline
- 2026-05-18 Listed $149,900 RMLSA as Distributed by MLS Grid
- 2021-08-06 Listing Removed — RMLSA as Distributed by MLS Grid
- 2009-06-19 Sold (Public Records) $67,000 Public Records
- 2009-06-18 Sold (MLS) $66,950 RMLSA as Distributed by MLS Grid
- 2008-11-15 Listed $69,900 RMLSA as Distributed by MLS Grid
Property tax history
+8.5%/yrLatest (2024): $1,385 · +11.0% YoY. Source: county tax records.
Cash-flow waterfall
monthlySold comps — $/sqft
last 12 mo · ≤1 miLoading sold comps…