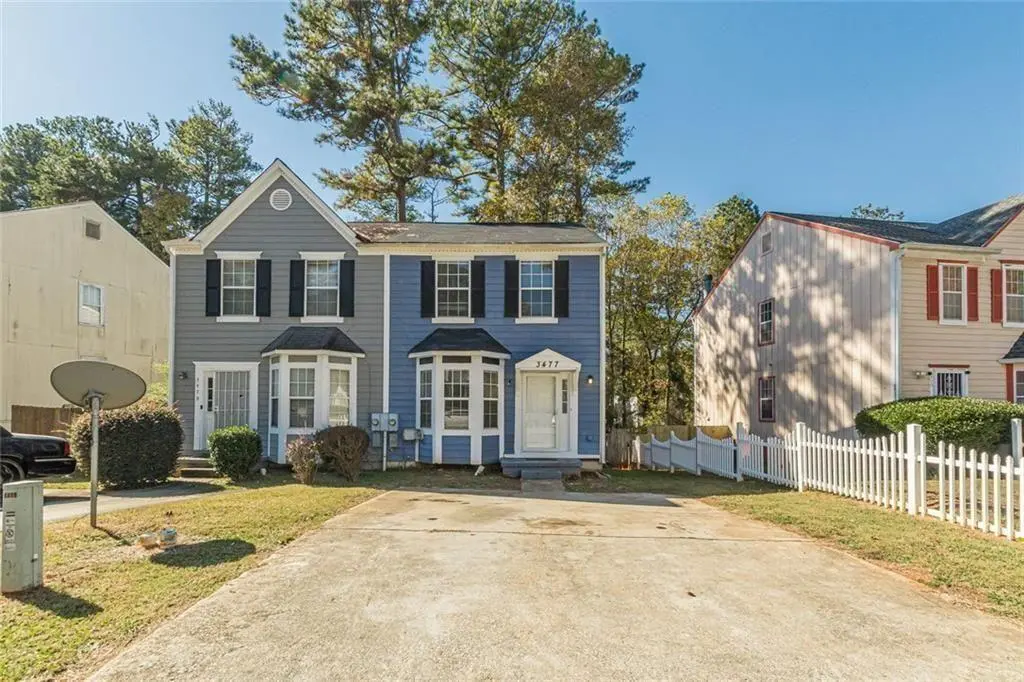
3477 Kingswood Trl · Panthersville, GA
Flood risk 1/10 · Minimal
- FEMA flood zone
- X (unshaded)
- Chance of flooding over 30 yrs
- 0.0%
- Est. flood insurance / yr
- $507 – $1,088
Fire risk 3/10 · Minor
- Est. fire insurance / yr
- $963 – $1,789
Heat risk 6/10 · Moderate
- Hot days now (above 105°F)
- 7 days/yr
- Hot days in 30 yrs
- 19 days/yr
Wind risk 5/10 · Moderate
- Chance of severe wind over 30 yrs
- 24.0%
Air-quality risk 5/10 · Moderate
- Unhealthy air days now
- 6 days/yr
- Unhealthy air days in 30 yrs
- 8 days/yr
Risk factors via First Street. Map © Google.
Why this score? — see what drove the C- grade
The composite is a weighted blend of 9 inputs, each scored 0–100. Each bar is that input's sub-score; the figure is the points it added to the 100-point composite (weight × sub-score).
- Cash flow +18.3/30.0
- ARV discount +14.0/15.0
- 1% rule +5.8/10.0
- DSCR +5.7/10.0
- Livability +3.3/5.0
- Rent growth +3.0/5.0
- Condition / age +2.5/5.0
- Schools +2.1/10.0
- Appreciation +0.0/10.0
$155,000
🖨 Deal sheet (PDF) 📄 Offer letter ✓ Due diligence
Listing remarks MLS
No HOA Fees
Key facts
- 2 parking spots
- Built 1996
- Listed 20 days
Property features AI
Exterior
- Parking: Two total parking spaces; Driveway and parking pad; Open parking available
- Utilities: Public water; Public sewer; 110 volt electric; Electricity, cable, and natural gas available
- Home design: Two-story home; Fee simple ownership; Resale condition
- Construction: Frame and other construction materials; Composition roof; Block and slab foundation; Other structures on the property; Built as part of a multi-unit community (60 units in community)
- Exterior features: Private yard; Fenced backyard with privacy fencing; Deck; Other exterior features
Interior
- Kitchen: Pantry; Electric range
- Bedrooms: Two upper-level bedrooms; No special bedroom features listed
- Flooring: Tile floors
- Bathrooms: Two full bathrooms; One half bathroom (main level)
- Heating & cooling: Central air with heat pump; Forced air heating (natural gas)
- Interior features: One fireplace in the great room / living room; Storm windows; Other interior features; Open concept dining area; Family room
- Laundry & utility: Laundry room; Laundry closet; Electric water heater
Neighborhood map
What this means for you Summary
Snapshot
- This is a 2-bed/2.5-bath townhouse listed at $155k.
Deal economics
- At list price, monthly cash flow is $141 ($2k/yr) — positive.
- The deal already cash-flows at list — no discount required.
- Meets the 1% rule at list price ($2k rent vs $155k).
- Recommended offer: $153k (1.5% below list) — sets the bar for market timing.
- Cap rate 7.4% vs local median 5.3% in Panthersville — top-decile yield for the area; either an underpriced asset or a hidden risk that comps aren't pricing in. Stress-test before assuming the spread holds.
Location & tenants
- Location reads 66/100 on livability (#180 in GA) — a middle-class / working-renter tenant base. Strengths: cost of living A+, housing A+; Watch: crime C-, employment D, amenities F.
- Dekalb County (suburban): math 19% / reading 28% proficiency, ranked #125 of 174 in GA (top 72%) — low school quality limits family demand, transient renter base, plan for 1-2y turnover; 68% free/reduced lunch — lower-income household profile, screen leases tightly.
- Zoned schools: Cedar Grove Middle School (math 2% / reading 17%, grade F, #433 of 470 statewide, top 93%, 777 students, 100% FRL); Cedar Grove High School (math 8% / reading 17%, grade F, #336 of 424 statewide, top 80%, 1,123 students, 100% FRL) — zoned schools average 100% FRL vs 68% district-wide (32 pts higher); higher-poverty schools than district average — tighter screening recommended.
- Zoned-school proficiency averages 11% at this address vs 24% district-wide (-12 pts) — the specific schools serving this property underperform the Dekalb County average; the district grade overstates school quality for this exact location.
- Market conditions: Rents rising (+2.2%/yr); 353 active listings in the ZIP; 40 comparable units currently listed for rent nearby; rentals at typical pace (median 25d on market — plan ~3-4 weeks tenant-placement turnaround); 42% of comp listings sitting > 30 days — soft ceiling on asking rent; 1,240 units permitted in DeKalb County in 2024 (385 in 5+ unit buildings).
- This rent runs 32% of the median local income ($64k/yr) — at the standard rent-burdened threshold; future hikes will face affordability resistance.
Forward outlook
- Local home prices are declining (-3.0%/yr); year-one equity from $1k of loan paydown is wiped out by about $5k of value loss. Plan a longer hold.
- DeKalb County population projected at +28% by 2050 — long-run rental-demand tailwind backs the buy-and-hold thesis.
Negotiation context
- It's been on market 20 days — a 2% lower offer ($153k) is reasonable based on typical stale-listing flexibility.
- 5 sale attempts since 5y ago with the ask held roughly flat each time — persistent listings suggest the price (not the market) is what's stuck; bring a comps-based counter.
Risks & watch-outs
- Climate carrying-cost: moderate wind risk, 24% chance of damaging wind over 30y; extreme-heat days projected 7→19/yr by 2055 (HVAC capex compounding) — expect insurance premiums to compound above CPI over the hold.
Questions for the listing agent
- Is there a deadline driving the sale (1031 exchange, divorce, estate, relocation)? That informs how much negotiation room exists.
- Schools are D-rated, which usually means shorter tenancies and higher turnover. Who's the typical renter profile here, and what's been the actual vacancy rate?
- What's the average days-on-market for RENTAL listings here right now (not sales)? A rising rental-DOM trend means longer vacancies and softer asking-rent achievability than the comps imply.
- What's the recent tenant-quality profile in this submarket — average credit score on applications, eviction rate, late-payment / NSF rate, and stable-employment percentage? A property-management company in the area should have these aggregated.
- How much new for-sale + rental construction is in the pipeline within 1–3 miles? Heavy new supply typically softens prices + rents 12–24 months out; constrained supply supports both.
Investment metrics
- 1% rule
- 1.08% ✓
- Cap rate
- 7.39%
- Cash-on-cash
- 3.91%
- DSCR
- 1.17
- GRM
- 7.7
CMA / ARV
- ARV (median comp)
- $181,066
- List price
- $155,000
- Delta
- -14.40%
- Verdict
- UNDERPRICED
- Comps
- 20 within 1.0 mi
Show comp detail 12 sales within ~0.75 mi
| Address | Dist | Beds/Ba | Sqft | Sold | Price | $/sf | Match |
|---|---|---|---|---|---|---|---|
| 3484 Blazing Pine Path | 0.15mi | 2/1.5 | 1,116 (-4%) | 4mo | $49,000 | $44 | 79 |
| 2301 Waldrop Pl | 0.38mi | 2/2.0 | 1,292 (+11%) | 8mo | $90,000 | $70 | 56 |
| 5203 Waldrop Pl | 0.39mi | 3/2.0 (+1) | 1,292 (+11%) | 2mo | $88,000 | $68 | 55 |
| 13304 Waldrop Cv | 0.43mi | 3/2.0 (+1) | 1,292 (+11%) | 2mo | $70,000 | $54 | 53 |
| 1304 Waldrop Pl | 0.42mi | 3/2.0 (+1) | 1,292 (+11%) | 6mo | $80,000 | $62 | 51 |
| 18204 Waldrop Cv | 0.48mi | 3/2.0 (+1) | 1,292 (+11%) | 3mo | $99,999 | $77 | 50 |
| 18302 Waldrop Cv | 0.48mi | 3/2.0 (+1) | 1,292 (+11%) | 3mo | $75,000 | $58 | 50 |
| 14203 Waldrop Cv #14203 | 0.46mi | 3/2.0 (+1) | 1,292 (+11%) | 6mo | $83,200 | $64 | 48 |
| 14301 Waldrop Cv | 0.46mi | 3/2.0 (+1) | 1,292 (+11%) | 9mo | $83,000 | $64 | 46 |
| 19302 Waldrop Cv | 0.46mi | 3/2.0 (+1) | 1,292 (+11%) | 12mo | $104,500 | $81 | 43 |
| 19201 Waldrop Cv | 0.46mi | 3/2.0 (+1) | 1,292 (+11%) | 13mo | $80,000 | $62 | 42 |
| 19202 Waldrop Cv | 0.46mi | 3/2.0 (+1) | 1,292 (+11%) | 14mo | $58,500 | $45 | 42 |
Match score weights: distance 35% · size 25% · config 20% · recency 20%. Top-matched comps best support the ARV.
Projected returns pro-forma
-3.0% appreciation · 2.18% rent growth · sell at horizon
- IRR
- -11.1%
- Equity multiple
- 0.60×
- Total profit
- $-17,399
- Equity at exit
- $23,111
- IRR
- -3.1%
- Equity multiple
- 0.80×
- Total profit
- $-8,726
- Equity at exit
- $13,402
Cash invested: $43,400 (down + closing). Projections, not guarantees.
Landlord ↔ Tenant lean methodology
- Overall (STATE)
- 90 Strongly Landlord-Friendly
- State Georgia
- 90 Strongly Landlord-Friendly · R+3
- County
- — inherits STATE
- City
- — inherits STATE
ZIP-level market 30034
- Home prices YoY
- -27.4%
- Rents YoY
- 2.2%
- Active inventory
- 353
- Price-to-rent
- 7.7×
Monthly cashflow live
- Estimated rent
- $1,679 high interval (Pro) →
- Mortgage (P&I)
- −$813
- Tax from tax record
- −$308 /mo · $3,694/yr
- Insurance
- −$65
- HOA
- −$0
- Vacancy / Maint / Mgmt
- −$353
- Net cashflow
- $141
Break-even live
Sensitivity live
| Price | -10% $229 | -5% $185 | +0% $141 | +5% $97 | +10% $54 |
|---|---|---|---|---|---|
| Rent | -10% $9 | -5% $75 | +0% $141 | +5% $208 | +10% $274 |
| Rate | -1.0pp $219 | -0.5pp $181 | base $141 | +0.5pp $101 | +1.0pp $60 |
UW: 25.0% down · 7.5% · 30yr · 1.5% tax · 5.0% vac · 8.0% maint · 8.0% mgmt
Financing live
Cash to close
- Down payment
- $38,750
- Closing costs
- $4,650
- Reserves months
- —
- Total cash needed
- —
Loan-product check · same deal, 3 products live
Conventional
25% down · 7.5% · 30yr
- Down + closing
- —
- Monthly P&I
- —
- Monthly cashflow
- —
- DSCR
- —
- Eligible?
- —
Personal DTI + credit; lowest rate.
DSCR
20% down · 8.5% · 30yr
- Down + closing
- —
- Monthly P&I
- —
- Monthly cashflow
- —
- DSCR
- —
- Eligible?
- —
No personal income docs; deal must DSCR.
Hard money
10% down · 12.0% · 12mo
- Down + closing
- —
- Monthly P&I
- —
- Monthly cashflow
- —
- DSCR
- —
- Eligible?
- —
Short-term bridge; refi at stabilization.
Rent comps 40 comps
| Address | Beds | Baths | Sqft | Rent | $/sqft | DOM | Units | Dist |
|---|---|---|---|---|---|---|---|---|
| 3189 Kingswood Gln Decatur, GA | 2.0 | 2.5 | 1152 | $2,100 | $1.82 | 44d | 1 | 0.04mi |
| 3516 Kingswood Run Unit 1 Decatur, GA | 2.0 | 2.0 | 988 | $1,500 | $1.52 | 25d | 1 | 0.10mi |
| 3804 Waldrop Ln Decatur, GA | 3.0 | 2.5 | 1412 | $1,850 | $1.31 | 25d | 1 | 0.15mi |
| 3798 Waldrop Ln Decatur, GA | 3.0 | 2.5 | 1412 | $1,680 | $1.19 | 21d | 1 | 0.16mi |
| 3364 Waldrop Trl Decatur, GA | 3.0 | 3.0 | 1200 | $1,800 | $1.50 | 44d | 1 | 0.24mi |
| 3474 Waldrop Trl Decatur, GA | 3.0 | 2.5 | 1412 | $800 | $0.57 | 44d | 1 | 0.28mi |
| 3489 Waldrop Trl Decatur, GA | 3.0 | 2.5 | 1400 | $1,400 | $1.00 | 44d | 1 | 0.31mi |
| 3101 Waldrop Pl Decatur, GA | 3.0 | 2.0 | 1290 | $1,395 | $1.08 | 44d | 1 | 0.37mi |
| 6303 Waldrop Pl Decatur, GA | 3.0 | 2.0 | 1292 | $1,900 | $1.47 | 44d | 1 | 0.41mi |
| 6201 Waldrop Pl Decatur, GA | 3.0 | 2.0 | 1300 | $1,350 | $1.04 | 19d | 1 | 0.41mi |
| 11101 Waldrop Pl Decatur, GA | 3.0 | 2.0 | 1293 | $1,550 | $1.20 | 44d | 1 | 0.45mi |
| 17301 Waldrop Cv Decatur, GA | 3.0 | 2.0 | 1292 | $1,550 | $1.20 | 18d | 1 | 0.50mi |
| 17301 Waldrop Cv Decatur, GA | 3.0 | 2.0 | 1292 | $1,550 | $1.20 | 44d | 1 | 0.50mi |
| 4029 Flat Shoals Pkwy Decatur, GA | 1.0–2.0 | 1.0–2.0 | 755 | $2,053 | $2.72 | 3d | 17 | 0.55mi |
| 4035 Flat Shoals Pkwy Decatur, GA | 1.0–3.0 | 1.0–2.0 | 893 | $1,344 | $1.50 | 0d | 28 | 0.66mi |
| 4210 Waldrop Hills Ter Decatur, GA | 3.0 | 2.5 | 1200 | $1,666 | $1.39 | 44d | 1 | 0.74mi |
| 3205 Quincetree Ln Decatur, GA | 2.0 | 2.0 | 1218 | $1,600 | $1.31 | 19d | 1 | 0.80mi |
| 3830 Riverside Pkwy Decatur, GA | 3.0 | 2.5 | 1286 | $1,865 | $1.45 | 0d | 1 | 0.84mi |
| 3575 Oakvale Rd #402 Decatur, GA | 3.0 | 2.0 | 1420 | $1,623 | $1.14 | 2d | 1 | 0.84mi |
| 3186 Quincetree Ln Decatur, GA | 2.0 | 2.0 | 994 | $1,350 | $1.36 | 44d | 1 | 0.84mi |
| 3575 Oakvale Rd Decatur, GA | 3.0–4.0 | 2.0 | 1374 | $1,095 | $0.80 | 16d | 4 | 0.86mi |
| 3868 Leyland Dr Decatur, GA | 3.0 | 2.5 | 1312 | $1,923 | $1.47 | 44d | 1 | 0.88mi |
| 3321 Peppertree Cir Decatur, GA | 1.0–3.0 | 1.0 | 813 | $1,098 | $1.35 | 21d | 31 | 0.89mi |
| 3833 Conley Downs Dr Decatur, GA | 3.0 | 1.5 | 1248 | $1,713 | $1.37 | 0d | 1 | 0.94mi |
| 3574 Saratoga Cir Decatur, GA | 3.0 | 2.5 | 1500 | $2,103 | $1.40 | 22d | 1 | 0.94mi |
| 3405 Greypointe Cv Decatur, GA | 1.0 | 1.0 | 1000 | $1,450 | $1.45 | 4d | 1 | 0.98mi |
| 2945 Woody Ct Decatur, GA | 3.0 | 2.5 | 1488 | $1,850 | $1.24 | 25d | 1 | 0.98mi |
| 2840 Vining Ridge Ter Unit 1 Decatur, GA | 3.0 | 2.5 | 1433 | $1,425 | $0.99 | 0d | 1 | 1.06mi |
| 2840 Vining Ridge Ter Unit 1 Decatur, GA | 3.0 | 2.5 | 1433 | $1,425 | $0.99 | 3d | 1 | 1.06mi |
| 3800 Flat Shoals Pkwy Decatur, GA | 2.0–3.0 | 1.5–2.5 | 1370 | $1,099 | $0.80 | 2d | 51 | 1.12mi |
| 3859 Flat Shoals Pkwy Decatur, GA | 1.0–2.0 | 1.0–2.5 | 1018 | $1,365 | $1.34 | 0d | 8 | 1.21mi |
| 3515 Shepherds Path Decatur, GA | 3.0 | 2.0 | 1279 | $1,495 | $1.17 | 44d | 1 | 1.23mi |
| 3477 Shepherds Path Decatur, GA | 2.0 | 2.0 | 1200 | $1,200 | $1.00 | 44d | 1 | 1.23mi |
| 3763 Soapstone Rd Decatur, GA | 3.0 | 3.0 | 1400 | $1,700 | $1.21 | 25d | 1 | 1.25mi |
| 3166 Big Springs Ct Decatur, GA | 3.0 | 2.0 | 1493 | $1,900 | $1.27 | 44d | 1 | 1.27mi |
| 3821 River Rd Ellenwood, GA | 3.0 | 2.0 | 1455 | $2,195 | $1.51 | 44d | 1 | 1.30mi |
| 100 Woodberry Pl Decatur, GA | 1.0–3.0 | 1.0–2.0 | 1106 | $1,483 | $1.34 | 0d | 18 | 1.32mi |
| 3162 Panthers Trce Decatur, GA | 3.0 | 2.5 | 1434 | $1,700 | $1.19 | 44d | 1 | 1.37mi |
| 3188 Panthers Trce Decatur, GA | 2.0 | 3.0 | 1350 | $1,495 | $1.11 | 44d | 1 | 1.39mi |
| 3100 Lumby Dr Decatur, GA | 1.0–3.0 | 1.0–2.0 | 1057 | $1,486 | $1.41 | 0d | 27 | 1.39mi |
Listing history 15 events
-
2026-05-18status Pending 11-char remark
-
2026-04-28$155,000 Active 11-char remark
Show marketing remark (11 chars)
No HOA Fees
-
2026-04-28$155,000 New 11-char remark
Show marketing remark (11 chars)
No HOA Fees
-
2026-04-24historical $155,000 11-char remark
Show marketing remark (11 chars)
No HOA Fees
-
2026-04-24historical $155,000 11-char remark
Show marketing remark (11 chars)
No HOA Fees
-
2026-04-10historical
-
2026-01-29historical
-
2025-11-10$175,000 New
-
2025-11-10$185,000 New
-
2021-09-28soldstatus $148,000
-
2021-09-20soldstatus $148,000 Sold
-
2021-08-20status Under Contract
-
2021-08-14$145,000 New
-
2004-12-20soldstatus $105,100
-
1996-11-07soldstatus $68,900
ⓘ Source: listings_history table (triggers on properties + properties_extension) + one-shot
backfill from property_details.listing_events for pre-trigger history.
Tax reassessment forecast GA · Resets to sale price
- Current annual tax
- $3,694 · $308/mo
- Projected year-2 tax
- $3,694 · $308/mo
- Expected delta
- $0/yr ($0/mo · -0.0%)
ⓘ Screening estimate from a state-policy table — verify with the county assessor before closing.
Climate risk First Street
- Flood 1/10 Low FEMA zone X (unshaded) · 0% chance over 30 yrs
- Wildfire 3/10 Moderate
- Heat 6/10 Major 7 d/yr ≥105°F today · 19 d/yr by 30 yrs out
- Wind 5/10 Major 24% chance of damaging wind over 30 yrs
- Air quality 5/10 Major 6 unhealthy d/yr today · 8 by 30 yrs out
Nearby sold comps map
Loading sold comps map…
Walkable amenities ~0.75 mi
Loading nearby amenities…
Taxation est. · year 1
- Rental income
- $20,149
- − Mortgage interest
- −$8,682
- − Property taxes
- −$3,694
- − Insurance
- −$775
- − Repairs & maintenance
- −$1,612
- − Management
- −$1,612
- − Depreciation
- −$4,509
- Taxable loss
- −$735
- Est. tax savings @ 24.0%
- +$176
- After-tax cash flow
- $1,871/yr
For passive investors: Depreciation is non-cash, so a rental often shows a tax loss while cash-flowing — sheltering income. Rental losses are passive: they offset passive income freely, and up to $25,000/yr can offset ordinary (W-2) income if you actively participate and your MAGI is under $100k (phasing out to $0 by $150k); unused losses carry forward. On sale, claimed depreciation is recaptured at up to 25%, and gains may owe capital-gains tax (a 1031 exchange can defer both). Figures are a year-1 estimate at your 24.0% rate — not tax advice; consult a CPA.
Schools (NCES district)
- District
- Dekalb County
- NCES district ID
- 1301740
- Math proficiency
- 19% ▼ -12.00%
- Reading proficiency
- 28% ▼ -7.00%
- Median HH income
- $51,448
- Composite
- 20.92/100
- National rank
- #8482
- State rank
- #125 of 174 in GA
Livability — Panthersville
- Score
- 66/100
- State rank
- #180
- US rank
- #11244
Category grades
Schools grade is shown separately in the Schools card above.
Census & demographics
- County
- Dekalb County · 782,738 people
- Metro
- Atlanta-Sandy Springs-Alpharetta, GA
- Population (ZIP)
- 41,847
- Household income
- $63,517
- Rent vs Own
- Severe rent burden
- 1659.0
Population outlook (DeKalb County) Hauer SSP2
- Today (2025)
- 839,977 people
- By 2030
- 891,768 · +6.2%
- By 2040
- 988,894 · +17.7%
- By 2050
- 1,074,583 · +27.9%
- By 2075
- 1,245,026 · +48.2%
- By 2100
- 1,303,135 · +55.1%
Race, ethnicity, and origin ACS 2023
- Neighborhood character
- Predominantly Black (90%)
- Race & ethnicity
- Black 90% White 4% Two or more races 3% Hispanic / Latino 2%
- Common ancestry
- Hispanic 1% Lithuanian 1%
- Foreign-born
- 8% · Canada
- Languages at home
- 93% English-only · Spanish 2% French/Haitian/Cajun 1%
Political lean MEDSL · DeKalb
- 2024 margin
- Solid D (+64.8) · D 81.9% · R 17.1% · Other 1.0%
- 2008→2024 swing
- +6.1pp toward D · 2008: 58.6pp · 2024: 64.8pp
- All cycles
- 2024: D+64.8 2020: D+67.4 2016: D+64.8 2012: D+56.8 2008: D+58.6
Not yet ingested
- Civics
- —
Market trends
- HPI YoY
- ▼ -78.92%
- Current HPI
- 209.5638
- Rent YoY
- ▲ 2.18%
- Metro
- Atlanta-Sandy Springs-Alpharetta, GA
- State GDP YoY
- ▲ 2.66%
- F500 in state
- 28
Industry mix (Fortune 500 HQ in GA)
| Industry | F500 HQs | Revenue |
|---|---|---|
| Paper / Packaging | 2 | $29B |
|
||
| Retail | 1 | $160B |
|
||
| Transportation / Logistics | 1 | $91B |
|
||
| Airlines | 1 | $62B |
|
||
| Consumer Goods | 1 | $47B |
|
||
| Utilities | 1 | $25B |
|
||
Price history
+125.0% since first listed16 events — show timeline
- 2026-05-21 Pending — GAMLS
- 2026-05-18 Pending — FMLS
- 2026-04-28 Listed $155,000 FMLS
- 2026-04-28 Listed $155,000 GAMLS
- 2026-04-24 Coming Soon $155,000 GAMLS
- 2026-04-24 Coming Soon $155,000 FMLS
- 2026-04-10 Listing Removed — GAMLS
- 2026-01-29 Listing Removed — GAMLS
- 2025-11-10 Listed $185,000 GAMLS
- 2025-11-10 Listed $175,000 GAMLS
- 2021-09-28 Sold (Public Records) $148,000 Public Records
- 2021-09-20 Sold (MLS) $148,000 GAMLS
- 2021-08-20 Pending — GAMLS
- 2021-08-14 Listed $145,000 GAMLS
- 2004-12-20 Sold (Public Records) $105,100 Public Records
- 1996-11-07 Sold (Public Records) $68,900 Public Records
Property tax history
+9.3%/yrLatest (2025): $3,694 · +6.3% YoY. Source: county tax records.
Cash-flow waterfall
monthlySold comps — $/sqft
last 12 mo · ≤1 miLoading sold comps…