410 Elks Dr · San Antonio, TX
Flood risk 1/10 · Minimal
- FEMA flood zone
- X (unshaded)
- Chance of flooding over 30 yrs
- 0.0%
- Est. flood insurance / yr
- $507 – $1,088
Fire risk 1/10 · Minimal
- Est. fire insurance / yr
- $1,222 – $2,270
Heat risk 8/10 · Major
- Hot days now (above 108°F)
- 7 days/yr
- Hot days in 30 yrs
- 22 days/yr
Wind risk 8/10 · Major
- Chance of severe wind over 30 yrs
- 80.0%
Air-quality risk 2/10 · Minimal
- Unhealthy air days now
- 1 days/yr
- Unhealthy air days in 30 yrs
- 2 days/yr
Risk factors via First Street. Map © Google.
Why this score? — see what drove the B grade
The composite is a weighted blend of 9 inputs, each scored 0–100. Each bar is that input's sub-score; the figure is the points it added to the 100-point composite (weight × sub-score).
- Cash flow +30.0/30.0
- 1% rule +10.0/10.0
- DSCR +10.0/10.0
- ARV discount +7.5/15.0
- Appreciation +4.8/10.0
- Livability +4.0/5.0
- Rent growth +2.5/5.0
- Condition / age +2.5/5.0
- Schools +1.9/10.0
$39,000
🖨 Deal sheet 📄 Offer letter ✓ Due diligence
Listing remarks
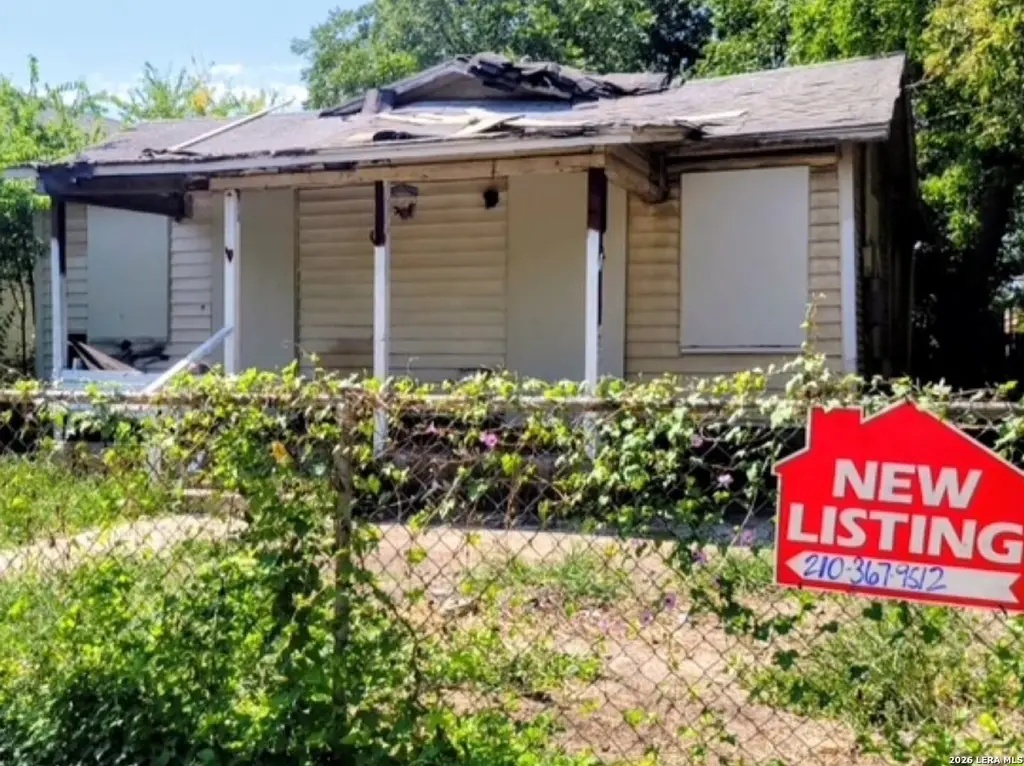
Prime investment opportunity in Harlandale on San Antonio's Southside! This 2-bed, 1-bath home offers 714 sq ft on a large lot with room to expand. Located next door to a recently flipped property, this is the perfect chance to renovate, rebuild, or hold as a rental. Bring your vision and bring this one back to life! LOT MEASURES 50X160 (5300SQFT)
Key facts
- Large lot
- 5,314 sq ft lot
- Built 1945
Tags
Property features AI
Finance
- Financial info: Not indicated eligible for Down Payment Resource
Exterior
- Utilities: City water/sewer
- Home design: Pre-owned home; Located in HARLANDALE subdivision
- Construction: Approximately 81 years old; Roof: Not applicable
- Exterior features: Wood and siding exterior; Neighborhood park/playground
Interior
- Kitchen: Kitchen (8 x 10)
- Bedrooms: Master bedroom on lower level with outside access (12 x 14); Second bedroom (8 x 10)
- Flooring: Linoleum flooring
- Bathrooms: One full bathroom
- Heating & cooling: Natural gas heating
- Interior features: One living area
Neighborhood map
What this means for you Summary
Snapshot
- This is a 2-bed/1.0-bath single-family listed at $39k.
Deal economics
- At list price, monthly cash flow is $563 ($7k/yr) — positive.
- The deal already cash-flows at list — no discount required.
- Meets the 1% rule at list price ($1k rent vs $39k).
- Recommended offer: $38k (3.0% below list) — sets the bar for market timing.
- Cap rate 23.6% vs local median 3.8% in San Antonio — top-decile yield for the area; either an underpriced asset or a hidden risk that comps aren't pricing in. Stress-test before assuming the spread holds.
Location & tenants
- Location reads 80/100 on livability (#31 in TX, #1,616 nationally) — a professional / high-income tenant draw. Strengths: amenities A+, commute A+, cost of living A+; Watch: crime F.
- Harlandale ISD (urban): math 20% / reading 27% proficiency, ranked #748 of 826 in TX (top 91%) — low school quality limits family demand, transient renter base, plan for 1-2y turnover; 66% free/reduced lunch — lower-income household profile, screen leases tightly.
- Zoned schools: V M Adams El (math 10% / reading 22%, grade F, #3,974 of 4,322 statewide, top 92%, 591 students, 95% FRL); Harlandale H S (math 17% / reading 29%, grade F, #1,348 of 1,632 statewide, top 83%, 1,664 students, 82% FRL) — zoned schools average 88% FRL vs 66% district-wide (22 pts higher); higher-poverty schools than district average — tighter screening recommended.
- Market conditions: 152 active listings in the ZIP; 17 comparable units currently listed for rent nearby; rentals at typical pace (median 24d on market — plan ~3-4 weeks tenant-placement turnaround); 41% of comp listings sitting > 30 days — soft ceiling on asking rent; 8,308 units permitted in Bexar County in 2024 (2,506 in 5+ unit buildings).
Forward outlook
- In year one you build about $95 of equity ($270 loan paydown + $-175 appreciation (-0.5% local appreciation)).
- Bexar County population projected at +50% by 2050 — long-run rental-demand tailwind backs the buy-and-hold thesis.
- At projected returns (-0.5% appreciation + 3.0% rent growth), your $11k cash investment doubles in ~2 years — after that, you're playing with house money.
Negotiation context
- It's been on market 34 days — a 3% lower offer ($38k) is reasonable based on typical stale-listing flexibility.
Risks & watch-outs
- Watch-outs: built in 1945 — expect roof / HVAC / electrical / plumbing capex.
- Climate carrying-cost: severe wind risk, 80% chance of damaging wind over 30y; extreme-heat days projected 7→22/yr by 2055 (HVAC capex compounding) — expect insurance premiums to compound above CPI over the hold.
Questions for the listing agent
- It's been on market 34 days. Have you received any prior offers? Is the seller open to a 3% concession, seller financing, or rate buy-down credit?
- Built in 1945 — when were the roof, HVAC, electrical panel, plumbing, and water heater last replaced?
- Is there a deadline driving the sale (1031 exchange, divorce, estate, relocation)? That informs how much negotiation room exists.
- Crime grade is F in this area — have there been break-ins, vandalism, or insurance claims at this property in the last 3 years? What carrier currently insures it and at what premium?
- What's the average days-on-market for RENTAL listings here right now (not sales)? A rising rental-DOM trend means longer vacancies and softer asking-rent achievability than the comps imply.
- What's the recent tenant-quality profile in this submarket — average credit score on applications, eviction rate, late-payment / NSF rate, and stable-employment percentage? A property-management company in the area should have these aggregated.
- How much new for-sale + rental construction is in the pipeline within 1–3 miles? Heavy new supply typically softens prices + rents 12–24 months out; constrained supply supports both.
Investment metrics
- 1% rule
- 2.70% ✓
- Cap rate
- 23.62%
- Cash-on-cash
- 61.87%
- DSCR
- 3.75
- GRM
- 3.1
CMA / ARV
- ARV (median comp)
- $122,805
- List price
- $39,000
- Delta
- -68.24%
- Verdict
- UNDERPRICED
- Comps
- 20 within 1.0 mi
Show comp detail 7 sales within ~0.75 mi
| Address | Dist | Beds/Ba | Sqft | Sold | Price | $/sf | Match |
|---|---|---|---|---|---|---|---|
| 1243 W Harlan Ave | 0.16mi | 2/1.0 | 672 (-6%) | 17mo | $50,000 | $74 | 68 |
| 1556 Flanders | 0.39mi | 2/1.0 | 657 (-8%) | 14mo | $125,400 | $191 | 57 |
| 1254 Chalmers Ave | 0.24mi | 2/1.0 | 638 (-11%) | 18mo | $75,000 | $118 | 55 |
| 726 Southcross | 0.56mi | 2/1.0 | 770 (+8%) | 11mo | $106,999 | $139 | 52 |
| 303 Oconee | 0.65mi | 2/1.0 | 770 (+8%) | 6mo | $75,000 | $97 | 52 |
| 214 Eskimo St | 0.75mi | 2/1.0 | 720 (+1%) | 19mo | $75,000 | $104 | 48 |
| 858 Division Ave | 0.59mi | 2/1.0 | 818 (+15%) | 20mo | $85,000 | $104 | 31 |
Match score weights: distance 35% · size 25% · config 20% · recency 20%. Top-matched comps best support the ARV.
Projected returns pro-forma
-0.45% appreciation · 3.0% rent growth · sell at horizon
- IRR
- 63.3%
- Equity multiple
- 4.11×
- Total profit
- $33,916
- Equity at exit
- $10,456
- IRR
- 65.7%
- Equity multiple
- 8.32×
- Total profit
- $79,982
- Equity at exit
- $11,896
Cash invested: $10,920 (down + closing). Projections, not guarantees.
Landlord ↔ Tenant lean methodology
- Overall (STATE)
- 87 Strongly Landlord-Friendly
- State Texas
- 87 Strongly Landlord-Friendly · R+5
- County
- — inherits STATE
- City
- — inherits STATE
ZIP-level market 78211
- Home prices YoY
- -0.2%
- Active inventory
- 152
- Price-to-rent
- 3.1×
Monthly cashflow live
- Estimated rent
- $1,054 high interval (Pro) →
- Mortgage (P&I)
- −$205
- Tax est. 1.5%
- −$49 /mo · $585/yr
- Insurance
- −$16
- HOA
- −$0
- Vacancy / Maint / Mgmt
- −$221
- Net cashflow
- $563
Break-even live
UW: 25.0% down · 7.5% · 30yr · 1.5% tax · 5.0% vac · 8.0% maint · 8.0% mgmt
Financing live
Cash to close
- Down payment
- $9,750
- Closing costs
- $1,170
- Reserves months
- —
- Total cash needed
- —
Loan-product check · same deal, 3 products live
Conventional
25% down · 7.5% · 30yr
- Down + closing
- —
- Monthly P&I
- —
- Monthly cashflow
- —
- DSCR
- —
- Eligible?
- —
Personal DTI + credit; lowest rate.
DSCR
20% down · 8.5% · 30yr
- Down + closing
- —
- Monthly P&I
- —
- Monthly cashflow
- —
- DSCR
- —
- Eligible?
- —
No personal income docs; deal must DSCR.
Hard money
10% down · 12.0% · 12mo
- Down + closing
- —
- Monthly P&I
- —
- Monthly cashflow
- —
- DSCR
- —
- Eligible?
- —
Short-term bridge; refi at stabilization.
Rent comps 17 comps
| Address | Beds | Baths | Sqft | Rent | $/sqft | DOM | Units | Dist |
|---|---|---|---|---|---|---|---|---|
| 1222 Brighton Ave Unit B San Antonio, TX | 3.0 | 1.0 | 725 | $999 | $1.38 | 17d | 1 | 0.17mi |
| 1202 Division Ave San Antonio, TX | 1.0 | 1.0 | 550 | $1,100 | $2.00 | 24d | 1 | 0.39mi |
| 620 Linden Ave Unit 2 San Antonio, TX | 2.0 | 1.0 | 733 | $1,200 | $1.64 | 43d | 1 | 0.55mi |
| 834 Division Ave San Antonio, TX | 2.0 | 1.0 | 700 | $1,050 | $1.50 | 24d | 1 | 0.64mi |
| 416 Collingsworth Unit 2 San Antonio, TX | 2.0 | 1.0 | 570 | $1,100 | $1.93 | 43d | 1 | 1.01mi |
| 515 Humble Ave San Antonio, TX | 1.0 | 1.0 | 700 | $810 | $1.16 | 43d | 1 | 1.18mi |
| 806 McCauley Blvd San Antonio, TX | 2.0 | 1.0 | 670 | $895 | $1.34 | 43d | 1 | 1.22mi |
| 103 Stanley Ct Unit 1 San Antonio, TX | 1.0 | 1.0 | 450 | $900 | $2.00 | 20d | 1 | 1.31mi |
| 107 Stanley Ct Apt 4 San Antonio, TX | 1.0 | 1.0 | 375 | $825 | $2.20 | 4d | 1 | 1.31mi |
| 107 Stanley Ct Apt 3 San Antonio, TX | 2.0 | 1.0 | 575 | $950 | $1.65 | 20d | 1 | 1.31mi |
| 520 Prado St Unit 1 San Antonio, TX | 2.0 | 1.0 | 620 | $799 | $1.29 | 43d | 1 | 1.38mi |
| 675 W Pyron Ave San Antonio, TX | 2.0 | 1.0 | 672 | $1,150 | $1.71 | 24d | 1 | 1.42mi |
| 2238 Interstate 35 Access Rd Unit 35 San Antonio, TX | 1.0 | 1.0 | 638 | $850 | $1.33 | 43d | 1 | 1.42mi |
| 350 Barrett Pl San Antonio, TX | 2.0 | 1.0 | 616 | $1,225 | $1.99 | 4d | 1 | 1.43mi |
| 330 Barrett Pl San Antonio, TX | 1.0 | 1.0 | 400 | $900 | $2.25 | 12d | 1 | 1.43mi |
| 165 Division Ave Unit 2 San Antonio, TX | 1.0 | 1.0 | 617 | $700 | $1.13 | 22d | 1 | 1.49mi |
| 165 Division Ave Unit 2 San Antonio, TX | 1.0 | 1.0 | 617 | $725 | $1.18 | 43d | 1 | 1.49mi |
Listing history 15 events
-
2026-06-18days on market $39,000 Active 34 DOM
-
2026-06-17days on market $39,000 Active 33 DOM
-
2026-06-16days on market $39,000 Active 32 DOM
-
2026-06-15days on market $39,000 Active 31 DOM
-
2026-06-13days on market $39,000 Active 29 DOM
-
2026-06-13days on market $39,000 Active 28 DOM
-
2026-06-09days on market $39,000 Active 25 DOM
-
2026-06-08statusdays on market $39,000 Active 24 DOM
-
2026-06-07days on market $39,000 Price Change 23 DOM
-
2026-06-04days on market $39,000 Price Change 20 DOM
-
2026-06-03days on market $39,000 Price Change 19 DOM
-
2026-06-02days on market $39,000 Price Change 18 DOM
-
2026-06-01days on market $39,000 Price Change 17 DOM
-
2026-05-31days on market $39,000 Price Change 16 DOM
-
2026-05-15$43,000 New 351-char remark
ⓘ Source: listings_history table (triggers on properties + properties_extension) + one-shot
backfill from property_details.listing_events for pre-trigger history.
Climate risk First Street
- Flood 1/10 Low FEMA zone X (unshaded) · 0% chance over 30 yrs
- Wildfire 1/10 Low
- Heat 8/10 Severe 7 d/yr ≥108°F today · 22 d/yr by 30 yrs out
- Wind 8/10 Severe 80% chance of damaging wind over 30 yrs
- Air quality 2/10 Low 1 unhealthy d/yr today · 2 by 30 yrs out
Nearby sold comps map
Loading sold comps map…
Walkable amenities ~0.75 mi
Loading nearby amenities…
Taxation est. · year 1
- Rental income
- $12,646
- − Mortgage interest
- −$2,185
- − Property taxes
- −$585
- − Insurance
- −$195
- − Repairs & maintenance
- −$1,012
- − Management
- −$1,012
- − Depreciation
- −$1,135
- Taxable income
- $6,523
- Est. tax owed @ 24.0%
- −$1,566
- After-tax cash flow
- $5,190/yr
For passive investors: Depreciation is non-cash, so a rental often shows a tax loss while cash-flowing — sheltering income. Rental losses are passive: they offset passive income freely, and up to $25,000/yr can offset ordinary (W-2) income if you actively participate and your MAGI is under $100k (phasing out to $0 by $150k); unused losses carry forward. On sale, claimed depreciation is recaptured at up to 25%, and gains may owe capital-gains tax (a 1031 exchange can defer both). Figures are a year-1 estimate at your 24.0% rate — not tax advice; consult a CPA.
Schools (NCES district)
- District
- Harlandale ISD
- NCES district ID
- 4822470
- Math proficiency
- 20% ▼ -22.00%
- Reading proficiency
- 27% ▼ -9.00%
- Median HH income
- $33,850
- Composite
- 19.25/100
- National rank
- #8806
- State rank
- #748 of 826 in TX
Livability — San Antonio
- Score
- 80/100
- State rank
- #31
- US rank
- #1616
Category grades
Schools grade is shown separately in the Schools card above.
Census & demographics
- Census place
- San Antonio, TX
- County
- Bexar County · 1,990,555 people
- City population
- 1,806,925
- Metro
- San Antonio-New Braunfels, TX
- Population (ZIP)
- 30,857
- Household income
- $55,436
- Rent vs Own
- Severe rent burden
- 729.0
Population outlook (Bexar County) Hauer SSP2
- Today (2025)
- 2,336,851 people
- By 2030
- 2,560,728 · +9.6%
- By 2040
- 3,020,569 · +29.3%
- By 2050
- 3,493,522 · +49.5%
- By 2075
- 4,668,459 · +99.8%
- By 2100
- 5,533,242 · +136.8%
Race, ethnicity, and origin ACS 2023
- Neighborhood character
- Predominantly Hispanic (93%)
- Race & ethnicity
- Hispanic / Latino 93% Two or more races 30% White 5% Black 1% Native American 1%
- Hispanic origin (detail)
- Mexican 76%
- Foreign-born
- 18% · Canada
- Languages at home
- 35% English-only · Spanish 65%
Political lean MEDSL · Bexar
- 2024 margin
- Lean D (+9.8) · D 54.3% · R 44.6% · Other 1.1%
- 2008→2024 swing
- +4.2pp toward D · 2008: 5.6pp · 2024: 9.8pp
- All cycles
- 2024: D+9.8 2020: D+18.2 2016: D+13.5 2012: D+4.6 2008: D+5.6
Not yet ingested
- Civics
- —
Market trends
- HPI YoY
- ▼ -0.45%
- Current HPI
- 241.1709
- Rent YoY
- —
- Metro
- San Antonio-New Braunfels, TX
- State GDP YoY
- ▲ 3.95%
- F500 in state
- 110
Industry mix (Fortune 500 HQ in TX)
| Industry | F500 HQs | Revenue |
|---|---|---|
| Energy | 16 | $1,198B |
|
||
| Technology | 5 | $198B |
|
||
| Engineering / Construction | 4 | $72B |
|
||
| Energy Services | 3 | $60B |
|
||
| Utilities | 3 | $41B |
|
||
| Healthcare | 2 | $330B |
|
||
Price history
-9.3% since first listed2 events — show timeline
- 2026-05-29 Price Changed $39,000 LERA
- 2026-05-15 Listed $43,000 LERA
Property tax history
+6.6%/yrLatest (2025): $2,051 · +9.8% YoY. Source: county tax records.
Cash-flow waterfall
monthlySold comps — $/sqft
last 12 mo · ≤1 miLoading sold comps…