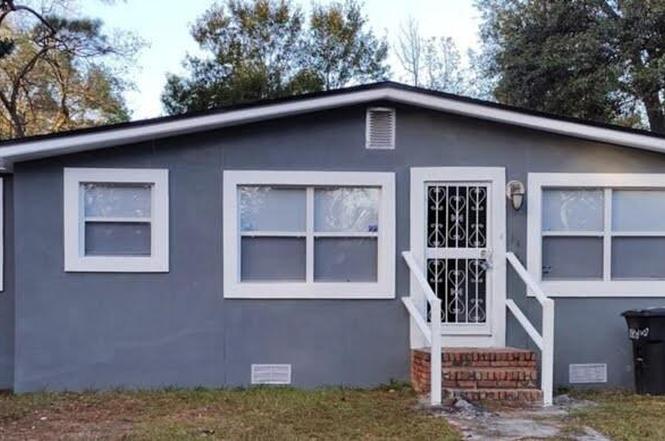
1853 W 27th St · Jacksonville, FL
Flood risk 1/10 · Minimal
- FEMA flood zone
- X (unshaded)
- Chance of flooding over 30 yrs
- 0.0%
- Est. flood insurance / yr
- $507 – $1,088
Fire risk 1/10 · Minimal
- Est. fire insurance / yr
- $947 – $1,759
Heat risk 9/10 · Severe
- Hot days now (above 107°F)
- 7 days/yr
- Hot days in 30 yrs
- 20 days/yr
Wind risk 9/10 · Severe
- Chance of severe wind over 30 yrs
- 99.0%
Air-quality risk 4/10 · Minor
- Unhealthy air days now
- 6 days/yr
- Unhealthy air days in 30 yrs
- 6 days/yr
Risk factors via First Street. Map © Google.
Why this score? — see what drove the D- grade
The composite is a weighted blend of 9 inputs, each scored 0–100. Each bar is that input's sub-score; the figure is the points it added to the 100-point composite (weight × sub-score).
- Cash flow +14.8/30.0
- DSCR +4.5/10.0
- Livability +4.2/5.0
- Schools +3.9/10.0
- 1% rule +3.5/10.0
- Rent growth +3.0/5.0
- Condition / age +2.5/5.0
- ARV discount +0.0/15.0
- Appreciation +0.0/10.0
$199,850
🖨 Deal sheet (PDF) 📄 Offer letter ✓ Due diligence
Listing remarks MLS
The house has been remodeled from top to bottom. Brand new roof, brand new floor joist, brand new flooring, brand new central air and heat, paint, plumbing and electrical.
Key facts
- Close to parks
- Close to schools
- 1-year home warranty
Tags
Property features AI
Finance
- HOA & community: Not a senior community
Exterior
- Parking: Off-street parking
- Utilities: 150 amp electrical service; Public sewer; Sewer available; Water available; Water connected
- Home design: Single-family residence; One level; Faces west
- Exterior features: Shingle roof; City street frontage; Asphalt road surface
Interior
- Kitchen: Electric range
- Bedrooms: 5 bedrooms
- Flooring: Tile
- Bathrooms: 2 full bathrooms
- Heating & cooling: Central heating; Central air conditioning
- Interior features: Tile flooring; Electric range
Neighborhood map
What this means for you Summary
Snapshot
- This is a 5-bed/2.0-bath single-family listed at $200k.
Deal economics
- At list price, monthly cash flow is $55 ($657/yr) — positive.
- The deal already cash-flows at list — no discount required.
- To meet the 1% rule (rent ≥ 1% of price), the offer needs to be $169k (15.3% below list).
- Recommended offer: $169k (15.3% below list) — sets the bar for 1% rule.
- Cap rate 6.6% vs local median 3.9% in Jacksonville — top-decile yield for the area; either an underpriced asset or a hidden risk that comps aren't pricing in. Stress-test before assuming the spread holds.
Location & tenants
- Location reads 83/100 on livability (#50 in FL, #911 nationally) — a professional / high-income tenant draw. Strengths: amenities A+, commute A+, housing A+.
- Duval (urban): math 46% / reading 45% proficiency, ranked #48 of 73 in FL (top 66%) — families likely to look elsewhere, expect single-tenant / working-renter base with shorter leases.
- Zoned schools: Grasp Academy (math 18% / reading 14%, grade F, #2,130 of 2,144 statewide, top 99%, 271 students, 52% FRL); Matthew W. Gilbert Middle School (math 26% / reading 17%, grade F, #553 of 571 statewide, top 97%, 688 students, 86% FRL); William M. Raines High School (math 14% / reading 13%, grade F, #616 of 667 statewide, top 92%, 1,217 students, 78% FRL) — zoned schools average 72% FRL vs 49% district-wide (23 pts higher); higher-poverty schools than district average — tighter screening recommended.
- Zoned-school proficiency averages 17% at this address vs 46% district-wide (-28 pts) — the specific schools serving this property underperform the Duval average; the district grade overstates school quality for this exact location.
- Market conditions: Rents rising (+1.8%/yr); 399 active listings in the ZIP; 21 comparable units currently listed for rent nearby; rentals at typical pace (median 22d on market — plan ~3-4 weeks tenant-placement turnaround); lower-income renter base — watch delinquency; 6,503 units permitted in Duval County in 2024 (1,131 in 5+ unit buildings).
- At $1,693/mo this rent would consume 67% of the median local household income ($31k/yr) (locally 2921% of renters already pay >50% of income on rent) — very limited rent-growth headroom before tenants either downsize or default.
Forward outlook
- Local home prices are declining (-3.0%/yr); year-one equity from $1k of loan paydown is wiped out by about $6k of value loss. Plan a longer hold.
- Duval County population projected at +19% by 2050 — long-run rental-demand tailwind backs the buy-and-hold thesis.
Negotiation context
- It's been on market 314 days — a 12% lower offer ($176k) is reasonable based on typical stale-listing flexibility.
- 2 sale attempts since 2y ago; this cycle's ask has dropped $20k (9%) from the opening price — seller is motivated, your offer sets the floor, not the list.
Risks & watch-outs
- Watch-outs: built in 1958 — expect roof / HVAC / electrical / plumbing capex.
- Climate carrying-cost: severe wind risk, 99% chance of damaging wind over 30y; extreme-heat days projected 7→20/yr by 2055 (HVAC capex compounding) — expect insurance premiums to compound above CPI over the hold.
Questions for the listing agent
- It's been on market 314 days. Have you received any prior offers? Is the seller open to a 15% concession, seller financing, or rate buy-down credit?
- Built in 1958 — when were the roof, HVAC, electrical panel, plumbing, and water heater last replaced?
- Why hasn't it sold? Are there any deal-killer items the seller is aware of (foundation, flood, title, zoning, code violations)?
- Is there a deadline driving the sale (1031 exchange, divorce, estate, relocation)? That informs how much negotiation room exists.
- Schools are B-rated — typically a magnet for longer-tenancy family renters. What's the average tenant stay here, and is there a school-zone premium baked into asking?
- The area grade is low — what's the realistic commute time and amenity access for the typical tenant pool here? Any planned neighborhood developments (good or bad) we should know about?
- What's the average days-on-market for RENTAL listings here right now (not sales)? A rising rental-DOM trend means longer vacancies and softer asking-rent achievability than the comps imply.
- What's the recent tenant-quality profile in this submarket — average credit score on applications, eviction rate, late-payment / NSF rate, and stable-employment percentage? A property-management company in the area should have these aggregated.
- How much new for-sale + rental construction is in the pipeline within 1–3 miles? Heavy new supply typically softens prices + rents 12–24 months out; constrained supply supports both.
Investment metrics
- 1% rule
- 0.85% ✗
- Cap rate
- 6.62%
- Cash-on-cash
- 1.17%
- DSCR
- 1.05
- GRM
- 9.8
CMA / ARV
- ARV (on-the-fly)
- $171,130
- Comps found
- 12
Show comp detail 12 sales within ~0.75 mi
| Address | Dist | Beds/Ba | Sqft | Sold | Price | $/sf | Match |
|---|---|---|---|---|---|---|---|
| 1731 W 28th St | 0.15mi | 4/2.0 (-1) | 1,522 (-3%) | 6mo | $220,000 | $145 | 78 |
| 1860 W 31st St | 0.17mi | 4/2.0 (-1) | 1,401 (-11%) | 3mo | $139,000 | $99 | 67 |
| 1648 W 22nd St | 0.34mi | 4/2.0 (-1) | 1,522 (-3%) | 9mo | $215,000 | $141 | 66 |
| 1419 W 24th St | 0.59mi | 4/2.0 (-1) | 1,572 (+0%) | 3mo | $53,200 | $34 | 65 |
| 1471 Mitchell St | 0.54mi | 4/2.0 (-1) | 1,492 (-5%) | 8mo | $115,000 | $77 | 55 |
| 1585 W 31st St | 0.37mi | 4/2.0 (-1) | 1,428 (-9%) | 10mo | $135,000 | $95 | 54 |
| 1918 Spring Drive Rd | 0.66mi | 4/2.0 (-1) | 1,427 (-9%) | 10mo | $150,000 | $105 | 41 |
| 5331 Spring Grove Ave | 0.67mi | 4/2.0 (-1) | 1,722 (+10%) | 11mo | $255,000 | $148 | 39 |
| 1342 Golfair Blvd | 0.71mi | 5/2.0 | 1,772 (+13%) | 8mo | $195,000 | $110 | 38 |
| 1337 W 22nd St W | 0.70mi | 4/2.0 (-1) | 1,357 (-14%) | 3mo | $198,000 | $146 | 37 |
| 5330 Cord Ave | 0.65mi | 4/2.0 (-1) | 1,372 (-13%) | 12mo | $149,900 | $109 | 34 |
| 1604 W 13th St | 0.74mi | 5/3.0 | 1,341 (-15%) | 8mo | $136,687 | $102 | 31 |
Match score weights: distance 35% · size 25% · config 20% · recency 20%. Top-matched comps best support the ARV.
Projected returns pro-forma
-3.0% appreciation · 1.81% rent growth · sell at horizon
- IRR
- -15.7%
- Equity multiple
- 0.45×
- Total profit
- $-30,933
- Equity at exit
- $29,798
- IRR
- -9.3%
- Equity multiple
- 0.45×
- Total profit
- $-30,611
- Equity at exit
- $17,279
Cash invested: $55,958 (down + closing). Projections, not guarantees.
Landlord ↔ Tenant lean methodology
- Overall (STATE)
- 87 Strongly Landlord-Friendly
- State Florida
- 87 Strongly Landlord-Friendly · R+3
- County
- — inherits STATE
- City
- — inherits STATE
ZIP-level market 32209
- Home prices YoY
- -22.1%
- Rents YoY
- 1.8%
- Active inventory
- 399
- Price-to-rent
- 9.8×
Monthly cashflow live
- Estimated rent
- $1,693 high interval (Pro) →
- Mortgage (P&I)
- −$1,048
- Tax from tax record
- −$151 /mo · $1,812/yr
- Insurance
- −$83
- HOA
- −$0
- Vacancy / Maint / Mgmt
- −$355
- Net cashflow
- $55
Break-even live
Sensitivity live
| Price | -10% $168 | -5% $111 | +0% $55 | +5% $-2 | +10% $-58 |
|---|---|---|---|---|---|
| Rent | -10% $-79 | -5% $-12 | +0% $55 | +5% $122 | +10% $188 |
| Rate | -1.0pp $155 | -0.5pp $106 | base $55 | +0.5pp $3 | +1.0pp $-50 |
UW: 25.0% down · 7.5% · 30yr · 1.5% tax · 5.0% vac · 8.0% maint · 8.0% mgmt
Financing live
Cash to close
- Down payment
- $49,962
- Closing costs
- $5,996
- Reserves months
- —
- Total cash needed
- —
Loan-product check · same deal, 3 products live
Conventional
25% down · 7.5% · 30yr
- Down + closing
- —
- Monthly P&I
- —
- Monthly cashflow
- —
- DSCR
- —
- Eligible?
- —
Personal DTI + credit; lowest rate.
DSCR
20% down · 8.5% · 30yr
- Down + closing
- —
- Monthly P&I
- —
- Monthly cashflow
- —
- DSCR
- —
- Eligible?
- —
No personal income docs; deal must DSCR.
Hard money
10% down · 12.0% · 12mo
- Down + closing
- —
- Monthly P&I
- —
- Monthly cashflow
- —
- DSCR
- —
- Eligible?
- —
Short-term bridge; refi at stabilization.
Rent comps 21 comps
| Address | Beds | Baths | Sqft | Rent | $/sqft | DOM | Units | Dist |
|---|---|---|---|---|---|---|---|---|
| 1490 W 33rd St Jacksonville, FL | 4.0 | 1.5 | 1150 | $1,150 | $1.00 | 25d | 1 | 0.53mi |
| 1511 W 15th St Jacksonville, FL | 5.0 | 3.0 | 1720 | $2,100 | $1.22 | 25d | 1 | 0.71mi |
| 1288 W 28th St Jacksonville, FL | 4.0 | 1.5 | 1449 | $1,267 | $0.87 | 16d | 1 | 0.74mi |
| 2415 N Canal St Jacksonville, FL | 4.0 | 2.0 | 1572 | $1,450 | $0.92 | 0d | 1 | 0.80mi |
| 1740 W 9th St Jacksonville, FL | 4.0 | 2.0 | 1148 | $1,285 | $1.12 | 22d | 1 | 0.89mi |
| 2069 Talladega Rd Jacksonville, FL | 4.0 | 2.0 | 1152 | $1,298 | $1.13 | 6d | 1 | 0.91mi |
| 1149 W 28th St Jacksonville, FL | 4.0 | 2.0 | 1344 | $1,302 | $0.97 | 25d | 1 | 0.93mi |
| 1029 W 25th St Unit 1 Jacksonville, FL | 5.0 | 2.0 | 1410 | $2,200 | $1.56 | 25d | 1 | 1.09mi |
| 1025 W 25th St Unit 1 Jacksonville, FL | 5.0 | 2.0 | 1500 | $2,000 | $1.33 | 25d | 1 | 1.10mi |
| 3126 Martha St Jacksonville, FL | 6.0 | 2.0 | 1350 | $2,550 | $1.89 | 16d | 1 | 1.11mi |
| 5568 Verbena Rd Jacksonville, FL | 4.0 | 2.5 | 1880 | $1,575 | $0.84 | 25d | 1 | 1.20mi |
| 5247 Cleveland Rd Jacksonville, FL | 4.0 | 2.0 | 1850 | $1,775 | $0.96 | 16d | 1 | 1.23mi |
| 1422 Stafford St Jacksonville, FL | 4.0 | 2.5 | 1368 | $1,900 | $1.39 | 0d | 1 | 1.24mi |
| 2313 Janette St Jacksonville, FL | 4.0 | 2.0 | 1148 | $1,349 | $1.18 | 18d | 1 | 1.27mi |
| 5816 Paris Ave Jacksonville, FL | 4.0 | 2.0 | 1701 | $1,599 | $0.94 | 25d | 1 | 1.27mi |
| 1640 W 4th St Unit 1 Jacksonville, FL | 4.0 | 2.0 | 1119 | $1,675 | $1.50 | 22d | 1 | 1.32mi |
| 1995 W 4th St Jacksonville, FL | 4.0 | 1.5 | 1213 | $1,375 | $1.13 | 25d | 1 | 1.34mi |
| 1781 W 3rd St Jacksonville, FL | 4.0 | 2.0 | 1632 | $650 | $0.40 | 25d | 1 | 1.34mi |
| 5805 Christobel Ave Jacksonville, FL | 4.0 | 2.0 | 1986 | $1,800 | $0.91 | 9d | 1 | 1.38mi |
| 1355 Grothe St Jacksonville, FL | 4.0 | 1.0 | 1312 | $1,350 | $1.03 | 19d | 1 | 1.40mi |
| 2727 W 45th St Jacksonville, FL | 4.0 | 2.5 | 2104 | $1,550 | $0.74 | 16d | 1 | 1.43mi |
Listing history 18 events
-
2026-06-21days on market $199,850 Active 314 DOM
-
2026-06-18days on market $199,850 Active 311 DOM
-
2026-06-17days on market $199,850 Active 310 DOM
-
2026-06-16days on market $199,850 Active 309 DOM
-
2026-06-15days on market $199,850 Active 308 DOM
-
2026-06-10days on market $199,850 Active 302 DOM
-
2026-06-08days on market $199,850 Active 301 DOM
-
2026-06-08days on market $199,850 Active 300 DOM
-
2026-06-03days on market $199,850 Active 296 DOM
-
2026-06-02days on market $199,850 Active 295 DOM
-
2026-06-01days on market $199,850 Active 294 DOM
-
2026-05-31days on market $199,850 Active 293 DOM
-
2025-09-18price $199,850
-
2025-08-11$220,000 Active
-
2024-12-14historical 171-char remark
Show marketing remark (171 chars)
The house has been remodeled from top to bottom. Brand new roof, brand new floor joist, brand new flooring, brand new central air and heat, paint, plumbing and electrical.
-
2024-08-25price $210,001 171-char remark
Show marketing remark (171 chars)
The house has been remodeled from top to bottom. Brand new roof, brand new floor joist, brand new flooring, brand new central air and heat, paint, plumbing and electrical.
-
2024-07-14price $225,001 171-char remark
Show marketing remark (171 chars)
The house has been remodeled from top to bottom. Brand new roof, brand new floor joist, brand new flooring, brand new central air and heat, paint, plumbing and electrical.
-
2024-05-01$250,001 Active 171-char remark
Show marketing remark (171 chars)
The house has been remodeled from top to bottom. Brand new roof, brand new floor joist, brand new flooring, brand new central air and heat, paint, plumbing and electrical.
ⓘ Source: listings_history table (triggers on properties + properties_extension) + one-shot
backfill from property_details.listing_events for pre-trigger history.
Tax reassessment forecast FL · Resets to sale price
- Current annual tax
- $1,812 · $151/mo
- Projected year-2 tax
- $1,812 · $151/mo
- Expected delta
- $0/yr ($0/mo · -0.0%)
ⓘ Screening estimate from a state-policy table — verify with the county assessor before closing.
Climate risk First Street
- Flood 1/10 Low FEMA zone X (unshaded) · 0% chance over 30 yrs
- Wildfire 1/10 Low
- Heat 9/10 Extreme 7 d/yr ≥107°F today · 20 d/yr by 30 yrs out
- Wind 9/10 Extreme 99% chance of damaging wind over 30 yrs
- Air quality 4/10 Moderate 6 unhealthy d/yr today · 6 by 30 yrs out
Nearby sold comps map
Loading sold comps map…
Walkable amenities ~0.75 mi
Loading nearby amenities…
Taxation est. · year 1
- Rental income
- $20,310
- − Mortgage interest
- −$11,195
- − Property taxes
- −$1,812
- − Insurance
- −$999
- − Repairs & maintenance
- −$1,625
- − Management
- −$1,625
- − Depreciation
- −$5,814
- Taxable loss
- −$2,759
- Est. tax savings @ 24.0%
- +$662
- After-tax cash flow
- $1,320/yr
For passive investors: Depreciation is non-cash, so a rental often shows a tax loss while cash-flowing — sheltering income. Rental losses are passive: they offset passive income freely, and up to $25,000/yr can offset ordinary (W-2) income if you actively participate and your MAGI is under $100k (phasing out to $0 by $150k); unused losses carry forward. On sale, claimed depreciation is recaptured at up to 25%, and gains may owe capital-gains tax (a 1031 exchange can defer both). Figures are a year-1 estimate at your 24.0% rate — not tax advice; consult a CPA.
Schools (NCES district)
- District
- Duval
- NCES district ID
- 1200480
- Math proficiency
- 46% ▼ -11.00%
- Reading proficiency
- 45% ▼ -4.00%
- Median HH income
- $48,987
- Composite
- 38.97/100
- National rank
- #4076
- State rank
- #48 of 73 in FL
Livability — Jacksonville
- Score
- 83/100
- State rank
- #50
- US rank
- #911
Category grades
Schools grade is shown separately in the Schools card above.
Census & demographics
- Census place
- Jacksonville, FL
- County
- Duval County · 1,015,274 people
- City population
- 979,034
- Metro
- Jacksonville, FL
- Population (ZIP)
- 34,657
- Household income
- $30,514
- Rent vs Own
- Severe rent burden
- 2921.0
Population outlook (Duval County) Hauer SSP2
- Today (2025)
- 1,013,010 people
- By 2030
- 1,059,228 · +4.6%
- By 2040
- 1,141,439 · +12.7%
- By 2050
- 1,205,258 · +19.0%
- By 2075
- 1,324,282 · +30.7%
- By 2100
- 1,319,620 · +30.3%
Race, ethnicity, and origin ACS 2023
- Neighborhood character
- Predominantly Black (88%)
- Race & ethnicity
- Black 88% White 5% Hispanic / Latino 5% Two or more races 2%
- Hispanic origin (detail)
- Puerto Rican 3%
- Common ancestry
- Hispanic 1% Romanian 1%
- Foreign-born
- 3% · Canada
- Languages at home
- 95% English-only · Spanish 4% French/Haitian/Cajun 1%
Political lean MEDSL · Duval
- 2024 margin
- Toss-up / Even · D 48.7% · R 50.1% · Other 1.2%
- 2008→2024 swing
- +0.4pp no change · 2008: -1.9pp · 2024: -1.5pp
- All cycles
- 2024: R+1.5 2020: D+3.8 2016: R+1.5 2012: R+3.6 2008: R+1.9
Not yet ingested
- Civics
- —
Market trends
- HPI YoY
- ▼ -53.92%
- Current HPI
- 189.5977
- Rent YoY
- ▲ 1.81%
- Metro
- Jacksonville, FL
- State GDP YoY
- ▲ 3.28%
- F500 in state
- 36
Industry mix (Fortune 500 HQ in FL)
| Industry | F500 HQs | Revenue |
|---|---|---|
| Industrial Technology | 2 | $29B |
|
||
| Insurance | 2 | $17B |
|
||
| Retail | 1 | $60B |
|
||
| Technology Distribution | 1 | $58B |
|
||
| Homebuilding | 1 | $35B |
|
||
| Technology Manufacturing | 1 | $35B |
|
||
Price history
-20.1% since first listed6 events — show timeline
- 2025-09-18 Price Changed $199,850 realMLS
- 2025-08-11 Listed $220,000 realMLS
- 2024-12-14 Listing Removed — realMLS
- 2024-08-25 Price Changed $210,001 realMLS
- 2024-07-14 Price Changed $225,001 realMLS
- 2024-05-01 Listed $250,001 realMLS
Property tax history
+17.8%/yrLatest (2025): $1,812 · +19.0% YoY. Source: county tax records.
Cash-flow waterfall
monthlySold comps — $/sqft
last 12 mo · ≤1 miLoading sold comps…