 Multi-family
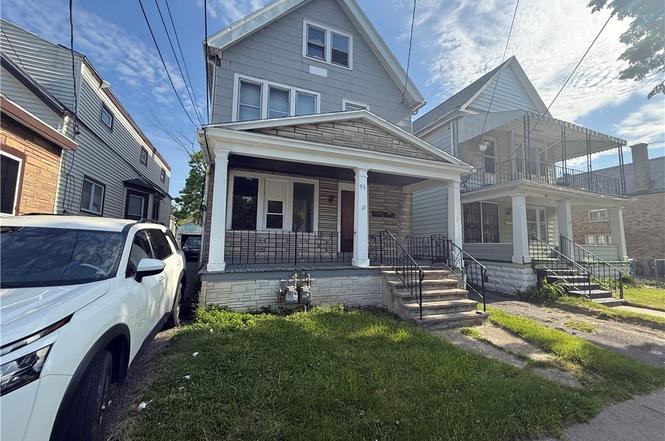
96 Dorris Ave · Buffalo, NY
Flood risk 1/10 · Minimal
- FEMA flood zone
- X (unshaded)
- Chance of flooding over 30 yrs
- 0.0%
- Est. flood insurance / yr
- $473 – $860
Fire risk 1/10 · Minimal
- Est. fire insurance / yr
- $691 – $1,283
Heat risk 3/10 · Minor
- Hot days now (above 93°F)
- 7 days/yr
- Hot days in 30 yrs
- 15 days/yr
Wind risk 1/10 · Minimal
- Chance of severe wind over 30 yrs
- —
Air-quality risk 3/10 · Minor
- Unhealthy air days now
- 2 days/yr
- Unhealthy air days in 30 yrs
- 3 days/yr
Risk factors via First Street. Map © Google.
Why this score? — see what drove the B grade
The composite is a weighted blend of 9 inputs, each scored 0–100. Each bar is that input's sub-score; the figure is the points it added to the 100-point composite (weight × sub-score).
- Cash flow +30.0/30.0
- ARV discount +11.9/15.0
- 1% rule +10.0/10.0
- DSCR +10.0/10.0
- Livability +3.9/5.0
- Schools +3.3/10.0
- Rent growth +2.7/5.0
- Condition / age +2.5/5.0
- Appreciation +0.0/10.0
$149,000
🖨 Deal sheet (PDF) 📄 Offer letter ✓ Due diligence
Multi-family units
County records classify this as Multi-Family (2-4 Unit). Listing-text estimate: 1 unit. estimate disagrees with records
Listing remarks
Welcome to 96 Dorris Ave, Buffalo, NY! This 3/3 double presents an excellent opportunity for both investors and owner-occupants looking to build equity. The property features spacious units, solid mechanics, a full basement, and a full attic, offering ample storage and added potential. Enjoy a backyard and the convenience of off-street parking. Ideally located near public transportation, shopping, restaurants, and other local amenities. While the property does require some updates and TLC, with the right vision and improvements, this multi-family property can be transformed into a great investment opportunity. Don’t miss your chance to bring this property’s full potential to lif
Key facts
- Backyard
- Full basement
- Local amenities
Tags
Property features AI
Finance
- Financial info: Owner pays water; water expense included in operating/rent considerations; Operating expenses include water/sewer
Exterior
- Parking: Detached or on-site garage with 2 garage spaces; Additional two or more parking spaces
- Utilities: Electricity connected (circuit breakers); Public water connected; Sewer connected; Cable available; High-speed internet available
- Home design: Two-story building; Resale property; Asphalt roof; Vinyl siding
- Construction: Existing construction; Vinyl siding; Asphalt roof
- Exterior features: Near public transit; Rectangular residential lot with 30 x 120 dimensions; City street frontage
Interior
- Kitchen: Gas water heater
- Bedrooms: Two 3-bedroom units (each unit lists 3 bedrooms)
- Flooring: Hardwood; Varies by area
- Bathrooms: Each unit has 1 full bathroom (2 full bathrooms total)
- Heating & cooling: Gas forced-air heating
- Interior features: Hardwood and varied flooring; Full basement
- Laundry & utility: Common area laundry
Neighborhood map
What this means for you Summary
Snapshot
- This is a 6-bed/2.0-bath multifamily listed at $149k.
Deal economics
- At list price, monthly cash flow is $1k ($14k/yr) — positive.
- The deal already cash-flows at list — no discount required.
- Meets the 1% rule at list price ($3k rent vs $149k).
- Cap rate 16.0% vs local median 8.0% in Buffalo — top-decile yield for the area; either an underpriced asset or a hidden risk that comps aren't pricing in. Stress-test before assuming the spread holds.
Location & tenants
- Location reads 77/100 on livability (#195 in NY, #3,011 nationally) — a middle-class / working-renter tenant base. Strengths: commute A+, housing A+, health & safety A+; Watch: crime F, employment D-.
- Buffalo City School District (urban): math 41% / reading 40% proficiency, ranked #535 of 590 in NY (top 91%) — families likely to look elsewhere, expect single-tenant / working-renter base with shorter leases; 75% free/reduced lunch — lower-income household profile, screen leases tightly.
- Zoned schools: International School (math 8% / reading 17%, grade F, #2,048 of 2,108 statewide, top 97%, 981 students, 92% FRL); Hutchinson Central Technical High School (math 96% / reading 32%, grade B-, #807 of 1,100 statewide, top 73%, 1,175 students, 78% FRL).
- Market conditions: Rents flat; 239 active listings in the ZIP; 1 comparable units currently listed for rent nearby; lower-income renter base — watch delinquency; 1,244 units permitted in Erie County in 2024 (563 in 5+ unit buildings).
- At $2,643/mo this rent would consume 71% of the median local household income ($45k/yr) (locally 2873% of renters already pay >50% of income on rent) — very limited rent-growth headroom before tenants either downsize or default.
Forward outlook
- Local home prices are declining (-3.0%/yr); year-one equity from $1k of loan paydown is wiped out by about $4k of value loss. Plan a longer hold.
- At projected returns (-3.0% appreciation + 0.7% rent growth), your $42k cash investment doubles in ~4 years — after that, you're playing with house money.
Negotiation context
- Only 6 days on market — expect competitive offers; lowballing is unlikely to land.
- Current owner paid $35k; list at $149k implies a 326% gain — meaningful room to come down on a strong offer.
Risks & watch-outs
- Watch-outs: built in 1928 — expect roof / HVAC / electrical / plumbing capex.
Questions for the listing agent
- Built in 1928 — when were the roof, HVAC, electrical panel, plumbing, and water heater last replaced?
- Is there a deadline driving the sale (1031 exchange, divorce, estate, relocation)? That informs how much negotiation room exists.
- Crime grade is F in this area — have there been break-ins, vandalism, or insurance claims at this property in the last 3 years? What carrier currently insures it and at what premium?
- What's the average days-on-market for RENTAL listings here right now (not sales)? A rising rental-DOM trend means longer vacancies and softer asking-rent achievability than the comps imply.
- What's the recent tenant-quality profile in this submarket — average credit score on applications, eviction rate, late-payment / NSF rate, and stable-employment percentage? A property-management company in the area should have these aggregated.
- How much new apartment / multifamily construction is in the pipeline within 1–3 miles? Heavy new supply (>2% of stock underway) typically softens rents 12–24 months out; light construction supports rent growth.
Investment metrics
- 1% rule
- 1.77% ✓
- Cap rate
- 15.95%
- Cash-on-cash
- 34.49%
- DSCR
- 2.53
- GRM
- 4.7
CMA / ARV
- ARV (on-the-fly)
- $165,000
- Comps found
- 12
Show comp detail 12 sales within ~0.75 mi
| Address | Dist | Beds/Ba | Sqft | Sold | Price | $/sf | Match |
|---|---|---|---|---|---|---|---|
| 66 Kermit Ave | 0.18mi | 6/2.0 | 2,142 (-3%) | 7mo | $75,000 | $35 | 81 |
| 440 Cornwall Ave | 0.38mi | 6/2.0 | 2,200 (0%) | 7mo | $131,000 | $60 | 77 |
| 94 Ericson Ave | 0.37mi | 6/2.0 | 1,974 (-10%) | 2mo | $85,000 | $43 | 64 |
| 96 Sussex St | 0.55mi | 5/2.0 (-1) | 2,152 (-2%) | 4mo | $255,000 | $118 | 63 |
| 358 Newburgh Ave | 0.34mi | 5/2.0 (-1) | 1,959 (-11%) | 2mo | $165,000 | $84 | 59 |
| 815 E Delavan Ave | 0.68mi | 6/2.0 | 2,096 (-5%) | 4mo | $160,000 | $76 | 57 |
| 266 Cambridge Ave | 0.52mi | 6/2.0 | 2,000 (-9%) | 7mo | $75,000 | $38 | 55 |
| 246 Cambridge Ave | 0.54mi | 6/2.0 | 2,000 (-9%) | 6mo | $117,000 | $59 | 55 |
| 183 Freund St | 0.71mi | 6/2.0 | 2,332 (+6%) | 7mo | $140,000 | $60 | 51 |
| 14 Phyllis Ave | 0.66mi | 6/2.0 | 1,987 (-10%) | 4mo | $227,500 | $114 | 49 |
| 199 Schuele Ave | 0.74mi | 6/2.0 | 2,392 (+9%) | 3mo | $178,500 | $75 | 48 |
| 1402 E Delavan Ave Unit N | 0.55mi | 6/2.0 | 2,523 (+15%) | 6mo | $225,000 | $89 | 45 |
Match score weights: distance 35% · size 25% · config 20% · recency 20%. Top-matched comps best support the ARV.
Projected returns pro-forma
-3.0% appreciation · 0.67% rent growth · sell at horizon
- IRR
- 27.4%
- Equity multiple
- 2.11×
- Total profit
- $46,125
- Equity at exit
- $22,216
- IRR
- 33.6%
- Equity multiple
- 3.75×
- Total profit
- $114,602
- Equity at exit
- $12,883
Cash invested: $41,720 (down + closing). Projections, not guarantees.
Landlord ↔ Tenant lean methodology
- Overall (STATE)
- 15 Strongly Tenant-Friendly
- State New York
- 15 Strongly Tenant-Friendly · D+10
- County
- — inherits STATE
- City
- — inherits STATE
ZIP-level market 14215
- Home prices YoY
- -30.0%
- Rents YoY
- 0.7%
- Active inventory
- 239
- Price-to-rent
- 9.4×
Monthly cashflow live
- Estimated rent
- $2,643 high interval (Pro) →
- Mortgage (P&I)
- −$781
- Tax from tax record
- −$45 /mo · $545/yr
- Insurance
- −$62
- HOA
- −$0
- Vacancy / Maint / Mgmt
- −$555
- Net cashflow
- $1,199
Break-even live
Sensitivity live
| Price | -10% $1,283 | -5% $1,241 | +0% $1,199 | +5% $1,157 | +10% $1,115 |
|---|---|---|---|---|---|
| Rent | -10% $990 | -5% $1,095 | +0% $1,199 | +5% $1,304 | +10% $1,408 |
| Rate | -1.0pp $1,274 | -0.5pp $1,237 | base $1,199 | +0.5pp $1,160 | +1.0pp $1,121 |
2-unit breakdown (identical units grouped — click to expand)
| Units | Beds | Baths | Est. rent |
|---|---|---|---|
| 2× units | 3 | 1.5 | $2,642 |
| #1 | 3 | 1.5 | $1,321 |
| #2 | 3 | 1.5 | $1,321 |
| Total (2 units) | $2,643 | ||
UW: 25.0% down · 7.5% · 30yr · 1.5% tax · 5.0% vac · 8.0% maint · 8.0% mgmt
Financing live
Cash to close
- Down payment
- $37,250
- Closing costs
- $4,470
- Reserves months
- —
- Total cash needed
- —
Loan-product check · same deal, 3 products live
Conventional
25% down · 7.5% · 30yr
- Down + closing
- —
- Monthly P&I
- —
- Monthly cashflow
- —
- DSCR
- —
- Eligible?
- —
Personal DTI + credit; lowest rate.
DSCR
20% down · 8.5% · 30yr
- Down + closing
- —
- Monthly P&I
- —
- Monthly cashflow
- —
- DSCR
- —
- Eligible?
- —
No personal income docs; deal must DSCR.
Hard money
10% down · 12.0% · 12mo
- Down + closing
- —
- Monthly P&I
- —
- Monthly cashflow
- —
- DSCR
- —
- Eligible?
- —
Short-term bridge; refi at stabilization.
Rent comps 1 comps
| Address | Beds | Baths | Sqft | Rent | $/sqft | DOM | Units | Dist |
|---|---|---|---|---|---|---|---|---|
| 145 Minnesota Ave Buffalo, NY | 7.0 | 2.0 | 2551 | $4,900 | $1.92 | 16d | 1 | 1.49mi |
Listing history 5 events
-
2026-06-21days on market $149,000 Active 6 DOM
-
2026-06-18days on market $149,000 Active 3 DOM
-
2026-06-17days on market $149,000 Active 2 DOM
-
2026-06-15remarks 687-char remark
-
2026-06-15$149,000 Active 1 DOM
ⓘ Source: listings_history table (triggers on properties + properties_extension) + one-shot
backfill from property_details.listing_events for pre-trigger history.
Tax reassessment forecast NY · Partial reset (capped growth)
- Current annual tax
- $545 · $45/mo
- Projected year-2 tax
- $1,531 · $128/mo
- Expected delta
- +$987/yr (+$82/mo · 181.1%)
ⓘ Screening estimate from a state-policy table — verify with the county assessor before closing.
Climate risk First Street
- Flood 1/10 Low FEMA zone X (unshaded) · 0% chance over 30 yrs
- Wildfire 1/10 Low
- Heat 3/10 Moderate 7 d/yr ≥93°F today · 15 d/yr by 30 yrs out
- Wind 1/10 Low
- Air quality 3/10 Moderate 2 unhealthy d/yr today · 3 by 30 yrs out
Nearby sold comps map
Loading sold comps map…
Walkable amenities ~0.75 mi
Loading nearby amenities…
Taxation est. · year 1
- Rental income
- $31,716
- − Mortgage interest
- −$8,346
- − Property taxes
- −$545
- − Insurance
- −$745
- − Repairs & maintenance
- −$2,537
- − Management
- −$2,537
- − Depreciation
- −$4,335
- Taxable income
- $12,671
- Est. tax owed @ 24.0%
- −$3,041
- After-tax cash flow
- $11,348/yr
For passive investors: Depreciation is non-cash, so a rental often shows a tax loss while cash-flowing — sheltering income. Rental losses are passive: they offset passive income freely, and up to $25,000/yr can offset ordinary (W-2) income if you actively participate and your MAGI is under $100k (phasing out to $0 by $150k); unused losses carry forward. On sale, claimed depreciation is recaptured at up to 25%, and gains may owe capital-gains tax (a 1031 exchange can defer both). Figures are a year-1 estimate at your 24.0% rate — not tax advice; consult a CPA.
Schools (NCES district)
- District
- Buffalo City School District
- NCES district ID
- 3605850
- Math proficiency
- 41% ▲ 11.00%
- Reading proficiency
- 40% ▲ 7.00%
- Median HH income
- $31,665
- Composite
- 33.17/100
- National rank
- #5544
- State rank
- #535 of 590 in NY
Livability — Buffalo
- Score
- 77/100
- State rank
- #195
- US rank
- #3011
Category grades
Schools grade is shown separately in the Schools card above.
Census & demographics
- Census place
- Buffalo, NY
- County
- Erie County · 714,559 people
- City population
- 440,021
- Metro
- Buffalo-Cheektowaga, NY
- Population (ZIP)
- 42,524
- Household income
- $44,955
- Rent vs Own
- Severe rent burden
- 2873.0
Population outlook (Erie County) Hauer SSP2
- Today (2025)
- 933,037 people
- By 2030
- 935,181 · +0.2%
- By 2040
- 928,531 · -0.5%
- By 2050
- 905,725 · -2.9%
- By 2075
- 834,037 · -10.6%
- By 2100
- 708,033 · -24.1%
Race, ethnicity, and origin ACS 2023
- Neighborhood character
- Predominantly Black (67%)
- Race & ethnicity
- Black 67% White 15% Asian 7% Hispanic / Latino 6% Two or more races 6%
- Hispanic origin (detail)
- Puerto Rican 4%
- Common ancestry
- Romanian 4% Lithuanian 1% Italian 1%
- Foreign-born
- 9% · Canada, China
- Languages at home
- 88% English-only · Other Indo-European 4% Spanish 4% Chinese 1%
Political lean MEDSL · Erie
- 2024 margin
- Lean D (+9.7) · D 54.8% · R 45.2%
- 2008→2024 swing
- -7.9pp toward R · 2008: 17.5pp · 2024: 9.7pp
- All cycles
- 2024: D+9.7 2020: D+14.7 2016: D+4.8 2012: D+15.6 2008: D+17.5
Not yet ingested
- Civics
- —
Market trends
- HPI YoY
- ▼ -126.29%
- Current HPI
- 295.2966
- Rent YoY
- ▲ 0.67%
- Metro
- Buffalo-Cheektowaga, NY
- State GDP YoY
- ▲ 2.60%
- F500 in state
- 92
Industry mix (Fortune 500 HQ in NY)
| Industry | F500 HQs | Revenue |
|---|---|---|
| Financial Services | 10 | $950B |
|
||
| Consumer Goods | 9 | $162B |
|
||
| Insurance | 4 | $225B |
|
||
| Telecommunications | 2 | $144B |
|
||
| Pharmaceuticals | 2 | $112B |
|
||
| Media / Entertainment | 2 | $69B |
|
||
Price history
+727.8% since first listed5 events — show timeline
- 2026-06-15 Listed $149,000 WNYREIS
- 2020-02-11 Sold (Public Records) $35,000 Public Records
- 2004-12-29 Sold (Public Records) $50,000 Public Records
- 2004-12-29 Sold (Public Records) $22,000 Public Records
- 1999-06-22 Sold (Public Records) $18,000 Public Records
Property tax history
+8.8%/yrLatest (2025): $545 · +111.3% YoY. Source: county tax records.
Cash-flow waterfall
monthlySold comps — $/sqft
last 12 mo · ≤1 miLoading sold comps…