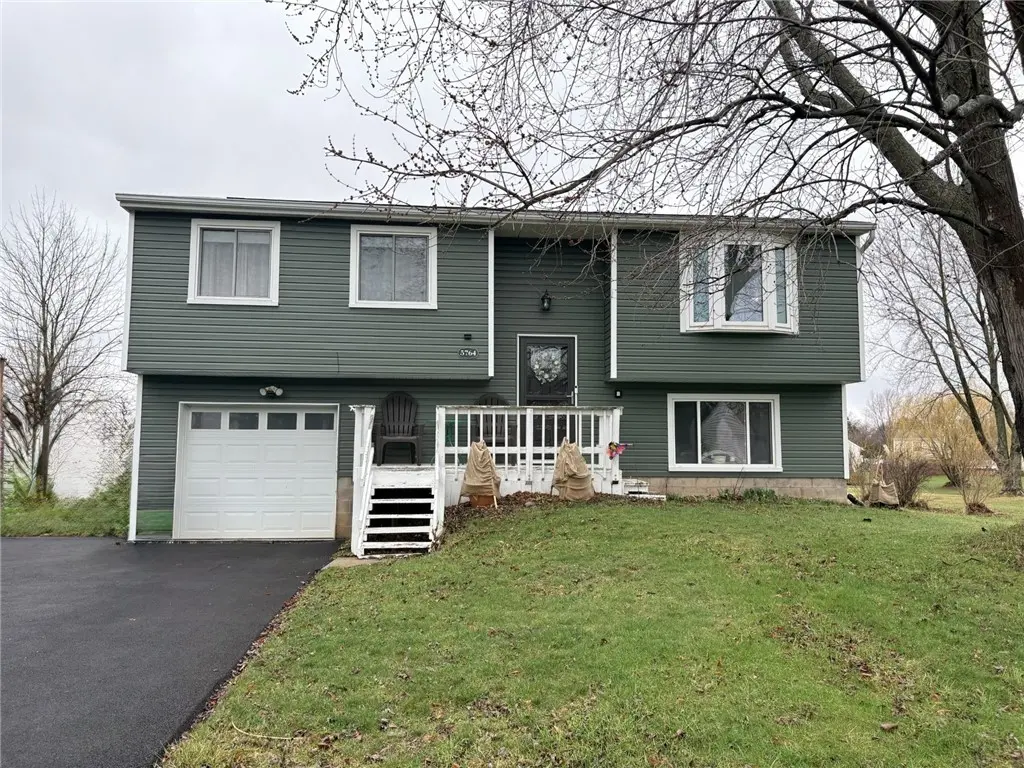
5764 Clover Meadow Ln · Canandaigua, NY
Flood risk 1/10 · Minimal
- FEMA flood zone
- X
- Chance of flooding over 30 yrs
- 0.0%
- Est. flood insurance / yr
- $473 – $860
Fire risk 2/10 · Minimal
- Est. fire insurance / yr
- $691 – $1,283
Heat risk 2/10 · Minimal
- Hot days now (above 95°F)
- 7 days/yr
- Hot days in 30 yrs
- 16 days/yr
Wind risk 1/10 · Minimal
- Chance of severe wind over 30 yrs
- —
Air-quality risk 2/10 · Minimal
- Unhealthy air days now
- 1 days/yr
- Unhealthy air days in 30 yrs
- 1 days/yr
Risk factors via First Street. Map © Google.
Why this score? — see what drove the B- grade
The composite is a weighted blend of 9 inputs, each scored 0–100. Each bar is that input's sub-score; the figure is the points it added to the 100-point composite (weight × sub-score).
- Cash flow +22.8/30.0
- ARV discount +15.0/15.0
- DSCR +7.3/10.0
- 1% rule +6.5/10.0
- Schools +4.7/10.0
- Livability +3.8/5.0
- Rent growth +2.5/5.0
- Condition / age +2.5/5.0
- Appreciation +0.0/10.0
$237,900
🖨 Deal sheet 📄 Offer letter ✓ Due diligence
Listing remarks
Welcome to this beautifully updated split-entry home nestled in a desirable neighborhood! This 3-bedroom, 1.5-bath home offers a bright and inviting layout, starting with a welcoming foyer that leads to a remodeled kitchen with dining area. The spacious living room features a charming bay window and newer carpeting that continues through the hall and stairs, while the kitchen showcases hardwood flooring. The finished lower level provides a cozy family room, along with a convenient laundry area and half bath. Enjoy the added benefit of an attached one-car garage complete with metal storage racks. Step outside to a nicely landscaped yard and relax on the back deck overlooking a level backyard
Key facts
- Hardwood flooring
- Laundry area
- Remodeled kitchen
Tags
Neighborhood map
What this means for you Summary
Snapshot
- This is a 3-bed/1.5-bath single-family listed at $238k.
Deal economics
- At list price, monthly cash flow is $413 ($5k/yr) — positive.
- The deal already cash-flows at list — no discount required.
- Meets the 1% rule at list price ($3k rent vs $238k).
- Recommended offer: $234k (1.5% below list) — sets the bar for market timing.
- Cap rate 8.4% vs local median 3.4% in Canandaigua — top-decile yield for the area; either an underpriced asset or a hidden risk that comps aren't pricing in. Stress-test before assuming the spread holds.
Location & tenants
- Location reads 75/100 on livability (#243 in NY, #3,822 nationally) — a middle-class / working-renter tenant base. Strengths: commute A+, housing A+, schools B+; Watch: employment C-, amenities F, health & safety D-.
- Canandaigua City School District (suburban): math 50% / reading 59% proficiency, ranked #305 of 590 in NY (top 52%) — acceptable for families but not a draw, mixed tenant base, ~2y average lease.
- Market conditions: 72 active listings in the ZIP; 3 comparable units currently listed for rent nearby; rentals leasing fast (median 3d on market — plan ~1-2 weeks tenant-placement turnaround); solid renter incomes; 284 units permitted in Ontario County in 2024 (69 in 5+ unit buildings).
- This rent runs 35% of the median local income ($95k/yr) — at the standard rent-burdened threshold; future hikes will face affordability resistance.
Forward outlook
- Local home prices are declining (-3.0%/yr); year-one equity from $2k of loan paydown is wiped out by about $7k of value loss. Plan a longer hold.
- Ontario County population projected to shrink 6% by 2050 — rents likely to lag national; underwrite the cash flow, not the appreciation.
Negotiation context
- It's been on market 27 days — a 2% lower offer ($234k) is reasonable based on typical stale-listing flexibility.
- Current owner paid $70k; list at $238k implies a 240% gain — meaningful room to come down on a strong offer.
Questions for the listing agent
- What does the HOA fee cover, when was the last increase, and are there any pending special assessments or reserve-fund shortfalls?
- Is there a deadline driving the sale (1031 exchange, divorce, estate, relocation)? That informs how much negotiation room exists.
- Schools are B-rated — typically a magnet for longer-tenancy family renters. What's the average tenant stay here, and is there a school-zone premium baked into asking?
- What's the average days-on-market for RENTAL listings here right now (not sales)? A rising rental-DOM trend means longer vacancies and softer asking-rent achievability than the comps imply.
- What's the recent tenant-quality profile in this submarket — average credit score on applications, eviction rate, late-payment / NSF rate, and stable-employment percentage? A property-management company in the area should have these aggregated.
- How much new for-sale + rental construction is in the pipeline within 1–3 miles? Heavy new supply typically softens prices + rents 12–24 months out; constrained supply supports both.
Investment metrics
- 1% rule
- 1.15% ✓
- Cap rate
- 8.38%
- Cash-on-cash
- 7.44%
- DSCR
- 1.33
- GRM
- 7.3
CMA / ARV
- ARV (on-the-fly)
- $289,196
- Comps found
- 12
Show comp detail 12 sales within ~0.75 mi
| Address | Dist | Beds/Ba | Sqft | Sold | Price | $/sf | Match |
|---|---|---|---|---|---|---|---|
| 1564 Hayride Dr | 0.10mi | 3/1.5 | 1,440 (-2%) | 9mo | $300,000 | $208 | 85 |
| 1601 Flaxen Dr | 0.16mi | 4/1.5 (+1) | 1,468 (0%) | 6mo | $255,000 | $174 | 82 |
| 1568 Hayride Dr | 0.12mi | 3/1.5 | 1,430 (-3%) | 12mo | $300,000 | $210 | 80 |
| 1169 Meadowbrook Ln | 0.13mi | 3/1.0 | 1,520 (+4%) | 10mo | $260,000 | $171 | 78 |
| 5778 Oatfield Dr | 0.24mi | 3/1.5 | 1,424 (-3%) | 12mo | $330,000 | $232 | 74 |
| 15 Coachlight Cir | 0.24mi | 3/2.0 | 1,450 (-1%) | 13mo | $285,000 | $197 | 74 |
| 5773 Clover Meadow Ln | 0.05mi | 3/2.0 | 1,344 (-8%) | 10mo | $235,000 | $175 | 73 |
| 5768 Oatfield Dr | 0.25mi | 3/1.5 | 1,376 (-6%) | 9mo | $300,000 | $218 | 70 |
| 1547 Meadowbrook Ln | 0.19mi | 3/2.5 | 1,380 (-6%) | 11mo | $290,000 | $210 | 68 |
| 5715 Dalton Dr | 0.29mi | 4/2.0 (+1) | 1,416 (-4%) | 8mo | $240,000 | $169 | 67 |
| 45 Coachlight Cir | 0.26mi | 4/1.5 (+1) | 1,560 (+6%) | 9mo | $290,000 | $186 | 65 |
| 5738 Dalton Dr | 0.36mi | 3/1.5 | 1,564 (+6%) | 10mo | $239,900 | $153 | 64 |
Match score weights: distance 35% · size 25% · config 20% · recency 20%. Top-matched comps best support the ARV.
Projected returns pro-forma
-3.0% appreciation · 3.0% rent growth · sell at horizon
- IRR
- -4.9%
- Equity multiple
- 0.82×
- Total profit
- $-12,152
- Equity at exit
- $35,472
- IRR
- 4.8%
- Equity multiple
- 1.36×
- Total profit
- $23,694
- Equity at exit
- $20,569
Cash invested: $66,612 (down + closing). Projections, not guarantees.
Landlord ↔ Tenant lean methodology
- Overall (STATE)
- 15 Strongly Tenant-Friendly
- State New York
- 15 Strongly Tenant-Friendly · D+10
- County
- — inherits STATE
- City
- — inherits STATE
ZIP-level market 14425
- Home prices YoY
- -15.1%
- Active inventory
- 72
- Price-to-rent
- 7.3×
Monthly cashflow live
- Estimated rent
- $2,730 medium interval (Pro) →
- Mortgage (P&I)
- −$1,248
- Tax from tax record
- −$359 /mo · $4,309/yr
- Insurance
- −$99
- HOA
- −$38
- Vacancy / Maint / Mgmt
- −$573
- Net cashflow
- $413
Break-even live
UW: 25.0% down · 7.5% · 30yr · 1.5% tax · 5.0% vac · 8.0% maint · 8.0% mgmt
Financing live
Cash to close
- Down payment
- $59,475
- Closing costs
- $7,137
- Reserves months
- —
- Total cash needed
- —
Loan-product check · same deal, 3 products live
Conventional
25% down · 7.5% · 30yr
- Down + closing
- —
- Monthly P&I
- —
- Monthly cashflow
- —
- DSCR
- —
- Eligible?
- —
Personal DTI + credit; lowest rate.
DSCR
20% down · 8.5% · 30yr
- Down + closing
- —
- Monthly P&I
- —
- Monthly cashflow
- —
- DSCR
- —
- Eligible?
- —
No personal income docs; deal must DSCR.
Hard money
10% down · 12.0% · 12mo
- Down + closing
- —
- Monthly P&I
- —
- Monthly cashflow
- —
- DSCR
- —
- Eligible?
- —
Short-term bridge; refi at stabilization.
Rent comps 3 comps
| Address | Beds | Baths | Sqft | Rent | $/sqft | DOM | Units | Dist |
|---|---|---|---|---|---|---|---|---|
| 1515 Red Fern Dr Unit 1512 Farmington, NY | 3.0 | 2.5 | 1688 | $2,800 | $1.66 | 3d | 1 | 0.33mi |
| 1512 Redfern Dr Farmington, NY | 3.0 | 2.5 | 1688 | $2,800 | $1.66 | 3d | 1 | 0.35mi |
| 1188 Barry Pl Farmington, NY | 1.0–3.0 | 1.0–2.5 | 1072 | $2,675 | $2.50 | 3d | 12 | 1.01mi |
HOA detail
- Monthly dues
- $38 · $456/yr
Listing history 17 events
-
2026-06-18days on market $237,900 Active 27 DOM
-
2026-06-17days on market $237,900 Active 26 DOM
-
2026-06-16days on market $237,900 Active 25 DOM
-
2026-06-15days on market $237,900 Active 24 DOM
-
2026-06-13days on market $237,900 Active 22 DOM
-
2026-06-13days on market $237,900 Active 21 DOM
-
2026-06-10pricedays on market $237,900 Active 19 DOM
-
2026-06-09days on market $239,900 Active 18 DOM
-
2026-06-09days on market $239,900 Active 17 DOM
-
2026-06-07days on market $239,900 Active 16 DOM
-
2026-06-03days on market $239,900 Active 12 DOM
-
2026-06-03days on market $239,900 Active 11 DOM
-
2026-06-01days on market $239,900 Active 10 DOM
-
2026-05-31days on market $239,900 Active 9 DOM
-
2026-03-31status Pending
-
2026-03-24$239,900 Active
-
1993-06-11soldstatus $70,000
ⓘ Source: listings_history table (triggers on properties + properties_extension) + one-shot
backfill from property_details.listing_events for pre-trigger history.
Tax reassessment forecast NY · Partial reset (capped growth)
- Current annual tax
- $4,309 · $359/mo
- Projected year-2 tax
- $4,309 · $359/mo
- Expected delta
- $0/yr ($0/mo · 0.0%)
ⓘ Screening estimate from a state-policy table — verify with the county assessor before closing.
Climate risk First Street
- Flood 1/10 Low FEMA zone X · 0% chance over 30 yrs
- Wildfire 2/10 Low
- Heat 2/10 Low 7 d/yr ≥95°F today · 16 d/yr by 30 yrs out
- Wind 1/10 Low
- Air quality 2/10 Low 1 unhealthy d/yr today · 1 by 30 yrs out
Nearby sold comps map
Loading sold comps map…
Walkable amenities ~0.75 mi
Loading nearby amenities…
Taxation est. · year 1
- Rental income
- $32,759
- − Mortgage interest
- −$13,326
- − Property taxes
- −$4,309
- − Insurance
- −$1,190
- − Repairs & maintenance
- −$2,621
- − Management
- −$2,621
- − HOA
- −$456
- − Depreciation
- −$6,921
- Taxable income
- $1,316
- Est. tax owed @ 24.0%
- −$316
- After-tax cash flow
- $4,638/yr
For passive investors: Depreciation is non-cash, so a rental often shows a tax loss while cash-flowing — sheltering income. Rental losses are passive: they offset passive income freely, and up to $25,000/yr can offset ordinary (W-2) income if you actively participate and your MAGI is under $100k (phasing out to $0 by $150k); unused losses carry forward. On sale, claimed depreciation is recaptured at up to 25%, and gains may owe capital-gains tax (a 1031 exchange can defer both). Figures are a year-1 estimate at your 24.0% rate — not tax advice; consult a CPA.
Schools (NCES district)
- District
- Canandaigua City School District
- NCES district ID
- 3606330
- Math proficiency
- 50% ▼ -10.00%
- Reading proficiency
- 59% ▲ 4.00%
- Median HH income
- $56,375
- Composite
- 47.09/100
- National rank
- #2335
- State rank
- #305 of 590 in NY
Livability — Canandaigua
- Score
- 75/100
- State rank
- #243
- US rank
- #3822
Category grades
Schools grade is shown separately in the Schools card above.
Census & demographics
- County
- Ontario County · 58,989 people
- City population
- 28,786
- Metro
- Rochester, NY
- Population (ZIP)
- 13,839
- Household income
- $94,609
- Rent vs Own
- Severe rent burden
- 257.0
Population outlook (Ontario County) Hauer SSP2
- Today (2025)
- 111,230 people
- By 2030
- 111,401 · +0.2%
- By 2040
- 109,535 · -1.5%
- By 2050
- 104,895 · -5.7%
- By 2075
- 92,999 · -16.4%
- By 2100
- 73,723 · -33.7%
Race, ethnicity, and origin ACS 2023
- Neighborhood character
- Predominantly White (86%)
- Race & ethnicity
- White 86% Two or more races 7% Hispanic / Latino 5% Black 2% Asian 2%
- Hispanic origin (detail)
- Puerto Rican 3% Dominican 1%
- Common ancestry
- Romanian 6% Lithuanian 5% Iranian 4%
- Foreign-born
- 3% · Canada, South Korea
- Languages at home
- 94% English-only · Spanish 3% Other Indo-European 1%
Political lean MEDSL · Ontario
- 2024 margin
- Toss-up / Even · D 49.4% · R 50.6%
- 2008→2024 swing
- -1.0pp toward R · 2008: -0.1pp · 2024: -1.2pp
- All cycles
- 2024: R+1.2 2020: R+0.0 2016: R+8.6 2012: R+1.6 2008: R+0.1
Not yet ingested
- Civics
- —
Market trends
- HPI YoY
- ▼ -47.59%
- Current HPI
- 267.0192
- Rent YoY
- —
- Metro
- Rochester, NY
- State GDP YoY
- ▲ 2.60%
- F500 in state
- 92
Industry mix (Fortune 500 HQ in NY)
| Industry | F500 HQs | Revenue |
|---|---|---|
| Financial Services | 10 | $950B |
|
||
| Consumer Goods | 9 | $162B |
|
||
| Insurance | 4 | $225B |
|
||
| Telecommunications | 2 | $144B |
|
||
| Pharmaceuticals | 2 | $112B |
|
||
| Media / Entertainment | 2 | $69B |
|
||
Price history
+242.7% since first listed3 events — show timeline
- 2026-03-31 Pending — UNYREIS
- 2026-03-24 Listed $239,900 UNYREIS
- 1993-06-11 Sold (Public Records) $70,000 Public Records
Property tax history
+4.2%/yrLatest (2025): $4,309 · +15.8% YoY. Source: county tax records.
Cash-flow waterfall
monthlySold comps — $/sqft
last 12 mo · ≤1 miLoading sold comps…