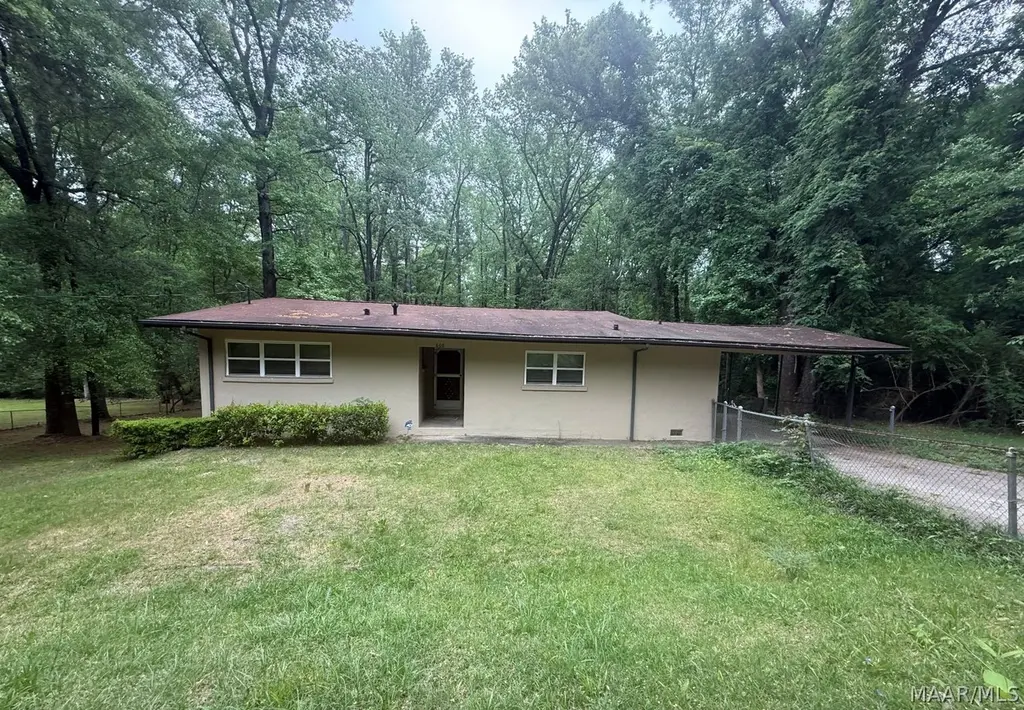
808 Neal St · Tuskegee, AL
Flood risk No data
- FEMA flood zone
- —
- Chance of flooding over 30 yrs
- —
- Est. flood insurance / yr
- —
Fire risk No data
- Est. fire insurance / yr
- —
Heat risk No data
- Hot days now (above threshold)
- —
- Hot days in 30 yrs
- —
Wind risk No data
- Chance of severe wind over 30 yrs
- —
Air-quality risk No data
- Unhealthy air days now
- —
- Unhealthy air days in 30 yrs
- —
Risk factors via First Street. Map © Google.
Why this score? — see what drove the B- grade
The composite is a weighted blend of 9 inputs, each scored 0–100. Each bar is that input's sub-score; the figure is the points it added to the 100-point composite (weight × sub-score).
- Cash flow +30.0/30.0
- DSCR +10.0/10.0
- 1% rule +9.0/10.0
- ARV discount +7.5/15.0
- Appreciation +5.1/10.0
- Livability +2.9/5.0
- Rent growth +2.5/5.0
- Condition / age +2.2/5.0
- Schools +0.7/10.0
$139,000
🖨 Deal sheet 📄 Offer letter ✓ Due diligence
Listing remarks
Great Home! Great Investment Property! Located in the Great Historical District of Tuskegee Institute, AL. just 1.5 miles from Tuskegee University in the Bibb Street Community. The property is convenient to downtown Tuskegee, the Historic Tuskegee Airmen's Museum, Tuskegee Airport, schools, shopping and much more. It's move in Ready, 3-bedroom 2 bath, kitchen/dining area, living room and separate laundry room with lots of room to enjoy some privacy and the outdoors living. Super large backyard. All furniture and appliances to remain. Property Sold" AS-IS", Owner finance, if qualifies. Call me, a realtor who cares about her customers and clients. 334-703-0586.
Key facts
- Large backyard
- Move in ready
- 1 acre lot
Tags
Property features AI
Exterior
- Parking: Attached carport with 2 carport spaces
- Utilities: Public water; Public sewer; Cable available
- Home design: Single-story stucco home; Basement foundation
- Construction: Stucco construction; Built (year per public records)
- Exterior features: Partial fencing; Porch; City lot
Interior
- Kitchen: Kitchen on the first floor
- Bedrooms: Three bedrooms on the first floor
- Flooring: Wood
- Bathrooms: Two full bathrooms on the first floor
- Heating & cooling: Central heating (electric); Central air conditioning (electric)
- Interior features: Unfinished basement; Wood flooring; Porch
- Laundry & utility: Laundry room on the first floor; Multiple water heaters
Neighborhood map
What this means for you Summary
Snapshot
- This is a 3-bed/2.0-bath single-family listed at $139k. Condition is rated fair.
Deal economics
- At list price, monthly cash flow is $580 ($7k/yr) — positive.
- The deal already cash-flows at list — no discount required.
- Meets the 1% rule at list price ($2k rent vs $139k).
- Recommended offer: $135k (3.0% below list) — sets the bar for market timing.
- Cap rate 11.3% vs local median 7.3% in Tuskegee — top-decile yield for the area; either an underpriced asset or a hidden risk that comps aren't pricing in. Stress-test before assuming the spread holds.
Location & tenants
- Location reads 57/100 on livability (#375 in AL) — a working-class tenant base; expect higher turnover. Strengths: cost of living A+, housing A; Watch: schools F, crime F, amenities F.
- Macon County (town): math 2% / reading 17% proficiency, ranked #123 of 129 in AL (top 95%) — low school quality limits family demand, transient renter base, plan for 1-2y turnover; 97% free/reduced lunch — lower-income household profile, screen leases tightly.
- Market conditions: 10 active listings in the ZIP; 1 comparable units currently listed for rent nearby; 5 units permitted in Macon County in 2024 (0 in 5+ unit buildings).
Forward outlook
- In year one you build about $1k of equity ($961 loan paydown + $215 appreciation (0.1% local appreciation)).
- Macon County population projected at -42% by 2050 — secular population decline; favor cash flow + early exit over multi-decade hold.
- At projected returns (0.1% appreciation + 3.0% rent growth), your $39k cash investment doubles in ~5 years — after that, you're playing with house money.
Negotiation context
- It's been on market 50 days — a 3% lower offer ($135k) is reasonable based on typical stale-listing flexibility.
Risks & watch-outs
- Watch-outs: built in 1959 — expect roof / HVAC / electrical / plumbing capex.
Questions for the listing agent
- It's been on market 50 days. Have you received any prior offers? Is the seller open to a 3% concession, seller financing, or rate buy-down credit?
- Have any recent inspections been done? Can we get a copy of the seller's disclosures and any deferred-maintenance estimates?
- Built in 1959 — when were the roof, HVAC, electrical panel, plumbing, and water heater last replaced?
- Is there a deadline driving the sale (1031 exchange, divorce, estate, relocation)? That informs how much negotiation room exists.
- Schools are F-rated, which usually means shorter tenancies and higher turnover. Who's the typical renter profile here, and what's been the actual vacancy rate?
- Crime grade is F in this area — have there been break-ins, vandalism, or insurance claims at this property in the last 3 years? What carrier currently insures it and at what premium?
- What's the average days-on-market for RENTAL listings here right now (not sales)? A rising rental-DOM trend means longer vacancies and softer asking-rent achievability than the comps imply.
- What's the recent tenant-quality profile in this submarket — average credit score on applications, eviction rate, late-payment / NSF rate, and stable-employment percentage? A property-management company in the area should have these aggregated.
- How much new for-sale + rental construction is in the pipeline within 1–3 miles? Heavy new supply typically softens prices + rents 12–24 months out; constrained supply supports both.
Investment metrics
- 1% rule
- 1.40% ✓
- Cap rate
- 11.30%
- Cash-on-cash
- 17.88%
- DSCR
- 1.80
- GRM
- 5.9
CMA / ARV
- ARV (median comp)
- $89,927
- List price
- $139,000
- Delta
- 54.57%
- Verdict
- OVERPRICED
- Comps
- 20 within 1.0 mi
Show comp detail 3 sales within ~0.75 mi
| Address | Dist | Beds/Ba | Sqft | Sold | Price | $/sf | Match |
|---|---|---|---|---|---|---|---|
| 1809 W Montgomery Rd | 0.34mi | 3/2.0 | 1,472 (-6%) | 12mo | $175,000 | $119 | 63 |
| 2309 Alabama Ave | 0.69mi | 3/2.0 | 1,632 (+4%) | 7mo | $138,000 | $85 | 56 |
| 804 Gaillard Dr | 0.59mi | 3/2.0 | 1,479 (-6%) | 14mo | $80,000 | $54 | 51 |
Match score weights: distance 35% · size 25% · config 20% · recency 20%. Top-matched comps best support the ARV.
Projected returns pro-forma
0.15% appreciation · 3.0% rent growth · sell at horizon
- IRR
- 17.9%
- Equity multiple
- 1.87×
- Total profit
- $33,913
- Equity at exit
- $41,441
- IRR
- 22.1%
- Equity multiple
- 3.48×
- Total profit
- $96,598
- Equity at exit
- $50,684
Cash invested: $38,920 (down + closing). Projections, not guarantees.
Landlord ↔ Tenant lean methodology
- Overall (STATE)
- 90 Strongly Landlord-Friendly
- State Alabama
- 90 Strongly Landlord-Friendly · R+15
- County
- — inherits STATE
- City
- — inherits STATE
ZIP-level market 36088
- Home prices YoY
- 0.1%
- Active inventory
- 10
- Price-to-rent
- 5.9×
Monthly cashflow live
- Estimated rent
- $1,950 medium interval (Pro) →
- Mortgage (P&I)
- −$729
- Tax est. 1.5%
- −$174 /mo · $2,085/yr
- Insurance
- −$58
- HOA
- −$0
- Vacancy / Maint / Mgmt
- −$410
- Net cashflow
- $580
Break-even live
UW: 25.0% down · 7.5% · 30yr · 1.5% tax · 5.0% vac · 8.0% maint · 8.0% mgmt
Financing live
Cash to close
- Down payment
- $34,750
- Closing costs
- $4,170
- Reserves months
- —
- Total cash needed
- —
Loan-product check · same deal, 3 products live
Conventional
25% down · 7.5% · 30yr
- Down + closing
- —
- Monthly P&I
- —
- Monthly cashflow
- —
- DSCR
- —
- Eligible?
- —
Personal DTI + credit; lowest rate.
DSCR
20% down · 8.5% · 30yr
- Down + closing
- —
- Monthly P&I
- —
- Monthly cashflow
- —
- DSCR
- —
- Eligible?
- —
No personal income docs; deal must DSCR.
Hard money
10% down · 12.0% · 12mo
- Down + closing
- —
- Monthly P&I
- —
- Monthly cashflow
- —
- DSCR
- —
- Eligible?
- —
Short-term bridge; refi at stabilization.
Rent comps 1 comps
| Address | Beds | Baths | Sqft | Rent | $/sqft | DOM | Units | Dist |
|---|---|---|---|---|---|---|---|---|
| 1101 New St Tuskegee, AL | 3.0 | 3.0 | 1528 | $1,950 | $1.28 | 43d | 1 | 0.54mi |
Listing history 17 events
-
2026-06-19days on market $139,000 Active 50 DOM
-
2026-06-18days on market $139,000 Active 49 DOM
-
2026-06-17days on market $139,000 Active 48 DOM
-
2026-06-16days on market $139,000 Active 47 DOM
-
2026-06-15days on market $139,000 Active 46 DOM
-
2026-06-14days on market $139,000 Active 44 DOM
-
2026-06-13days on market $139,000 Active 43 DOM
-
2026-06-10days on market $139,000 Active 41 DOM
-
2026-06-09days on market $139,000 Active 40 DOM
-
2026-06-08days on market $139,000 Active 39 DOM
-
2026-06-07days on market $139,000 Active 38 DOM
-
2026-06-05days on market $139,000 Active 35 DOM
-
2026-06-02days on market $139,000 Active 33 DOM
-
2026-06-01days on market $139,000 Active 32 DOM
-
2026-05-31days on market $139,000 Active 31 DOM
-
2026-05-30days on market $139,000 Active 30 DOM
-
2026-04-30$139,000 Active 677-char remark
ⓘ Source: listings_history table (triggers on properties + properties_extension) + one-shot
backfill from property_details.listing_events for pre-trigger history.
Nearby sold comps map
Loading sold comps map…
Walkable amenities ~0.75 mi
Loading nearby amenities…
Taxation est. · year 1
- Rental income
- $23,400
- − Mortgage interest
- −$7,786
- − Property taxes
- −$2,085
- − Insurance
- −$695
- − Repairs & maintenance
- −$1,872
- − Management
- −$1,872
- − Depreciation
- −$4,044
- Taxable income
- $5,046
- Est. tax owed @ 24.0%
- −$1,211
- After-tax cash flow
- $5,748/yr
For passive investors: Depreciation is non-cash, so a rental often shows a tax loss while cash-flowing — sheltering income. Rental losses are passive: they offset passive income freely, and up to $25,000/yr can offset ordinary (W-2) income if you actively participate and your MAGI is under $100k (phasing out to $0 by $150k); unused losses carry forward. On sale, claimed depreciation is recaptured at up to 25%, and gains may owe capital-gains tax (a 1031 exchange can defer both). Figures are a year-1 estimate at your 24.0% rate — not tax advice; consult a CPA.
Condition & rehab AI · 10 photos
This property requires moderate renovations, including updating bathrooms and landscaping, to improve its resale and rental value.
Repairs flagged
- Major bathroom fixtures — Dated and worn-out
- Major landscaping — Overgrown yard
Value-add opportunities
- Both paint interior walls — Enhances curb appeal and interior aesthetics
- Both replace bathroom fixtures — Modernizes and improves functionality
- Both landscaping — Enhances curb appeal and creates a welcoming environment
Renovation cost estimate screening
| Repair item | Severity | Est. cost |
|---|---|---|
| bathroom fixtures · Dated and worn-out | Major | $15,000–50,000 |
| landscaping · Overgrown yard | Major | $15,000–50,000 |
| Total estimated repair cost · 2 items | $30,000–100,000 |
Value-add ROI direction
- Both paint interior walls — Enhances curb appeal and interior aesthetics ↑
- Both replace bathroom fixtures — Modernizes and improves functionality ↑
- Both landscaping — Enhances curb appeal and creates a welcoming environment ↑
ⓘ Cost ranges are severity-bucket heuristics (US national rule-of-thumb). Get contractor quotes + a written scope before underwriting a rehab budget.
Schools (NCES district)
- District
- Macon County
- NCES district ID
- 0102190
- Math proficiency
- 2% ▼ -18.00%
- Reading proficiency
- 17% ▼ -8.00%
- Median HH income
- $30,012
- Composite
- 7.24/100
- National rank
- #9958
- State rank
- #123 of 129 in AL
Livability — Tuskegee
- Score
- 57/100
- State rank
- #375
- US rank
- #21590
Category grades
Schools grade is shown separately in the Schools card above.
Census & demographics
- Census place
- Tuskegee, AL
- City population
- 3,493
- Population (ZIP)
- 3,493
Population outlook (Macon County) Hauer SSP2
- Today (2025)
- 15,805 people
- By 2030
- 14,101 · -10.8%
- By 2040
- 11,244 · -28.9%
- By 2050
- 9,088 · -42.5%
- By 2075
- 6,606 · -58.2%
- By 2100
- 6,309 · -60.1%
Race, ethnicity, and origin ACS 2023
- Neighborhood character
- Predominantly Black (83%)
- Race & ethnicity
- Black 83% White 10% Two or more races 3% Hispanic / Latino 2% Asian 1%
- Foreign-born
- 2% · Canada
- Languages at home
- 98% English-only · Other Indo-European 1% Spanish 1%
Political lean MEDSL · Macon
- 2024 margin
- Solid D (+56.3) · D 77.8% · R 21.5%
- 2008→2024 swing
- -17.8pp toward R · 2008: 74.0pp · 2024: 56.3pp
- All cycles
- 2024: D+56.3 2020: D+63.8 2016: D+66.8 2012: D+74.4 2008: D+74.0
Not yet ingested
- Civics
- —
Market trends
- HPI YoY
- ▲ 0.15%
- Current HPI
- 149.1572
- Rent YoY
- —
- Metro
- —
- State GDP YoY
- ▲ 2.94%
- F500 in state
- 4
Industry mix (Fortune 500 HQ in AL)
| Industry | F500 HQs | Revenue |
|---|---|---|
| Financial Services | 1 | $8B |
|
||
| Healthcare | 1 | $5B |
|
||
Price history
1 event — show timeline
- 2026-04-30 Listed $139,000 MAAR
Cash-flow waterfall
monthlySold comps — $/sqft
last 12 mo · ≤1 miLoading sold comps…