2901 NW 46th Ave #106 · Lauderdale Lakes, FL
Flood risk 1/10 · Minimal
- FEMA flood zone
- X (shaded)
- Chance of flooding over 30 yrs
- 0.0%
- Est. flood insurance / yr
- $507 – $1,088
Fire risk 1/10 · Minimal
- Est. fire insurance / yr
- $947 – $1,759
Heat risk 10/10 · Severe
- Hot days now (above 105°F)
- 7 days/yr
- Hot days in 30 yrs
- 25 days/yr
Wind risk 10/10 · Severe
- Chance of severe wind over 30 yrs
- 99.0%
Air-quality risk 3/10 · Minor
- Unhealthy air days now
- 3 days/yr
- Unhealthy air days in 30 yrs
- 3 days/yr
Risk factors via First Street. Map © Google.
Why this score? — see what drove the C- grade
The composite is a weighted blend of 9 inputs, each scored 0–100. Each bar is that input's sub-score; the figure is the points it added to the 100-point composite (weight × sub-score).
- Cash flow +17.4/30.0
- 1% rule +10.0/10.0
- ARV discount +7.5/15.0
- DSCR +5.4/10.0
- Schools +4.1/10.0
- Livability +4.0/5.0
- Rent growth +2.6/5.0
- Condition / age +2.5/5.0
- Appreciation +0.0/10.0
$100,000
🖨 Deal sheet 📄 Offer letter ✓ Due diligence
Listing remarks
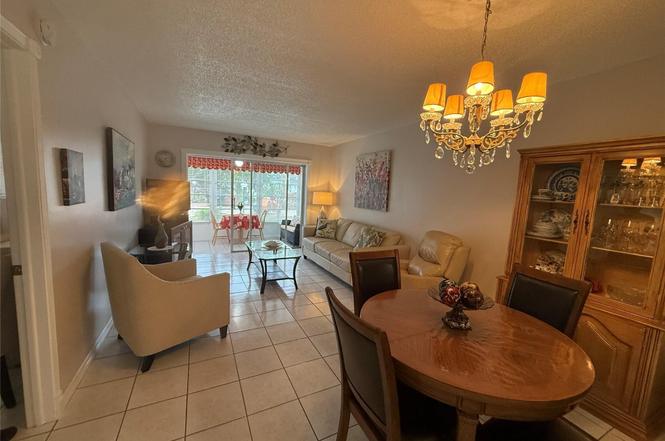
Georgeous 1 bedroom, 1.5 baths in a adult community in Lauderdale Oaks. Come all furnish and turnkey. update kitchen, tiles through out, Sofa open up for a queen bed. hurricane shutter in the bedroom, internet include in the HOA. 50 years certification done. Roof, sewer and pipe done. Very convenient first floor and Parking in front of the door. Amenities are: Heated pool, shuffleboard, Petanque, pickle ball, exercise and billiard room. Good location close to main road, airport, hospital, about 20 min to the beach.
Key facts
- Parking in front
- Update kitchen
- First floor
Tags
Property features AI
Finance
- Other: Living area listed as 768
- HOA & community: Community is a senior community; Has association; Monthly HOA fee approximately $429; Association fee includes insurance, structure maintenance, pest control, sewer, trash, water, common areas, elevator, reserve funds, roof repairs, and recreation facility; Association amenities: clubhouse, fitness center, pool, sauna, shuffleboard court, storage, trash chute, community room, internet included, pickleball court(s), security
Exterior
- Parking: Assigned parking; Guest parking
- Security: Closed-circuit cameras; Security patrol
- Home design: Condominium; Resale; 4-story building
- Construction: CBS construction
- Exterior features: Not waterfront
Interior
- Kitchen: Dishwasher; Electric range; Microwave; Refrigerator
- Bedrooms: 1 bedroom on the main level
- Flooring: Tile
- Bathrooms: 1 full bathroom; 1 half bathroom
- Heating & cooling: Central heating; Central air; Ceiling fan(s)
- Interior features: Walk-in closet(s)
Neighborhood map
What this means for you Summary
Snapshot
- This is a 1-bed/1.0-bath condo listed at $100k.
Deal economics
- At list price, monthly cash flow is $74 ($892/yr) — positive.
- The deal already cash-flows at list — no discount required.
- Meets the 1% rule at list price ($2k rent vs $100k).
- Recommended offer: $91k (9.0% below list) — sets the bar for market timing.
- Cap rate 7.2% vs local median 5.6% in Lauderdale Lakes — meaningfully above typical; check what's discounted (condition, days-on-market, listing class) to confirm the premium yield is real.
Location & tenants
- Location reads 81/100 on livability (#100 in FL, #1,527 nationally) — a professional / high-income tenant draw. Strengths: commute A+, cost of living A+, housing A+; Watch: schools C-, crime D+, amenities F.
- Broward (suburban): math 42% / reading 53% proficiency, ranked #46 of 73 in FL (top 63%) — families likely to look elsewhere, expect single-tenant / working-renter base with shorter leases.
- Market conditions: Rents flat; 656 active listings in the ZIP; 40 comparable units currently listed for rent nearby; rentals at typical pace (median 24d on market — plan ~3-4 weeks tenant-placement turnaround); 2,111 units permitted in Broward County in 2024 (1,265 in 5+ unit buildings).
- This rent runs 41% of the median local income ($46k/yr) — at the standard rent-burdened threshold; future hikes will face affordability resistance.
Forward outlook
- Local home prices are declining (-3.0%/yr); year-one equity from $691 of loan paydown is wiped out by about $3k of value loss. Plan a longer hold.
- Broward County population projected at +34% by 2050 — long-run rental-demand tailwind backs the buy-and-hold thesis.
Negotiation context
- It's been on market 99 days — a 9% lower offer ($91k) is reasonable based on typical stale-listing flexibility.
- Current owner paid $50k; list at $100k implies a 102% gain — meaningful room to come down on a strong offer.
Risks & watch-outs
- Watch-outs: HOA is 27% of rent.
- Climate carrying-cost: severe wind risk, 99% chance of damaging wind over 30y; extreme-heat days projected 7→25/yr by 2055 (HVAC capex compounding) — expect insurance premiums to compound above CPI over the hold.
Questions for the listing agent
- It's been on market 99 days. Have you received any prior offers? Is the seller open to a 9% concession, seller financing, or rate buy-down credit?
- Built in 1972 — when were the roof, HVAC, electrical panel, plumbing, and water heater last replaced?
- What does the HOA fee cover, when was the last increase, and are there any pending special assessments or reserve-fund shortfalls?
- Any open or pending special assessments — roof, HVAC, plumbing, elevator, façade? What's the per-unit balance and payoff schedule, and is the seller paying it off at close or rolling it to the buyer?
- Why hasn't it sold? Are there any deal-killer items the seller is aware of (foundation, flood, title, zoning, code violations)?
- Is there a deadline driving the sale (1031 exchange, divorce, estate, relocation)? That informs how much negotiation room exists.
- Crime grade is D in this area — have there been break-ins, vandalism, or insurance claims at this property in the last 3 years? What carrier currently insures it and at what premium?
- What's the average days-on-market for RENTAL listings here right now (not sales)? A rising rental-DOM trend means longer vacancies and softer asking-rent achievability than the comps imply.
- What's the recent tenant-quality profile in this submarket — average credit score on applications, eviction rate, late-payment / NSF rate, and stable-employment percentage? A property-management company in the area should have these aggregated.
- How much new apartment / multifamily construction is in the pipeline within 1–3 miles? Heavy new supply (>2% of stock underway) typically softens rents 12–24 months out; light construction supports rent growth.
Investment metrics
- 1% rule
- 1.58% ✓
- Cap rate
- 7.19%
- Cash-on-cash
- 3.19%
- DSCR
- 1.14
- GRM
- 5.3
CMA / ARV
No comps found within radius.
Projected returns pro-forma
-3.0% appreciation · 0.26% rent growth · sell at horizon
- IRR
- -16.1%
- Equity multiple
- 0.45×
- Total profit
- $-15,394
- Equity at exit
- $14,910
- IRR
- -18.8%
- Equity multiple
- 0.20×
- Total profit
- $-22,499
- Equity at exit
- $8,646
Cash invested: $28,000 (down + closing). Projections, not guarantees.
Landlord ↔ Tenant lean methodology
- Overall (STATE)
- 87 Strongly Landlord-Friendly
- State Florida
- 87 Strongly Landlord-Friendly · R+3
- County
- — inherits STATE
- City
- — inherits STATE
ZIP-level market 33313
- Rents YoY
- 0.3%
- Active inventory
- 656
- Price-to-rent
- 5.3×
Monthly cashflow live
- Estimated rent
- $1,583 high interval (Pro) →
- Mortgage (P&I)
- −$524
- Tax from tax record
- −$181 /mo · $2,174/yr
- Insurance
- −$42
- HOA
- −$429
- Vacancy / Maint / Mgmt
- −$332
- Net cashflow
- $74
Break-even live
UW: 25.0% down · 7.5% · 30yr · 1.5% tax · 5.0% vac · 8.0% maint · 8.0% mgmt
Financing live
Cash to close
- Down payment
- $25,000
- Closing costs
- $3,000
- Reserves months
- —
- Total cash needed
- —
Loan-product check · same deal, 3 products live
Conventional
25% down · 7.5% · 30yr
- Down + closing
- —
- Monthly P&I
- —
- Monthly cashflow
- —
- DSCR
- —
- Eligible?
- —
Personal DTI + credit; lowest rate.
DSCR
20% down · 8.5% · 30yr
- Down + closing
- —
- Monthly P&I
- —
- Monthly cashflow
- —
- DSCR
- —
- Eligible?
- —
No personal income docs; deal must DSCR.
Hard money
10% down · 12.0% · 12mo
- Down + closing
- —
- Monthly P&I
- —
- Monthly cashflow
- —
- DSCR
- —
- Eligible?
- —
Short-term bridge; refi at stabilization.
Rent comps 40 comps
| Address | Beds | Baths | Sqft | Rent | $/sqft | DOM | Units | Dist |
|---|---|---|---|---|---|---|---|---|
| 2800 NW 47th Ter Unit 106B Lauderdale Lakes, FL | 1.0 | 1.0 | 768 | $1,650 | $2.15 | 24d | 1 | 0.05mi |
| 2861 NW 47th Ter Lauderdale Lakes, FL | 2.0 | 2.0 | 1021 | $1,700 | $1.67 | 24d | 1 | 0.08mi |
| 2861 NW 47th Ter Unit 207B Lauderdale Lakes, FL | 1.0 | 1.0 | 768 | $1,400 | $1.82 | 24d | 1 | 0.08mi |
| 3061 NW 47th Ter #327 Lauderdale Lakes, FL | 1.0 | 1.5 | 662 | $1,500 | $2.27 | 24d | 1 | 0.13mi |
| 3061 NW 47th Ter Unit 132C Lauderdale Lakes, FL | 1.0 | 1.0 | 610 | $1,500 | $2.46 | 24d | 1 | 0.13mi |
| 3061 NW 47th Ter Unit 327B Lauderdale Lakes, FL | 1.0 | 1.5 | 662 | $1,600 | $2.42 | 7d | 1 | 0.13mi |
| 2901 NW 47th Ter Unit 348B Lauderdale Lakes, FL | 1.0 | 1.5 | 662 | $1,350 | $2.04 | 24d | 1 | 0.13mi |
| 2901 NW 47th Ter Unit 247B Lauderdale Lakes, FL | 1.0 | 1.5 | 662 | $1,450 | $2.19 | 24d | 1 | 0.13mi |
| 3001 NW 48th Ave #440 Lauderdale Lakes, FL | 1.0 | 1.5 | 705 | $1,300 | $1.84 | 24d | 1 | 0.17mi |
| 3099 NW 48th Ave #153 Lauderdale Lakes, FL | 2.0 | 2.0 | 960 | $1,850 | $1.93 | 24d | 1 | 0.23mi |
| 3070 NW 48th Ter Lauderdale Lakes, FL | 2.0 | 2.0 | 960 | $1,750 | $1.82 | 7d | 2 | 0.29mi |
| 3070 NW 48th Ter #104 Lauderdale Lakes, FL | 2.0 | 2.0 | 960 | $1,750 | $1.82 | 24d | 1 | 0.29mi |
| 3070 NW 48th Ter #405 Lauderdale Lakes, FL | 2.0 | 2.0 | 960 | $1,850 | $1.93 | 2d | 1 | 0.29mi |
| 2980 NW 43rd Ter #207 Lauderdale Lakes, FL | 2.0 | 2.0 | 890 | $1,800 | $2.02 | 24d | 1 | 0.29mi |
| 3030 NW 43rd Ter Lauderdale Lakes, FL | 1.0 | 1.0 | 592 | $1,400 | $2.36 | 2d | 2 | 0.29mi |
| 3030 NW 43rd Ter #102 Lauderdale Lakes, FL | 1.0 | 1.0 | 710 | $1,450 | $2.04 | 24d | 1 | 0.31mi |
| 4851 NW 26th Ct #338 Lauderdale Lakes, FL | 1.0 | 1.0 | 705 | $1,650 | $2.34 | 16d | 1 | 0.31mi |
| 3033 NW 43rd Ave #108 Lauderdale Lakes, FL | 1.0 | 1.0 | 650 | $1,590 | $2.45 | 14d | 1 | 0.33mi |
| 3141 NW 47th Ter #430 Lauderdale Lakes, FL | 2.0 | 2.0 | 1002 | $1,700 | $1.70 | 22d | 1 | 0.37mi |
| 3161 NW 47th Ter #110 Lauderdale Lakes, FL | 1.0 | 1.5 | 721 | $1,500 | $2.08 | 5d | 1 | 0.37mi |
| 3161 NW 47th Ter #111 Lauderdale Lakes, FL | 1.0 | 1.5 | 721 | $1,500 | $2.08 | 24d | 1 | 0.37mi |
| 3141 NW 47th Ter Lauderdale Lakes, FL | 1.0–2.0 | 1.5–2.0 | 861 | $1,440 | $1.67 | 24d | 2 | 0.37mi |
| 3301 NW 47th Ter #308 Lauderdale Lakes, FL | 1.0 | 2.0 | 750 | $2,200 | $2.93 | 12d | 1 | 0.40mi |
| 4121 NW 26th St Unit T16 Lauderhill, FL | 1.0 | 1.5 | 750 | $1,500 | $2.00 | 24d | 1 | 0.42mi |
| 5021 W Oakland Park Blvd Lauderdale Lakes, FL | 1.0 | 1.0 | 684 | $1,550 | $2.27 | 17d | 2 | 0.43mi |
| 4141 NW 26th St #316 Lauderhill, FL | 1.0 | 1.0 | 624 | $1,450 | $2.32 | 24d | 1 | 0.43mi |
| 3341 NW 47th Ter #301 Lauderdale Lakes, FL | 2.0 | 2.0 | 1002 | $2,050 | $2.05 | 3d | 1 | 0.44mi |
| 5031 W Oakland Park Blvd Lauderdale Lakes, FL | 1.0 | 1.0 | 683 | $1,400 | $2.05 | 10d | 2 | 0.50mi |
| 4848 NW 24th Ct Lauderdale Lakes, FL | 1.0–3.0 | 1.0–2.0 | 1045 | $1,550 | $1.48 | 16d | 3 | 0.51mi |
| 4848 NW 24th Ct Lauderdale Lakes, FL | 1.0–3.0 | 1.0–2.0 | 1045 | $1,450 | $1.39 | 5d | 4 | 0.51mi |
| 5111 W Oakland Park Blvd #301 Lauderdale Lakes, FL | 2.0 | 2.0 | 944 | $1,700 | $1.80 | 5d | 1 | 0.51mi |
| 5051 W Oakland Park Blvd #204 Lauderdale Lakes, FL | 2.0 | 2.0 | 944 | $1,900 | $2.01 | 24d | 1 | 0.55mi |
| 4750 NW 22nd Ct #502 Lauderhill, FL | 1.0 | 1.5 | 928 | $1,600 | $1.72 | 24d | 1 | 0.56mi |
| 2700 NW 39th Way Lauderdale Lakes, FL | 2.0–3.0 | 1.0–1.5 | 858 | $1,750 | $2.04 | 3d | 6 | 0.57mi |
| 3460 NW 50th Ave Lauderdale Lakes, FL | 1.0–2.0 | 1.0–2.0 | 750 | $1,499 | $2.00 | 16d | 3 | 0.58mi |
| 2606 NW 52nd Ave Unit D15 Lauderhill, FL | 2.0 | 1.5 | 1020 | $1,950 | $1.91 | 24d | 1 | 0.59mi |
| 2916 NW 55th Ave Unit 2A Lauderhill, FL | 2.0 | 2.0 | 1060 | $2,200 | $2.08 | 7d | 1 | 0.59mi |
| 4400 NW 36th St Lauderdale Lakes, FL | 2.0–3.0 | 1.0–2.0 | 1100 | $1,700 | $1.55 | 4d | 9 | 0.59mi |
| 2604 NW 52nd Ave Unit C15 Lauderhill, FL | 2.0 | 1.5 | 940 | $1,800 | $1.91 | 24d | 1 | 0.59mi |
| 2552 NW 52nd Ave Unit B19 Lauderhill, FL | 2.0 | 1.5 | 940 | $1,900 | $2.02 | 4d | 1 | 0.60mi |
HOA detail condo
- Monthly dues
- $429 · $5,148/yr
- Likely covers
- sewerinternetpool
- Assessments
- None detected in remarks — confirm with the listing agent.
Listing history 16 events
-
2026-06-18days on market $100,000 Active 99 DOM
-
2026-06-17days on market $100,000 Active 98 DOM
-
2026-06-16days on market $100,000 Active 97 DOM
-
2026-06-15days on market $100,000 Active 96 DOM
-
2026-06-13days on market $100,000 Active 94 DOM
-
2026-06-09days on market $100,000 Active 90 DOM
-
2026-06-07days on market $100,000 Active 88 DOM
-
2026-06-04days on market $100,000 Active 85 DOM
-
2026-06-03days on market $100,000 Active 84 DOM
-
2026-06-02days on market $100,000 Active 83 DOM
-
2026-06-01days on market $100,000 Active 82 DOM
-
2026-05-31days on market $100,000 Active 81 DOM
-
2026-01-20$100,000 Active
-
2013-04-12soldstatus $49,500
-
2004-03-09soldstatus $35,000
-
1995-03-28soldstatus $22,000
ⓘ Source: listings_history table (triggers on properties + properties_extension) + one-shot
backfill from property_details.listing_events for pre-trigger history.
Tax reassessment forecast FL · Resets to sale price
- Current annual tax
- $2,174 · $181/mo
- Projected year-2 tax
- $2,174 · $181/mo
- Expected delta
- $0/yr ($0/mo · 0.0%)
ⓘ Screening estimate from a state-policy table — verify with the county assessor before closing.
Climate risk First Street
- Flood 1/10 Low FEMA zone X (shaded) · 0% chance over 30 yrs
- Wildfire 1/10 Low
- Heat 10/10 Extreme 7 d/yr ≥105°F today · 25 d/yr by 30 yrs out
- Wind 10/10 Extreme 99% chance of damaging wind over 30 yrs
- Air quality 3/10 Moderate 3 unhealthy d/yr today · 3 by 30 yrs out
Nearby sold comps map
Loading sold comps map…
Walkable amenities ~0.75 mi
Loading nearby amenities…
Taxation est. · year 1
- Rental income
- $18,997
- − Mortgage interest
- −$5,602
- − Property taxes
- −$2,174
- − Insurance
- −$500
- − Repairs & maintenance
- −$1,520
- − Management
- −$1,520
- − HOA
- −$5,148
- − Depreciation
- −$2,909
- Taxable loss
- −$375
- Est. tax savings @ 24.0%
- +$90
- After-tax cash flow
- $983/yr
For passive investors: Depreciation is non-cash, so a rental often shows a tax loss while cash-flowing — sheltering income. Rental losses are passive: they offset passive income freely, and up to $25,000/yr can offset ordinary (W-2) income if you actively participate and your MAGI is under $100k (phasing out to $0 by $150k); unused losses carry forward. On sale, claimed depreciation is recaptured at up to 25%, and gains may owe capital-gains tax (a 1031 exchange can defer both). Figures are a year-1 estimate at your 24.0% rate — not tax advice; consult a CPA.
Schools (NCES district)
- District
- Broward
- NCES district ID
- 1200180
- Math proficiency
- 42% ▼ -18.00%
- Reading proficiency
- 53% ▼ -5.00%
- Median HH income
- $52,139
- Composite
- 40.88/100
- National rank
- #3621
- State rank
- #46 of 73 in FL
Livability — Lauderdale Lakes
- Score
- 81/100
- State rank
- #100
- US rank
- #1527
Category grades
Schools grade is shown separately in the Schools card above.
Census & demographics
- Census place
- Lauderdale Lakes, FL
- County
- Broward County · 1,963,430 people
- Metro
- Miami-Fort Lauderdale-Pompano Beach, FL
- Population (ZIP)
- 62,807
- Household income
- $46,305
- Rent vs Own
- Severe rent burden
- 5692.0
Population outlook (Broward County) Hauer SSP2
- Today (2025)
- 2,207,033 people
- By 2030
- 2,360,704 · +7.0%
- By 2040
- 2,661,208 · +20.6%
- By 2050
- 2,946,698 · +33.5%
- By 2075
- 3,602,273 · +63.2%
- By 2100
- 3,970,984 · +79.9%
Race, ethnicity, and origin ACS 2023
- Neighborhood character
- Predominantly Black (77%)
- Race & ethnicity
- Black 77% Hispanic / Latino 12% Two or more races 8% White 7% Asian 2%
- Hispanic origin (detail)
- Puerto Rican 2% Cuban 3% Dominican 1%
- Common ancestry
- Hispanic 20%
- Foreign-born
- 39% · Canada, Jamaica, Dominican Republic
- Languages at home
- 66% English-only · French/Haitian/Cajun 22% Spanish 10%
Political lean MEDSL · Broward
- 2024 margin
- D (+17.0) · D 58.0% · R 41.0%
- 2008→2024 swing
- -17.8pp toward R · 2008: 34.7pp · 2024: 17.0pp
- All cycles
- 2024: D+17.0 2020: D+29.8 2016: D+35.0 2012: D+34.9 2008: D+34.7
Not yet ingested
- Civics
- —
Market trends
- HPI YoY
- ▼ -338.15%
- Current HPI
- 288.9345
- Rent YoY
- ▲ 0.26%
- Metro
- Miami-Fort Lauderdale-Pompano Beach, FL
- State GDP YoY
- ▲ 3.28%
- F500 in state
- 36
Industry mix (Fortune 500 HQ in FL)
| Industry | F500 HQs | Revenue |
|---|---|---|
| Industrial Technology | 2 | $29B |
|
||
| Insurance | 2 | $17B |
|
||
| Retail | 1 | $60B |
|
||
| Technology Distribution | 1 | $58B |
|
||
| Homebuilding | 1 | $35B |
|
||
| Technology Manufacturing | 1 | $35B |
|
||
Price history
+354.5% since first listed4 events — show timeline
- 2026-01-20 Listed $100,000 Beaches MLS
- 2013-04-12 Sold (Public Records) $49,500 Public Records
- 2004-03-09 Sold (Public Records) $35,000 Public Records
- 1995-03-28 Sold (Public Records) $22,000 Public Records
Property tax history
+8.2%/yrLatest (2025): $2,174 · +6.2% YoY. Source: county tax records.
Cash-flow waterfall
monthlySold comps — $/sqft
last 12 mo · ≤1 miLoading sold comps…