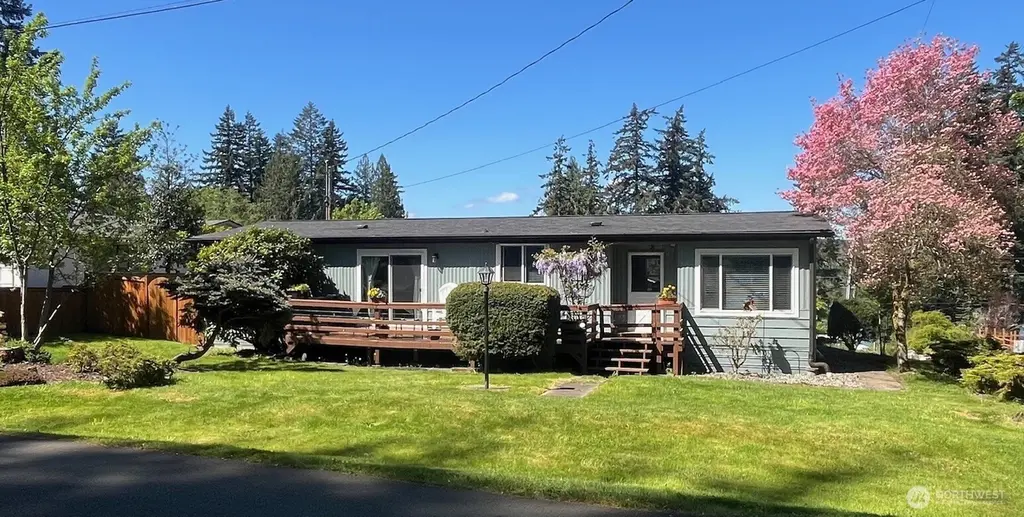
10029 Whitecap Dr NE · Olympia, WA
Flood risk 1/10 · Minimal
- FEMA flood zone
- X (unshaded)
- Chance of flooding over 30 yrs
- 0.0%
- Est. flood insurance / yr
- $507 – $1,088
Fire risk 1/10 · Minimal
- Est. fire insurance / yr
- $604 – $1,122
Heat risk 3/10 · Minor
- Hot days now (above 88°F)
- 7 days/yr
- Hot days in 30 yrs
- 14 days/yr
Wind risk 1/10 · Minimal
- Chance of severe wind over 30 yrs
- —
Air-quality risk 6/10 · Moderate
- Unhealthy air days now
- 7 days/yr
- Unhealthy air days in 30 yrs
- 7 days/yr
Risk factors via First Street. Map © Google.
Why this score? — see what drove the D grade
The composite is a weighted blend of 9 inputs, each scored 0–100. Each bar is that input's sub-score; the figure is the points it added to the 100-point composite (weight × sub-score).
- Appreciation +10.0/10.0
- ARV discount +9.4/15.0
- Cash flow +6.5/30.0
- Schools +5.8/10.0
- Livability +4.2/5.0
- Rent growth +3.3/5.0
- Condition / age +2.5/5.0
- 1% rule +1.2/10.0
- DSCR +0.8/10.0
$359,900
🖨 Deal sheet (PDF) 📄 Offer letter ✓ Due diligence
Listing remarks
Experience the Puget Sound lifestyle in Carlyon Beach, where coastal living meets modern comfort. Just three blocks from beach access, a kayak and boat launch, a marina, and a private park, this home offers endless outdoor adventure. Inside, enjoy upgrades like a newer roof, laminate plank flooring, energy-efficient windows, and a ductless heating and AC system installed in 2020. The home also features updated appliances, LED lighting, a relaxing deck to enjoy the morning sunrise. Enjoy the peek a boo view of the sound view from the dining room, this airy 2-bedroom, 2-bath home is move-in ready. Quiet evenings and a friendly walking neighborhood make this a perfect year-round retreat. Don&r
Key facts
- 7,914 sq ft lot
- 2 parking spots
- Built 1979
Property features AI
Finance
- Other: Zoning: RL2/1; Lot features: Lot 1; approximate dimensions 94' x 63' x 13' x 16' x 17' x 80'
- Financial info: Accepts Cash, Conventional, FHA, State Bond, VA Loan
- HOA & community: Carlyon Beach Home Owner Association; HOA dues $122 per month (includes common area maintenance and water); Community features: boat launch, CCRs, club house, park, playground
Exterior
- Parking: Detached carport; Driveway; 1 covered space; 1 uncovered parking space
- Utilities: Electric power; PSE electric service; Community water (Carlyon Beach); Septic sewer; Xfinity cable and internet; Electric water heater
- Home design: Manufactured home (double wide); Manufactured on land; One story; Main level entry; East-facing
- Construction: Metal/vinyl exterior; Composition (shingle) roof; Built circa 2010 (effective year); Pillar/post/pier foundation with tie-downs; Hillcrest make, model 52/24
- Exterior features: Deck; Cable TV available; High-speed internet available; Corner lot; Paved lot; Community waterfront / private beach access
Interior
- Kitchen: Dishwasher; Double oven; Microwave; Refrigerator
- Bedrooms: 2 bedrooms (both on main level); Primary bedroom on main level
- Flooring: Vinyl; Vinyl plank
- Bathrooms: 2 full bathrooms (both on main level); 2 bathtubs; 2 showers
- Heating & cooling: Ductless heating; Has cooling
- Interior features: Water heater; Outside access to water heater; View
- Laundry & utility: Washer; Dryer; Utility room on main level
Neighborhood map
What this means for you Summary
Snapshot
- This is a 2-bed/2.0-bath manufactured listed at $360k.
Deal economics
- At list price, monthly cash flow is $-613 ($-7k/yr) — negative.
- To cash-flow at today's rent, offer at most $252k (30.1% below list).
- To meet the 1% rule (rent ≥ 1% of price), the offer needs to be $222k (38.4% below list).
- Recommended offer: $222k (38.4% below list) — sets the bar for 1% rule.
- Cap rate 4.3% vs local median 2.4% in Olympia — top-decile yield for the area; either an underpriced asset or a hidden risk that comps aren't pricing in. Stress-test before assuming the spread holds.
Location & tenants
- Location reads 83/100 on livability (#58 in WA, #1,036 nationally) — a professional / high-income tenant draw. Strengths: amenities A+, commute A+, health & safety A+; Watch: crime F, cost of living D-.
- Griffin School District (suburban): math 59% / reading 68% proficiency, ranked #28 of 291 in WA (top 10%) — acceptable for families but not a draw, mixed tenant base, ~2y average lease; only 14% free/reduced lunch — higher-income household profile.
- Zoned schools: Griffin School (577 students, 23% FRL).
- Market conditions: Rents rising (+3.2%/yr); 306 active listings in the ZIP; 1 comparable units currently listed for rent nearby; solid renter incomes; 1,222 units permitted in Thurston County in 2024 (508 in 5+ unit buildings).
Forward outlook
- In year one you build about $38k of equity ($2k loan paydown + $36k appreciation (10.0% local appreciation)).
- Thurston County population projected at +27% by 2050 — long-run rental-demand tailwind backs the buy-and-hold thesis.
- By year 2, paydown + projected appreciation supports a ~$62k cash-out refi (75% LTV) — recoverable capital for the next deal without selling this one.
Negotiation context
- It's been on market 53 days — a 3% lower offer ($349k) is reasonable based on typical stale-listing flexibility.
- Current owner paid $265k; 36% above their basis — modest negotiation headroom, anchor on the comps not their cost.
Questions for the listing agent
- What do current leases actually rent for vs. the listed asking? Can we see a recent rent roll and the last 12 months of T-12 income?
- It's been on market 53 days. Have you received any prior offers? Is the seller open to a 38% concession, seller financing, or rate buy-down credit?
- Built in 1979 — when were the roof, HVAC, electrical panel, plumbing, and water heater last replaced?
- What does the HOA fee cover, when was the last increase, and are there any pending special assessments or reserve-fund shortfalls?
- Is there a deadline driving the sale (1031 exchange, divorce, estate, relocation)? That informs how much negotiation room exists.
- Schools are A-rated — typically a magnet for longer-tenancy family renters. What's the average tenant stay here, and is there a school-zone premium baked into asking?
- Crime grade is F in this area — have there been break-ins, vandalism, or insurance claims at this property in the last 3 years? What carrier currently insures it and at what premium?
- The area grade is low — what's the realistic commute time and amenity access for the typical tenant pool here? Any planned neighborhood developments (good or bad) we should know about?
- What's the average days-on-market for RENTAL listings here right now (not sales)? A rising rental-DOM trend means longer vacancies and softer asking-rent achievability than the comps imply.
- What's the recent tenant-quality profile in this submarket — average credit score on applications, eviction rate, late-payment / NSF rate, and stable-employment percentage? A property-management company in the area should have these aggregated.
- How much new for-sale + rental construction is in the pipeline within 1–3 miles? Heavy new supply typically softens prices + rents 12–24 months out; constrained supply supports both.
Investment metrics
- 1% rule
- 0.62% ✗
- Cap rate
- 4.25%
- Cash-on-cash
- -7.29%
- DSCR
- 0.68
- GRM
- 13.5
CMA / ARV
- ARV (on-the-fly)
- $375,648
- Comps found
- 5
Show comp detail 5 sales within ~0.75 mi
| Address | Dist | Beds/Ba | Sqft | Sold | Price | $/sf | Match |
|---|---|---|---|---|---|---|---|
| 10140 Windward Dr NW | 0.18mi | 2/2.0 | 1,247 (-0%) | 15mo | $523,900 | $420 | 79 |
| 9704 Whitecap Dr NW | 0.32mi | 3/2.0 (+1) | 1,312 (+5%) | 10mo | $395,000 | $301 | 64 |
| 2624 Crestridge Dr NW | 0.37mi | 3/2.0 (+1) | 1,279 (+2%) | 20mo | $353,500 | $276 | 57 |
| 2441 Crestridge Dr NW | 0.42mi | 3/2.0 (+1) | 1,152 (-8%) | 8mo | $329,000 | $286 | 56 |
| 1840 Island Dr NW | 0.33mi | 2/2.0 | 1,152 (-8%) | 19mo | $351,500 | $305 | 56 |
Match score weights: distance 35% · size 25% · config 20% · recency 20%. Top-matched comps best support the ARV.
Projected returns pro-forma
10.0% appreciation · 3.16% rent growth · sell at horizon
- IRR
- 19.2%
- Equity multiple
- 2.56×
- Total profit
- $157,311
- Equity at exit
- $324,226
- IRR
- 17.7%
- Equity multiple
- 5.91×
- Total profit
- $494,582
- Equity at exit
- $699,207
Cash invested: $100,772 (down + closing). Projections, not guarantees.
Landlord ↔ Tenant lean methodology
- Overall (STATE)
- 28 Tenant-Leaning
- State Washington
- 28 Tenant-Leaning · D+8
- County
- — inherits STATE
- City
- — inherits STATE
ZIP-level market 98502
- Home prices YoY
- 1.8%
- Rents YoY
- 3.2%
- Active inventory
- 306
- Price-to-rent
- 13.5×
Monthly cashflow live
- Estimated rent
- $2,217 medium interval (Pro) →
- Mortgage (P&I)
- −$1,887
- Tax from tax record
- −$205 /mo · $2,454/yr
- Insurance
- −$150
- HOA
- −$122
- Vacancy / Maint / Mgmt
- −$466
- Net cashflow
- $-613
Break-even live
Sensitivity live
| Price | -10% $-409 | -5% $-511 | +0% $-613 | +5% $-714 | +10% $-816 |
|---|---|---|---|---|---|
| Rent | -10% $-788 | -5% $-700 | +0% $-613 | +5% $-525 | +10% $-437 |
| Rate | -1.0pp $-431 | -0.5pp $-521 | base $-613 | +0.5pp $-706 | +1.0pp $-801 |
UW: 25.0% down · 7.5% · 30yr · 1.5% tax · 5.0% vac · 8.0% maint · 8.0% mgmt
Financing live
Cash to close
- Down payment
- $89,975
- Closing costs
- $10,797
- Reserves months
- —
- Total cash needed
- —
Loan-product check · same deal, 3 products live
Conventional
25% down · 7.5% · 30yr
- Down + closing
- —
- Monthly P&I
- —
- Monthly cashflow
- —
- DSCR
- —
- Eligible?
- —
Personal DTI + credit; lowest rate.
DSCR
20% down · 8.5% · 30yr
- Down + closing
- —
- Monthly P&I
- —
- Monthly cashflow
- —
- DSCR
- —
- Eligible?
- —
No personal income docs; deal must DSCR.
Hard money
10% down · 12.0% · 12mo
- Down + closing
- —
- Monthly P&I
- —
- Monthly cashflow
- —
- DSCR
- —
- Eligible?
- —
Short-term bridge; refi at stabilization.
Rent comps 1 comps
| Address | Beds | Baths | Sqft | Rent | $/sqft | DOM | Units | Dist |
|---|---|---|---|---|---|---|---|---|
| 9621 Steamboat Island Rd NW Olympia, WA | 2.0 | 2.0 | 1032 | $2,950 | $2.86 | 45d | 1 | 0.42mi |
HOA detail
- Monthly dues
- $122 · $1,464/yr
Listing history 21 events
-
2026-06-22days on market $359,900 Active 53 DOM
-
2026-06-18days on market $359,900 Active 50 DOM
-
2026-06-17price $359,900 Active 49 DOM
-
2026-06-17days on market $364,000 Active 49 DOM
-
2026-06-16days on market $364,000 Active 48 DOM
-
2026-06-15days on market $364,000 Active 47 DOM
-
2026-06-14days on market $364,000 Active 45 DOM
-
2026-06-13days on market $364,000 Active 44 DOM
-
2026-06-10days on market $364,000 Active 42 DOM
-
2026-06-09days on market $364,000 Active 41 DOM
-
2026-06-08days on market $364,000 Active 40 DOM
-
2026-06-07days on market $364,000 Active 39 DOM
-
2026-06-05days on market $364,000 Active 36 DOM
-
2026-06-02days on market $364,000 Active 34 DOM
-
2026-06-01days on market $364,000 Active 33 DOM
-
2026-05-31days on market $364,000 Active 32 DOM
-
2026-05-30days on market $364,000 Active 31 DOM
-
2026-05-21price $364,000
-
2026-04-29$369,000 Active
-
2021-05-21soldstatus $265,000
-
1991-04-03soldstatus $50,000
ⓘ Source: listings_history table (triggers on properties + properties_extension) + one-shot
backfill from property_details.listing_events for pre-trigger history.
Tax reassessment forecast WA · Resets to sale price
- Current annual tax
- $2,454 · $205/mo
- Projected year-2 tax
- $3,527 · $294/mo
- Expected delta
- +$1,073/yr (+$89/mo · 43.7%)
ⓘ Screening estimate from a state-policy table — verify with the county assessor before closing.
Climate risk First Street
- Flood 1/10 Low FEMA zone X (unshaded) · 0% chance over 30 yrs
- Wildfire 1/10 Low
- Heat 3/10 Moderate 7 d/yr ≥88°F today · 14 d/yr by 30 yrs out
- Wind 1/10 Low
- Air quality 6/10 Major 7 unhealthy d/yr today · 7 by 30 yrs out
Nearby sold comps map
Loading sold comps map…
Walkable amenities ~0.75 mi
Loading nearby amenities…
Taxation est. · year 1
- Rental income
- $26,602
- − Mortgage interest
- −$20,160
- − Property taxes
- −$2,454
- − Insurance
- −$1,800
- − Repairs & maintenance
- −$2,128
- − Management
- −$2,128
- − HOA
- −$1,464
- − Depreciation
- −$10,470
- Taxable loss
- −$14,002
- Est. tax savings @ 24.0%
- +$3,361
- After-tax cash flow
- $-3,990/yr
For passive investors: Depreciation is non-cash, so a rental often shows a tax loss while cash-flowing — sheltering income. Rental losses are passive: they offset passive income freely, and up to $25,000/yr can offset ordinary (W-2) income if you actively participate and your MAGI is under $100k (phasing out to $0 by $150k); unused losses carry forward. On sale, claimed depreciation is recaptured at up to 25%, and gains may owe capital-gains tax (a 1031 exchange can defer both). Figures are a year-1 estimate at your 24.0% rate — not tax advice; consult a CPA.
Schools (NCES district)
- District
- Griffin School District
- NCES district ID
- 5303330
- Math proficiency
- 59% ▼ -2.00%
- Reading proficiency
- 68% ▼ -4.00%
- Median HH income
- $80,706
- Composite
- 58.36/100
- National rank
- #2079
- State rank
- #28 of 291 in WA
Livability — Olympia
- Score
- 83/100
- State rank
- #58
- US rank
- #1036
Category grades
Schools grade is shown separately in the Schools card above.
Census & demographics
- County
- Thurston County · 269,345 people
- City population
- 98,428
- Metro
- Olympia-Lacey-Tumwater, WA
- Population (ZIP)
- 35,398
- Household income
- $92,207
- Rent vs Own
- Severe rent burden
- 1811.0
Population outlook (Thurston County) Hauer SSP2
- Today (2025)
- 308,239 people
- By 2030
- 326,483 · +5.9%
- By 2040
- 359,890 · +16.8%
- By 2050
- 391,800 · +27.1%
- By 2075
- 468,024 · +51.8%
- By 2100
- 519,890 · +68.7%
Race, ethnicity, and origin ACS 2023
- Neighborhood character
- Predominantly White (71%)
- Race & ethnicity
- White 71% Two or more races 13% Hispanic / Latino 11% Asian 6% Black 3% Native American 1%
- Hispanic origin (detail)
- Mexican 3% Puerto Rican 4%
- Common ancestry
- Italian 5% Portuguese 4% Iranian 3%
- Foreign-born
- 8% · Vietnam, Canada, China
- Languages at home
- 90% English-only · Spanish 3% Vietnamese 2% Other Asian/Pacific 1%
Political lean MEDSL · Thurston
- 2024 margin
- Strong D (+20.4) · D 58.5% · R 38.1% · Other 3.5%
- 2008→2024 swing
- -1.3pp toward R · 2008: 21.7pp · 2024: 20.4pp
- All cycles
- 2024: D+20.4 2020: D+18.6 2016: D+15.4 2012: D+19.0 2008: D+21.7
Not yet ingested
- Civics
- —
Market trends
- HPI YoY
- ▲ 18.49%
- Current HPI
- 1056.49
- Rent YoY
- ▲ 3.16%
- Metro
- Olympia-Lacey-Tumwater, WA
- State GDP YoY
- ▲ 4.65%
- F500 in state
- 22
Industry mix (Fortune 500 HQ in WA)
| Industry | F500 HQs | Revenue |
|---|---|---|
| Retail | 2 | $269B |
|
||
| Technology / Retail | 1 | $638B |
|
||
| Technology | 1 | $245B |
|
||
| Telecommunications | 1 | $38B |
|
||
| Food / Beverage | 1 | $36B |
|
||
| Automotive / Trucks | 1 | $34B |
|
||
Price history
+628.0% since first listed4 events — show timeline
- 2026-05-21 Price Changed $364,000 NWMLS as Distributed by MLS Grid
- 2026-04-29 Listed $369,000 NWMLS as Distributed by MLS Grid
- 2021-05-21 Sold (Public Records) $265,000 Public Records
- 1991-04-03 Sold (Public Records) $50,000 Public Records
Property tax history
+7.7%/yrLatest (2026): $2,454 · +1.9% YoY. Source: county tax records.
Cash-flow waterfall
monthlySold comps — $/sqft
last 12 mo · ≤1 miLoading sold comps…