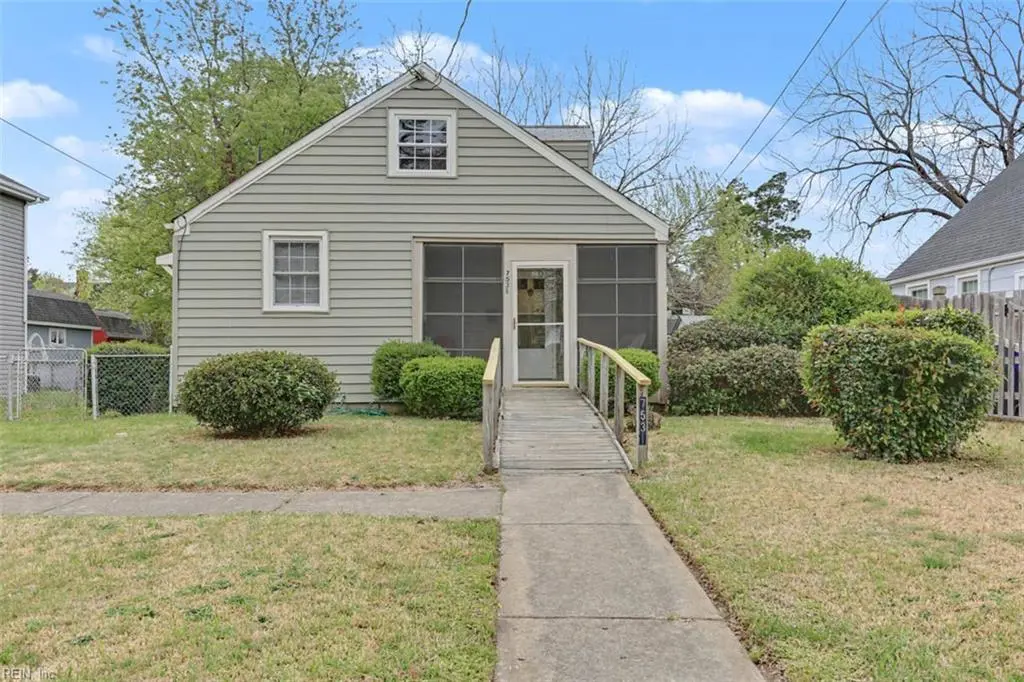
7531 Yorktown Dr · Norfolk, VA
Flood risk 3/10 · Minor
- FEMA flood zone
- X (unshaded)
- Chance of flooding over 30 yrs
- 0.09%
- Est. flood insurance / yr
- $507 – $1,088
Fire risk 1/10 · Minimal
- Est. fire insurance / yr
- $666 – $1,236
Heat risk 9/10 · Severe
- Hot days now (above 104°F)
- 7 days/yr
- Hot days in 30 yrs
- 16 days/yr
Wind risk 8/10 · Major
- Chance of severe wind over 30 yrs
- 80.0%
Air-quality risk 3/10 · Minor
- Unhealthy air days now
- 2 days/yr
- Unhealthy air days in 30 yrs
- 5 days/yr
Risk factors via First Street. Map © Google.
Why this score? — see what drove the D grade
The composite is a weighted blend of 9 inputs, each scored 0–100. Each bar is that input's sub-score; the figure is the points it added to the 100-point composite (weight × sub-score).
- ARV discount +15.0/15.0
- Cash flow +9.5/30.0
- Rent growth +5.0/5.0
- Livability +4.2/5.0
- Schools +3.5/10.0
- DSCR +2.7/10.0
- Condition / age +2.5/5.0
- 1% rule +2.4/10.0
- Appreciation +0.0/10.0
$210,000
🖨 Deal sheet (PDF) 📄 Offer letter ✓ Due diligence
Listing remarks
Charming 2-bedroom, 1-bath Cape Cod offering an excellent opportunity for the right buyer to renovate and make it their own. With solid potential and room for improvement, this home is well-suited for an owner-occupant who wants to complete renovations right away or update the property over time while building equity. It also presents a great opportunity for investors ready to reimagine the space and unlock its full potential. A welcoming enclosed sun porch adds valuable bonus space and versatility. The home also features additional upstairs space that could be used for storage or potentially expanded into more finished living area, offering flexibility for future improvements. Outside, the
Key facts
- Spacious backyard
- Near beaches
- Storage shed
Tags
Property features AI
Finance
- HOA & community: No HOA fees indicated
Exterior
- Parking: Off-street parking; Driveway spaces; Street parking; 1 parking space listed
- Utilities: City/County water; City/County sewer; Gas water heater
- Home design: Detached property; Bungalow/Cape Cod style; 2 stories; One living level described; Crawl foundation
- Construction: Asphalt shingle roof
- Exterior features: Vinyl siding; Back privacy fence with chain link; Storage shed; City view
Interior
- Kitchen: Gas range; Microwave; Refrigerator
- Bedrooms: Master bedroom; Additional bedroom; Bedroom and full bathroom on first floor
- Flooring: Carpet; Ceramic
- Bathrooms: 1 full bathroom
- Heating & cooling: Natural gas heating; Central air conditioning; Gas water heater
- Interior features: Cable hookup; Ceiling fans; Screened porch; Sun room; Assigned storage; Handicap access; Level flooring; Main-floor laundry; Ramp; Storm doors
- Laundry & utility: Washer; Dryer; Utility room
Neighborhood map
What this means for you Summary
Snapshot
- This is a 2-bed/1.0-bath single-family listed at $210k.
Deal economics
- At list price, monthly cash flow is $-147 ($-2k/yr) — negative.
- To cash-flow at today's rent, offer at most $184k (12.3% below list).
- To meet the 1% rule (rent ≥ 1% of price), the offer needs to be $156k (25.9% below list).
- Recommended offer: $156k (25.9% below list) — sets the bar for 1% rule.
- Cap rate 5.5% vs local median 4.0% in Norfolk — top-decile yield for the area; either an underpriced asset or a hidden risk that comps aren't pricing in. Stress-test before assuming the spread holds.
Location & tenants
- Location reads 83/100 on livability (#43 in VA, #1,026 nationally) — a professional / high-income tenant draw. Strengths: amenities A+, commute A+, health & safety A+; Watch: employment C-, crime F.
- Norfolk City Public School District (urban): math 27% / reading 56% proficiency, ranked #118 of 131 in VA (top 90%) — families likely to look elsewhere, expect single-tenant / working-renter base with shorter leases.
- Zoned schools: Suburban Park Elementary (math 22% / reading 37%, grade F, #1,011 of 1,108 statewide, top 92%, 452 students, 98% FRL); Northside Middle (math 25% / reading 58%, grade F, #299 of 342 statewide, top 88%, 763 students, 92% FRL); Granby High (math 33% / reading 80%, grade C, #270 of 319 statewide, top 86%, 1,837 students, 94% FRL) — zoned schools average 95% FRL vs 59% district-wide (36 pts higher); higher-poverty schools than district average — tighter screening recommended.
- Market conditions: Rents rising fast (+12.1%/yr); 108 active listings in the ZIP; 33 comparable units currently listed for rent nearby; rentals at typical pace (median 26d on market — plan ~3-4 weeks tenant-placement turnaround); 438 units permitted in Norfolk city in 2024 (273 in 5+ unit buildings).
- This rent runs 32% of the median local income ($59k/yr) — at the standard rent-burdened threshold; future hikes will face affordability resistance.
Forward outlook
- Local home prices are declining (-3.0%/yr); year-one equity from $1k of loan paydown is wiped out by about $6k of value loss. Plan a longer hold.
Negotiation context
- It's been on market 43 days — a 3% lower offer ($204k) is reasonable based on typical stale-listing flexibility.
- 2 sale attempts with the ask held roughly flat each time — persistent listings suggest the price (not the market) is what's stuck; bring a comps-based counter.
Risks & watch-outs
- Watch-outs: built in 1942 — expect roof / HVAC / electrical / plumbing capex.
- Climate carrying-cost: severe wind risk, 80% chance of damaging wind over 30y; extreme-heat days projected 7→16/yr by 2055 (HVAC capex compounding) — expect insurance premiums to compound above CPI over the hold.
Questions for the listing agent
- What do current leases actually rent for vs. the listed asking? Can we see a recent rent roll and the last 12 months of T-12 income?
- It's been on market 43 days. Have you received any prior offers? Is the seller open to a 26% concession, seller financing, or rate buy-down credit?
- Built in 1942 — when were the roof, HVAC, electrical panel, plumbing, and water heater last replaced?
- Is there a deadline driving the sale (1031 exchange, divorce, estate, relocation)? That informs how much negotiation room exists.
- Schools are A-rated — typically a magnet for longer-tenancy family renters. What's the average tenant stay here, and is there a school-zone premium baked into asking?
- Crime grade is F in this area — have there been break-ins, vandalism, or insurance claims at this property in the last 3 years? What carrier currently insures it and at what premium?
- The area grade is low — what's the realistic commute time and amenity access for the typical tenant pool here? Any planned neighborhood developments (good or bad) we should know about?
- What's the average days-on-market for RENTAL listings here right now (not sales)? A rising rental-DOM trend means longer vacancies and softer asking-rent achievability than the comps imply.
- What's the recent tenant-quality profile in this submarket — average credit score on applications, eviction rate, late-payment / NSF rate, and stable-employment percentage? A property-management company in the area should have these aggregated.
- How much new for-sale + rental construction is in the pipeline within 1–3 miles? Heavy new supply typically softens prices + rents 12–24 months out; constrained supply supports both.
Investment metrics
- 1% rule
- 0.74% ✗
- Cap rate
- 5.46%
- Cash-on-cash
- -2.99%
- DSCR
- 0.87
- GRM
- 11.2
CMA / ARV
- ARV (median comp)
- $264,078
- List price
- $210,000
- Delta
- -20.48%
- Verdict
- UNDERPRICED
- Comps
- 20 within 1.0 mi
Show comp detail 12 sales within ~0.75 mi
| Address | Dist | Beds/Ba | Sqft | Sold | Price | $/sf | Match |
|---|---|---|---|---|---|---|---|
| 403 Draper Dr | 0.40mi | 3/1.0 (+1) | 1,080 (+1%) | 6mo | $160,000 | $148 | 70 |
| 7535 Yorktown Dr | 0.02mi | 3/2.0 (+1) | 1,200 (+12%) | 7mo | $275,000 | $229 | 64 |
| 7310 Woodfin Ave | 0.25mi | 3/1.5 (+1) | 1,200 (+12%) | 8mo | $300,000 | $250 | 54 |
| 410 N Shore Rd | 0.63mi | 3/1.0 (+1) | 1,000 (-6%) | 2mo | $273,000 | $273 | 54 |
| 215 Burleigh Ave | 0.41mi | 2/1.0 | 923 (-14%) | 6mo | $259,900 | $282 | 53 |
| 7920 E Glen Rd | 0.63mi | 3/2.0 (+1) | 1,100 (+3%) | 6mo | $235,000 | $214 | 51 |
| 516 Gladstone Rd | 0.60mi | 3/1.0 (+1) | 1,000 (-6%) | 8mo | $250,000 | $250 | 49 |
| 228 Forsythe St | 0.52mi | 3/1.0 (+1) | 934 (-12%) | 1mo | $175,000 | $187 | 49 |
| 317 Naval Base Rd | 0.24mi | 3/3.0 (+1) | 1,222 (+14%) | 5mo | $305,000 | $250 | 48 |
| 512 Gladstone Rd | 0.59mi | 2/1.0 | 911 (-15%) | 4mo | $255,000 | $280 | 45 |
| 419 Maycox Ave | 0.66mi | 3/2.0 (+1) | 1,004 (-6%) | 7mo | $260,000 | $259 | 44 |
| 445 Munden Ave | 0.54mi | 3/2.0 (+1) | 1,200 (+12%) | 4mo | $282,600 | $236 | 42 |
Match score weights: distance 35% · size 25% · config 20% · recency 20%. Top-matched comps best support the ARV.
Projected returns pro-forma
-3.0% appreciation · 8.0% rent growth · sell at horizon
- IRR
- -16.2%
- Equity multiple
- 0.40×
- Total profit
- $-35,165
- Equity at exit
- $31,312
- IRR
- -1.1%
- Equity multiple
- 0.91×
- Total profit
- $-5,308
- Equity at exit
- $18,157
Cash invested: $58,800 (down + closing). Projections, not guarantees.
Landlord ↔ Tenant lean methodology
- Overall (STATE)
- 55 Moderately Landlord-Leaning
- State Virginia
- 55 Moderately Landlord-Leaning · D+2
- County
- — inherits STATE
- City
- — inherits STATE
ZIP-level market 23505
- Home prices YoY
- -19.6%
- Rents YoY
- 12.1%
- Active inventory
- 108
- Price-to-rent
- 11.2×
Monthly cashflow live
- Estimated rent
- $1,556 high interval (Pro) →
- Mortgage (P&I)
- −$1,101
- Tax from tax record
- −$187 /mo · $2,246/yr
- Insurance
- −$88
- HOA
- −$0
- Vacancy / Maint / Mgmt
- −$327
- Net cashflow
- $-147
Break-even live
Sensitivity live
| Price | -10% $-28 | -5% $-87 | +0% $-147 | +5% $-206 | +10% $-265 |
|---|---|---|---|---|---|
| Rent | -10% $-270 | -5% $-208 | +0% $-147 | +5% $-85 | +10% $-24 |
| Rate | -1.0pp $-41 | -0.5pp $-93 | base $-147 | +0.5pp $-201 | +1.0pp $-256 |
UW: 25.0% down · 7.5% · 30yr · 1.5% tax · 5.0% vac · 8.0% maint · 8.0% mgmt
Financing live
Cash to close
- Down payment
- $52,500
- Closing costs
- $6,300
- Reserves months
- —
- Total cash needed
- —
Loan-product check · same deal, 3 products live
Conventional
25% down · 7.5% · 30yr
- Down + closing
- —
- Monthly P&I
- —
- Monthly cashflow
- —
- DSCR
- —
- Eligible?
- —
Personal DTI + credit; lowest rate.
DSCR
20% down · 8.5% · 30yr
- Down + closing
- —
- Monthly P&I
- —
- Monthly cashflow
- —
- DSCR
- —
- Eligible?
- —
No personal income docs; deal must DSCR.
Hard money
10% down · 12.0% · 12mo
- Down + closing
- —
- Monthly P&I
- —
- Monthly cashflow
- —
- DSCR
- —
- Eligible?
- —
Short-term bridge; refi at stabilization.
Rent comps 33 comps
| Address | Beds | Baths | Sqft | Rent | $/sqft | DOM | Units | Dist |
|---|---|---|---|---|---|---|---|---|
| 310 Naval Base Rd Norfolk, VA | 3.0 | 1.0 | 1000 | $1,850 | $1.85 | 25d | 1 | 0.21mi |
| 311 Ashlawn Dr Unit 3 Norfolk, VA | 2.0 | 1.0 | 800 | $1,195 | $1.49 | 46d | 1 | 0.42mi |
| 218 Granby Park Dr Unit B Norfolk, VA | 3.0 | 1.0 | 1330 | $1,745 | $1.31 | 14d | 1 | 0.42mi |
| 218 Granby Park Dr Unit B Norfolk, VA | 3.0 | 1.0 | 1330 | $1,695 | $1.27 | 4d | 1 | 0.42mi |
| 218 Granby Park Dr Unit B Norfolk, VA | 3.0 | 1.0 | 1330 | $1,795 | $1.35 | 5d | 1 | 0.42mi |
| 312 Ashlawn Dr Norfolk, VA | 2.0 | 1.0 | 720 | $1,200 | $1.67 | 45d | 1 | 0.44mi |
| 307 W Little Creek Rd Unit C Norfolk, VA | 2.0 | 1.0 | 830 | $1,395 | $1.68 | 12d | 1 | 0.49mi |
| 440 San Antonio Blvd Norfolk, VA | 2.0 | 1.0 | 800 | $1,535 | $1.92 | 25d | 1 | 0.49mi |
| 408 E Little Creek Rd Norfolk, VA | 3.0 | 2.0 | 1224 | $2,200 | $1.80 | 45d | 1 | 0.54mi |
| 417 E Little Creek Rd Apt 4 Norfolk, VA | 2.0 | 1.0 | 700 | $1,050 | $1.50 | 9d | 1 | 0.55mi |
| 507 Ashlawn Dr Norfolk, VA | 2.0 | 1.0 | 750 | $1,395 | $1.86 | 45d | 1 | 0.66mi |
| 7474 Pennington Rd Unit 7474 Norfolk, VA | 2.0 | 1.0 | 1000 | $1,525 | $1.52 | 3d | 1 | 0.67mi |
| 504 Ashlawn Dr Unit 2 Norfolk, VA | 2.0 | 1.0 | 725 | $1,250 | $1.72 | 25d | 1 | 0.67mi |
| 504 Ashlawn Dr Norfolk, VA | 2.0 | 1.0 | 725 | $1,250 | $1.72 | 23d | 1 | 0.67mi |
| 508 Ashlawn Dr Unit 2 Norfolk, VA | 2.0 | 1.0 | 725 | $1,250 | $1.72 | 23d | 1 | 0.68mi |
| 502 Grantham Rd Norfolk, VA | 1.0–2.0 | 1.0 | 740 | $1,128 | $1.52 | 45d | 3 | 0.77mi |
| 7433 Fenner St Norfolk, VA | 1.0–2.0 | 1.0 | 715 | $1,399 | $1.96 | 16d | 7 | 0.83mi |
| 715 Easy St Unit 2 Norfolk, VA | 2.0 | 1.0 | 750 | $1,200 | $1.60 | 16d | 1 | 0.83mi |
| 7465 Fenner St Unit 7468-2-A8 Norfolk, VA | 2.0 | 1.0 | 900 | $1,399 | $1.55 | 22d | 1 | 0.86mi |
| 7996 Diggs Rd Unit D Norfolk, VA | 3.0 | 2.0 | 950 | $1,375 | $1.45 | 45d | 1 | 0.86mi |
| 7427 Tyndale Ct Unit 1 Norfolk, VA | 2.0 | 1.0 | 786 | $995 | $1.27 | 45d | 1 | 0.89mi |
| 7730 Ruthven Rd Norfolk, VA | 3.0 | 1.0 | 1056 | $1,750 | $1.66 | 25d | 1 | 0.99mi |
| 7922 Old Ocean View Rd Norfolk, VA | 1.0–3.0 | 1.0–1.5 | 890 | $1,250 | $1.40 | 3d | 3 | 1.01mi |
| 8231 Andrew Ln Norfolk, VA | 3.0 | 1.0 | 720 | $1,800 | $2.50 | 25d | 1 | 1.03mi |
| 609 Summers Dr Norfolk, VA | 3.0 | 1.0 | 998 | $1,995 | $2.00 | 5d | 1 | 1.09mi |
| 837 Tifton St Norfolk, VA | 3.0 | 2.0 | 1072 | $2,300 | $2.15 | 25d | 1 | 1.11mi |
| 7872 Ogden Ave Norfolk, VA | 1.0–3.0 | 1.0–2.0 | 963 | $1,285 | $1.33 | 45d | 1 | 1.12mi |
| 869 Bancker Rd Norfolk, VA | 2.0 | 1.0–1.5 | 910 | $1,142 | $1.26 | 45d | 1 | 1.20mi |
| 7128 Gregory Dr Norfolk, VA | 2.0 | 1.0 | 720 | $1,800 | $2.50 | 45d | 1 | 1.35mi |
| 7108 Gregory Dr Norfolk, VA | 2.0 | 1.0 | 720 | $1,400 | $1.94 | 45d | 1 | 1.39mi |
| 1111 Charleston St Norfolk, VA | 2.0 | 1.0 | 822 | $1,425 | $1.73 | 45d | 1 | 1.40mi |
| 756 Norman Ave Norfolk, VA | 3.0 | 1.0 | 1500 | $1,875 | $1.25 | 23d | 1 | 1.40mi |
| 739 Waukesha Ave Norfolk, VA | 2.0 | 1.0 | 860 | $1,800 | $2.09 | 25d | 1 | 1.47mi |
Listing history 17 events
-
2026-06-21days on market $210,000 Active 43 DOM
-
2026-06-18days on market $210,000 Active 40 DOM
-
2026-06-17days on market $210,000 Active 39 DOM
-
2026-06-16days on market $210,000 Active 38 DOM
-
2026-06-15days on market $210,000 Active 37 DOM
-
2026-06-13days on market $210,000 Active 35 DOM
-
2026-06-09days on market $210,000 Active 31 DOM
-
2026-06-08days on market $210,000 Active 30 DOM
-
2026-06-07days on market $210,000 Active 29 DOM
-
2026-06-03days on market $210,000 Active 25 DOM
-
2026-06-02days on market $210,000 Active 24 DOM
-
2026-06-01days on market $210,000 Active 23 DOM
-
2026-05-31days on market $210,000 Active 22 DOM
-
2026-05-09historical
-
2026-05-09$210,000 Active 984-char remark
-
2026-04-08price $224,900
-
2026-03-07$235,000 Active
ⓘ Source: listings_history table (triggers on properties + properties_extension) + one-shot
backfill from property_details.listing_events for pre-trigger history.
Tax reassessment forecast VA · Resets to sale price
- Current annual tax
- $2,246 · $187/mo
- Projected year-2 tax
- $2,246 · $187/mo
- Expected delta
- $0/yr ($0/mo · 0.0%)
ⓘ Screening estimate from a state-policy table — verify with the county assessor before closing.
Climate risk First Street
- Flood 3/10 Moderate FEMA zone X (unshaded) · 9% chance over 30 yrs
- Wildfire 1/10 Low
- Heat 9/10 Extreme 7 d/yr ≥104°F today · 16 d/yr by 30 yrs out
- Wind 8/10 Severe 80% chance of damaging wind over 30 yrs
- Air quality 3/10 Moderate 2 unhealthy d/yr today · 5 by 30 yrs out
Nearby sold comps map
Loading sold comps map…
Walkable amenities ~0.75 mi
Loading nearby amenities…
Taxation est. · year 1
- Rental income
- $18,673
- − Mortgage interest
- −$11,763
- − Property taxes
- −$2,246
- − Insurance
- −$1,050
- − Repairs & maintenance
- −$1,494
- − Management
- −$1,494
- − Depreciation
- −$6,109
- Taxable loss
- −$5,483
- Est. tax savings @ 24.0%
- +$1,316
- After-tax cash flow
- $-443/yr
For passive investors: Depreciation is non-cash, so a rental often shows a tax loss while cash-flowing — sheltering income. Rental losses are passive: they offset passive income freely, and up to $25,000/yr can offset ordinary (W-2) income if you actively participate and your MAGI is under $100k (phasing out to $0 by $150k); unused losses carry forward. On sale, claimed depreciation is recaptured at up to 25%, and gains may owe capital-gains tax (a 1031 exchange can defer both). Figures are a year-1 estimate at your 24.0% rate — not tax advice; consult a CPA.
Schools (NCES district)
- District
- Norfolk City Public School District
- NCES district ID
- 5102670
- Math proficiency
- 27% ▼ -44.00%
- Reading proficiency
- 56% ▼ -10.00%
- Median HH income
- $44,358
- Composite
- 35.08/100
- National rank
- #5026
- State rank
- #118 of 131 in VA
Livability — Norfolk
- Score
- 83/100
- State rank
- #43
- US rank
- #1026
Category grades
Schools grade is shown separately in the Schools card above.
Census & demographics
- Census place
- Norfolk, VA
- County
- Norfolk City · 214,042 people
- City population
- 214,042
- Metro
- Virginia Beach-Norfolk-Newport News, VA-NC
- Population (ZIP)
- 28,247
- Household income
- $58,579
- Rent vs Own
- Severe rent burden
- 2299.0
Population outlook (Norfolk County) Hauer SSP2
- Today (2025)
- 249,032 people
- By 2030
- 252,347 · +1.3%
- By 2040
- 253,644 · +1.9%
- By 2050
- 251,913 · +1.2%
- By 2075
- 245,281 · -1.5%
- By 2100
- 219,548 · -11.8%
Race, ethnicity, and origin ACS 2023
- Neighborhood character
- Diverse neighborhood (Simpson 0.67)
- Race & ethnicity
- White 44% Black 34% Hispanic / Latino 12% Two or more races 8% Asian 4%
- Hispanic origin (detail)
- Mexican 4% Puerto Rican 3%
- Common ancestry
- Romanian 2% Slovak 2% Italian 2%
- Foreign-born
- 9% · Canada, United Kingdom, South Korea
- Languages at home
- 87% English-only · Spanish 6% Tagalog/Filipino 1% French/Haitian/Cajun 1%
Political lean MEDSL · Norfolk
- 2024 margin
- Solid D (+41.5) · D 70.0% · R 28.5% · Other 1.6%
- 2008→2024 swing
- -1.4pp toward R · 2008: 43.0pp · 2024: 41.5pp
- All cycles
- 2024: D+41.5 2020: D+45.6 2016: D+42.0 2012: D+44.0 2008: D+43.0
Not yet ingested
- Civics
- —
Market trends
- HPI YoY
- ▼ -71.86%
- Current HPI
- 294.9807
- Rent YoY
- ▲ 12.08%
- Metro
- Virginia Beach-Norfolk-Newport News, VA-NC
- State GDP YoY
- ▲ 2.40%
- F500 in state
- 50
Industry mix (Fortune 500 HQ in VA)
| Industry | F500 HQs | Revenue |
|---|---|---|
| Aerospace / Defense | 4 | $236B |
|
||
| Technology / Defense | 3 | $32B |
|
||
| Financial Services | 2 | $176B |
|
||
| Utilities | 2 | $27B |
|
||
| Insurance | 2 | $25B |
|
||
| Technology | 2 | $15B |
|
||
Price history
-10.6% since first listed4 events — show timeline
- 2026-05-09 Listed $210,000 REINMLS
- 2026-05-09 Listing Removed — REINMLS
- 2026-04-08 Price Changed $224,900 REINMLS
- 2026-03-07 Listed $235,000 REINMLS
Property tax history
+4.1%/yrLatest (2025): $2,246 · +8.7% YoY. Source: county tax records.
Cash-flow waterfall
monthlySold comps — $/sqft
last 12 mo · ≤1 miLoading sold comps…