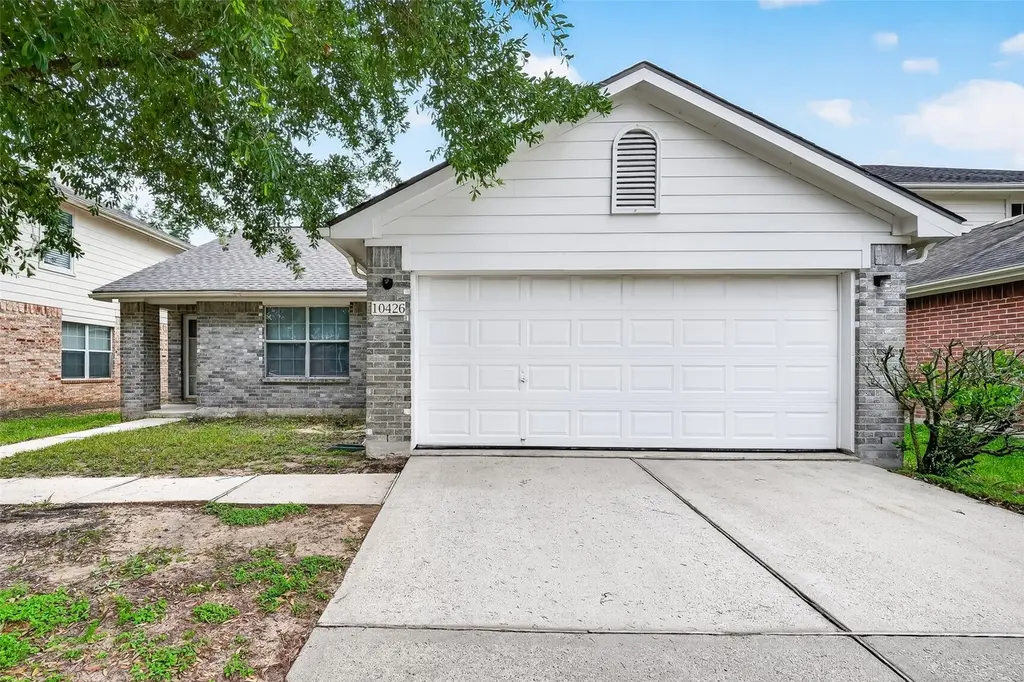
10426 Briar Patch St · Baytown, TX
Flood risk 1/10 · Minimal
- FEMA flood zone
- X (unshaded)
- Chance of flooding over 30 yrs
- 0.0%
- Est. flood insurance / yr
- $507 – $1,088
Fire risk 5/10 · Moderate
- Est. fire insurance / yr
- $1,222 – $2,270
Heat risk 9/10 · Severe
- Hot days now (above 111°F)
- 7 days/yr
- Hot days in 30 yrs
- 25 days/yr
Wind risk 9/10 · Severe
- Chance of severe wind over 30 yrs
- 99.0%
Air-quality risk 2/10 · Minimal
- Unhealthy air days now
- 1 days/yr
- Unhealthy air days in 30 yrs
- 1 days/yr
Risk factors via First Street. Map © Google.
Why this score? — see what drove the C- grade
The composite is a weighted blend of 9 inputs, each scored 0–100. Each bar is that input's sub-score; the figure is the points it added to the 100-point composite (weight × sub-score).
- Cash flow +17.6/30.0
- ARV discount +10.1/15.0
- DSCR +5.5/10.0
- 1% rule +5.3/10.0
- Livability +3.5/5.0
- Rent growth +3.4/5.0
- Schools +3.2/10.0
- Condition / age +2.5/5.0
- Appreciation +0.0/10.0
$229,000
🖨 Deal sheet 📄 Offer letter ✓ Due diligence
Listing remarks
located near booming area (Walmart, restaurants, shopping) - cute 3/2/2 with ceramic tile throughout - eat-in kitchen is open to spacious living area - indoor utility plus fenced backyard
Key facts
- Spacious living area
- Eat-in kitchen
- Ceramic tile
Tags
Property features AI
Finance
- HOA & community: Community association (Spectrum) with $300 annual fee
Exterior
- Parking: Attached 2-car garage
- Utilities: Public water; Public sewer
- Home design: Residential property; Faces north; Single-story entry (all main rooms listed on first floor)
- Construction: Built in 2004; Brick and cement siding exterior; Composition roof; Slab foundation
- Exterior features: Subdivision
Interior
- Kitchen: Dishwasher; Electric oven; Electric range; Microwave; Oven
- Bedrooms: Primary bedroom on the first floor (15x13); Bedroom on the first floor (11x13); Bedroom on the first floor (11x12)
- Flooring: Tile
- Bathrooms: 2 full bathrooms
- Heating & cooling: Central heating (electric); Central air conditioning (electric)
- Interior features: Kitchen/family room combo; Kitchen/dining combo; Tub with shower
- Laundry & utility: Washer hookup; Electric dryer hookup
Neighborhood map
What this means for you Summary
Snapshot
- This is a 3-bed/2.0-bath single-family listed at $229k.
Deal economics
- At list price, monthly cash flow is $180 ($2k/yr) — positive.
- The deal already cash-flows at list — no discount required.
- Meets the 1% rule at list price ($2k rent vs $229k).
- Recommended offer: $226k (1.5% below list) — sets the bar for market timing.
- Cap rate 7.2% vs local median 4.2% in Baytown — top-decile yield for the area; either an underpriced asset or a hidden risk that comps aren't pricing in. Stress-test before assuming the spread holds.
Location & tenants
- Location reads 69/100 on livability (#412 in TX) — a middle-class / working-renter tenant base. Strengths: cost of living A+, housing A+; Watch: employment D+, crime F, amenities F.
- Goose Creek CISD (urban): math 37% / reading 36% proficiency, ranked #473 of 826 in TX (top 57%) — families likely to look elsewhere, expect single-tenant / working-renter base with shorter leases; 61% free/reduced lunch — lower-income household profile, screen leases tightly.
- Zoned schools: E F Green Junior School (1,020 students, 67% FRL); High Point School (12 students, 75% FRL).
- Market conditions: Rents rising (+3.4%/yr); 776 active listings in the ZIP; 4 comparable units currently listed for rent nearby; rentals leasing fast (median 1d on market — plan ~1-2 weeks tenant-placement turnaround); high-income renter base; 629 units permitted in Chambers County in 2024 (0 in 5+ unit buildings).
Forward outlook
- Local home prices are declining (-3.0%/yr); year-one equity from $2k of loan paydown is wiped out by about $7k of value loss. Plan a longer hold.
- Chambers County population projected at +46% by 2050 — long-run rental-demand tailwind backs the buy-and-hold thesis.
Negotiation context
- It's been on market 30 days — a 2% lower offer ($226k) is reasonable based on typical stale-listing flexibility.
Risks & watch-outs
- Climate carrying-cost: severe wind risk, 99% chance of damaging wind over 30y; moderate wildfire risk; extreme-heat days projected 7→25/yr by 2055 (HVAC capex compounding) — expect insurance premiums to compound above CPI over the hold.
Questions for the listing agent
- What does the HOA fee cover, when was the last increase, and are there any pending special assessments or reserve-fund shortfalls?
- Is there a deadline driving the sale (1031 exchange, divorce, estate, relocation)? That informs how much negotiation room exists.
- Schools are D-rated, which usually means shorter tenancies and higher turnover. Who's the typical renter profile here, and what's been the actual vacancy rate?
- Crime grade is F in this area — have there been break-ins, vandalism, or insurance claims at this property in the last 3 years? What carrier currently insures it and at what premium?
- What's the average days-on-market for RENTAL listings here right now (not sales)? A rising rental-DOM trend means longer vacancies and softer asking-rent achievability than the comps imply.
- What's the recent tenant-quality profile in this submarket — average credit score on applications, eviction rate, late-payment / NSF rate, and stable-employment percentage? A property-management company in the area should have these aggregated.
- How much new for-sale + rental construction is in the pipeline within 1–3 miles? Heavy new supply typically softens prices + rents 12–24 months out; constrained supply supports both.
Investment metrics
- 1% rule
- 1.03% ✓
- Cap rate
- 7.24%
- Cash-on-cash
- 3.38%
- DSCR
- 1.15
- GRM
- 8.1
CMA / ARV
- ARV (on-the-fly)
- $242,904
- Comps found
- 12
Show comp detail 12 sales within ~0.75 mi
| Address | Dist | Beds/Ba | Sqft | Sold | Price | $/sf | Match |
|---|---|---|---|---|---|---|---|
| 1722 Maryon St | 0.15mi | 3/2.0 | 1,352 (-3%) | 3mo | $220,000 | $163 | 85 |
| 9206 Burch Eagle Ct | 0.27mi | 3/2.0 | 1,451 (+4%) | 0mo | $255,990 | $176 | 80 |
| 1703 Sterling Dr | 0.23mi | 2/1.0 (-1) | 1,454 (+4%) | 8mo | $224,500 | $154 | 67 |
| 8311 White Willow Ln | 0.47mi | 3/2.0 | 1,494 (+7%) | 10mo | $254,000 | $170 | 58 |
| 8227 Sugar Cane Dr | 0.43mi | 3/2.0 | 1,465 (+5%) | 17mo | $255,000 | $174 | 58 |
| 2310 Brickfielder Ln | 0.41mi | 3/2.0 | 1,590 (+14%) | 11mo | $284,900 | $179 | 48 |
| 2314 Gentle Breeze Ln | 0.55mi | 3/2.0 | 1,523 (+9%) | 16mo | $266,990 | $175 | 46 |
| 8318 Sand Plum Ln | 0.52mi | 3/2.0 | 1,574 (+13%) | 17mo | $254,900 | $162 | 40 |
| 10010 Pine Valley Ct | 0.59mi | 4/2.0 (+1) | 1,604 (+15%) | 3mo | $255,000 | $159 | 40 |
| 2519 Solano Ln | 0.74mi | 3/2.0 | 1,584 (+14%) | 12mo | $284,929 | $180 | 33 |
| 2535 Windstream Ln | 0.75mi | 3/2.0 | 1,584 (+14%) | 16mo | $267,502 | $169 | 30 |
| 7638 Fremantle Ln | 0.62mi | 3/2.0 | 1,584 (+14%) | 24mo | $308,577 | $195 | 29 |
Match score weights: distance 35% · size 25% · config 20% · recency 20%. Top-matched comps best support the ARV.
Projected returns pro-forma
-3.0% appreciation · 3.42% rent growth · sell at horizon
- IRR
- -10.4%
- Equity multiple
- 0.62×
- Total profit
- $-24,519
- Equity at exit
- $34,145
- IRR
- -0.4%
- Equity multiple
- 0.97×
- Total profit
- $-2,024
- Equity at exit
- $19,800
Cash invested: $64,120 (down + closing). Projections, not guarantees.
Landlord ↔ Tenant lean methodology
- Overall (STATE)
- 87 Strongly Landlord-Friendly
- State Texas
- 87 Strongly Landlord-Friendly · R+5
- County
- — inherits STATE
- City
- — inherits STATE
ZIP-level market 77523
- Home prices YoY
- -31.5%
- Rents YoY
- 3.4%
- Active inventory
- 776
- Price-to-rent
- 8.1×
Monthly cashflow live
- Estimated rent
- $2,356 medium interval (Pro) →
- Mortgage (P&I)
- −$1,201
- Tax from tax record
- −$359 /mo · $4,311/yr
- Insurance
- −$95
- HOA
- −$25
- Vacancy / Maint / Mgmt
- −$495
- Net cashflow
- $180
Break-even live
UW: 25.0% down · 7.5% · 30yr · 1.5% tax · 5.0% vac · 8.0% maint · 8.0% mgmt
Financing live
Cash to close
- Down payment
- $57,250
- Closing costs
- $6,870
- Reserves months
- —
- Total cash needed
- —
Loan-product check · same deal, 3 products live
Conventional
25% down · 7.5% · 30yr
- Down + closing
- —
- Monthly P&I
- —
- Monthly cashflow
- —
- DSCR
- —
- Eligible?
- —
Personal DTI + credit; lowest rate.
DSCR
20% down · 8.5% · 30yr
- Down + closing
- —
- Monthly P&I
- —
- Monthly cashflow
- —
- DSCR
- —
- Eligible?
- —
No personal income docs; deal must DSCR.
Hard money
10% down · 12.0% · 12mo
- Down + closing
- —
- Monthly P&I
- —
- Monthly cashflow
- —
- DSCR
- —
- Eligible?
- —
Short-term bridge; refi at stabilization.
Rent comps 4 comps
| Address | Beds | Baths | Sqft | Rent | $/sqft | DOM | Units | Dist |
|---|---|---|---|---|---|---|---|---|
| 1716 Sterling Dr Baytown, TX | 3.0 | 2.0 | 1371 | $2,250 | $1.64 | 43d | 1 | 0.23mi |
| 1900 Kilgore Pkwy Baytown, TX | 1.0–2.0 | 1.0–2.0 | 918 | $1,956 | $2.13 | 1d | 17 | 0.31mi |
| 2100 Kilgore Pkwy Baytown, TX | 1.0–2.0 | 1.0–2.0 | 920 | $1,964 | $2.13 | 1d | 13 | 0.37mi |
| 10235 Cedar Crossing St Baytown, TX | 1.0–3.0 | 1.0–2.0 | 1097 | $2,506 | $2.28 | 1d | 27 | 0.87mi |
HOA detail
- Monthly dues
- $25 · $300/yr
Listing history 14 events
-
2026-06-18days on market $229,000 Active 30 DOM
-
2026-06-17days on market $229,000 Active 29 DOM
-
2026-06-16days on market $229,000 Active 28 DOM
-
2026-06-15days on market $229,000 Active 27 DOM
-
2026-06-13days on market $229,000 Active 25 DOM
-
2026-06-09days on market $229,000 Active 21 DOM
-
2026-06-07days on market $229,000 Active 19 DOM
-
2026-06-04days on market $229,000 Active 16 DOM
-
2026-06-03days on market $229,000 Active 15 DOM
-
2026-06-02days on market $229,000 Active 14 DOM
-
2026-06-01days on market $229,000 Active 13 DOM
-
2026-05-31days on market $229,000 Active 12 DOM
-
2026-05-19$229,000 Active
-
2017-05-30soldstatus
ⓘ Source: listings_history table (triggers on properties + properties_extension) + one-shot
backfill from property_details.listing_events for pre-trigger history.
Tax reassessment forecast TX · Resets to sale price
- Current annual tax
- $4,311 · $359/mo
- Projected year-2 tax
- $4,311 · $359/mo
- Expected delta
- $0/yr ($0/mo · 0.0%)
ⓘ Screening estimate from a state-policy table — verify with the county assessor before closing.
Climate risk First Street
- Flood 1/10 Low FEMA zone X (unshaded) · 0% chance over 30 yrs
- Wildfire 5/10 Major
- Heat 9/10 Extreme 7 d/yr ≥111°F today · 25 d/yr by 30 yrs out
- Wind 9/10 Extreme 99% chance of damaging wind over 30 yrs
- Air quality 2/10 Low 1 unhealthy d/yr today · 1 by 30 yrs out
Nearby sold comps map
Loading sold comps map…
Walkable amenities ~0.75 mi
Loading nearby amenities…
Taxation est. · year 1
- Rental income
- $28,269
- − Mortgage interest
- −$12,828
- − Property taxes
- −$4,311
- − Insurance
- −$1,145
- − Repairs & maintenance
- −$2,262
- − Management
- −$2,262
- − HOA
- −$300
- − Depreciation
- −$6,662
- Taxable loss
- −$1,500
- Est. tax savings @ 24.0%
- +$360
- After-tax cash flow
- $2,525/yr
For passive investors: Depreciation is non-cash, so a rental often shows a tax loss while cash-flowing — sheltering income. Rental losses are passive: they offset passive income freely, and up to $25,000/yr can offset ordinary (W-2) income if you actively participate and your MAGI is under $100k (phasing out to $0 by $150k); unused losses carry forward. On sale, claimed depreciation is recaptured at up to 25%, and gains may owe capital-gains tax (a 1031 exchange can defer both). Figures are a year-1 estimate at your 24.0% rate — not tax advice; consult a CPA.
Schools (NCES district)
- District
- Goose Creek CISD
- NCES district ID
- 4821150
- Math proficiency
- 37% ▼ -11.00%
- Reading proficiency
- 36% ▼ -4.00%
- Median HH income
- $52,468
- Composite
- 31.84/100
- National rank
- #5877
- State rank
- #473 of 826 in TX
Livability — Baytown
- Score
- 69/100
- State rank
- #412
- US rank
- #8494
Category grades
Schools grade is shown separately in the Schools card above.
Census & demographics
- County
- Chambers County · 30,186 people
- City population
- 135,579
- Metro
- Houston-The Woodlands-Sugar Land, TX
- Population (ZIP)
- 30,186
- Household income
- $124,188
- Rent vs Own
- Severe rent burden
- 549.0
Population outlook (Chambers County) Hauer SSP2
- Today (2025)
- 46,946 people
- By 2030
- 51,094 · +8.8%
- By 2040
- 59,578 · +26.9%
- By 2050
- 68,318 · +45.5%
- By 2075
- 90,485 · +92.7%
- By 2100
- 104,885 · +123.4%
Race, ethnicity, and origin ACS 2023
- Neighborhood character
- Majority White (62%)
- Race & ethnicity
- White 62% Hispanic / Latino 25% Two or more races 11% Black 8% Asian 2%
- Hispanic origin (detail)
- Mexican 22%
- Common ancestry
- Lithuanian 1% Slovak 1% Serbian 1%
- Foreign-born
- 9% · Canada
- Languages at home
- 82% English-only · Spanish 17%
Political lean MEDSL · Chambers
- 2024 margin
- Solid R (+65.6) · D 16.8% · R 82.4%
- 2008→2024 swing
- -14.4pp toward R · 2008: -51.2pp · 2024: -65.6pp
- All cycles
- 2024: R+65.6 2020: R+61.7 2016: R+62.1 2012: R+61.1 2008: R+51.2
Not yet ingested
- Civics
- —
Market trends
- HPI YoY
- ▼ -102.33%
- Current HPI
- 222.6999
- Rent YoY
- ▲ 3.42%
- Metro
- Houston-The Woodlands-Sugar Land, TX
- State GDP YoY
- ▲ 3.95%
- F500 in state
- 110
Industry mix (Fortune 500 HQ in TX)
| Industry | F500 HQs | Revenue |
|---|---|---|
| Energy | 16 | $1,198B |
|
||
| Technology | 5 | $198B |
|
||
| Engineering / Construction | 4 | $72B |
|
||
| Energy Services | 3 | $60B |
|
||
| Utilities | 3 | $41B |
|
||
| Healthcare | 2 | $330B |
|
||
Price history
2 events — show timeline
- 2026-05-19 Listed $229,000 HARMLS
- 2017-05-30 Sold (Public Records) — Public Records
Property tax history
+4.1%/yrLatest (2025): $4,311 · -0.1% YoY. Source: county tax records.
Cash-flow waterfall
monthlySold comps — $/sqft
last 12 mo · ≤1 miLoading sold comps…