10017 Morocco Rd · Houston, TX
Flood risk 3/10 · Minor
- FEMA flood zone
- X (unshaded)
- Chance of flooding over 30 yrs
- 0.2%
- Est. flood insurance / yr
- $507 – $1,088
Fire risk 1/10 · Minimal
- Est. fire insurance / yr
- $1,222 – $2,270
Heat risk 9/10 · Severe
- Hot days now (above 109°F)
- 7 days/yr
- Hot days in 30 yrs
- 23 days/yr
Wind risk 9/10 · Severe
- Chance of severe wind over 30 yrs
- 99.0%
Air-quality risk 3/10 · Minor
- Unhealthy air days now
- 3 days/yr
- Unhealthy air days in 30 yrs
- 3 days/yr
Risk factors via First Street. Map © Google.
Why this score? — see what drove the D grade
The composite is a weighted blend of 9 inputs, each scored 0–100. Each bar is that input's sub-score; the figure is the points it added to the 100-point composite (weight × sub-score).
- ARV discount +11.9/15.0
- Cash flow +7.1/30.0
- Condition / age +4.8/5.0
- Schools +4.4/10.0
- Appreciation +4.3/10.0
- Livability +3.7/5.0
- 1% rule +3.4/10.0
- Rent growth +2.6/5.0
- DSCR +1.3/10.0
$249,900
🖨 Deal sheet (PDF) 📄 Offer letter ✓ Due diligence
Listing remarks MLS
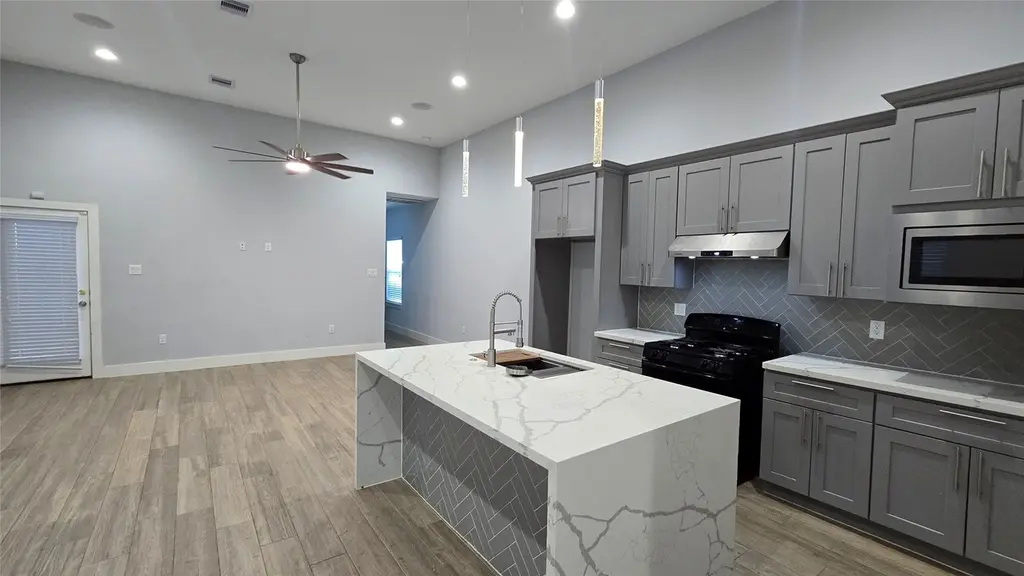
Beautiful recent construction by Texas Ranch Custom Homes located in the desirable Spring Branch area. This one-story home features an open-concept floor plan with raised ceilings and a modern kitchen showcasing custom-built soft-close cabinetry and quartz countertops. The spacious primary suite includes a luxurious bathroom designed for comfort and style. The home is wired for today’s technology, including surround sound pre-wire, Wi-Fi camera capability, LED lighting, and EV-ready plug. Conveniently located just minutes from Hwy 290 and Beltway 8. No HOA.
Key facts
- 3,497 sq ft lot
- 2 garage spots
- Built 2023
Neighborhood map
What this means for you Summary
Snapshot
- This is a 3-bed/2.0-bath single-family listed at $250k. Condition is rated excellent.
Deal economics
- At list price, monthly cash flow is $-353 ($-4k/yr) — negative.
- To cash-flow at today's rent, offer at most $188k (24.9% below list).
- To meet the 1% rule (rent ≥ 1% of price), the offer needs to be $210k (15.8% below list).
- Recommended offer: $188k (24.9% below list) — sets the bar for cash-flow.
- Cap rate 4.6% vs local median 3.2% in Houston — top-decile yield for the area; either an underpriced asset or a hidden risk that comps aren't pricing in. Stress-test before assuming the spread holds.
Location & tenants
- Location reads 74/100 on livability (#184 in TX, #4,771 nationally) — a middle-class / working-renter tenant base. Strengths: amenities A+, cost of living A+, housing A+; Watch: crime F.
- Cypress-Fairbanks ISD (suburban): math 45% / reading 52% proficiency, ranked #161 of 826 in TX (top 20%) — families likely to look elsewhere, expect single-tenant / working-renter base with shorter leases.
- Zoned schools: Kirk El (math 25% / reading 32%, grade F, #2,706 of 4,322 statewide, top 63%, 852 students, 79% FRL); Truitt Middle (math 34% / reading 41%, grade F, #736 of 1,662 statewide, top 45%, 1,419 students, 76% FRL); Cypress-Fairbanks J J A E P (12 students, 0% FRL).
- Zoned-school proficiency averages 33% at this address vs 48% district-wide (-16 pts) — the specific schools serving this property underperform the Cypress-Fairbanks ISD average; the district grade overstates school quality for this exact location.
- Market conditions: Rents flat; 177 active listings in the ZIP; 25 comparable units currently listed for rent nearby; rentals at typical pace (median 19d on market — plan ~3-4 weeks tenant-placement turnaround); solid renter incomes; 29,883 units permitted in Harris County in 2024 (8,621 in 5+ unit buildings).
- This rent runs 33% of the median local income ($77k/yr) — at the standard rent-burdened threshold; future hikes will face affordability resistance.
Forward outlook
- Local home prices are declining (-1.5%/yr); year-one equity from $2k of loan paydown is wiped out by about $4k of value loss. Plan a longer hold.
- Harris County population projected at +47% by 2050 — long-run rental-demand tailwind backs the buy-and-hold thesis.
Negotiation context
- It's been on market 83 days — a 6% lower offer ($235k) is reasonable based on typical stale-listing flexibility.
- 3 sale attempts since 4y ago; this cycle's ask has dropped $40k (14%) from the opening price — seller is motivated, your offer sets the floor, not the list.
Risks & watch-outs
- Watch-outs: property tax is 2.9% of price.
- Climate carrying-cost: severe wind risk, 99% chance of damaging wind over 30y; extreme-heat days projected 7→23/yr by 2055 (HVAC capex compounding) — expect insurance premiums to compound above CPI over the hold.
Questions for the listing agent
- What do current leases actually rent for vs. the listed asking? Can we see a recent rent roll and the last 12 months of T-12 income?
- It's been on market 83 days. Have you received any prior offers? Is the seller open to a 25% concession, seller financing, or rate buy-down credit?
- Property tax is high relative to price — has the assessment been appealed recently, and will the sale trigger a re-assessment?
- Why hasn't it sold? Are there any deal-killer items the seller is aware of (foundation, flood, title, zoning, code violations)?
- Is there a deadline driving the sale (1031 exchange, divorce, estate, relocation)? That informs how much negotiation room exists.
- Schools are D-rated, which usually means shorter tenancies and higher turnover. Who's the typical renter profile here, and what's been the actual vacancy rate?
- Crime grade is F in this area — have there been break-ins, vandalism, or insurance claims at this property in the last 3 years? What carrier currently insures it and at what premium?
- The area grade is low — what's the realistic commute time and amenity access for the typical tenant pool here? Any planned neighborhood developments (good or bad) we should know about?
- What's the average days-on-market for RENTAL listings here right now (not sales)? A rising rental-DOM trend means longer vacancies and softer asking-rent achievability than the comps imply.
- What's the recent tenant-quality profile in this submarket — average credit score on applications, eviction rate, late-payment / NSF rate, and stable-employment percentage? A property-management company in the area should have these aggregated.
- How much new for-sale + rental construction is in the pipeline within 1–3 miles? Heavy new supply typically softens prices + rents 12–24 months out; constrained supply supports both.
Investment metrics
- 1% rule
- 0.84% ✗
- Cap rate
- 4.60%
- Cash-on-cash
- -6.05%
- DSCR
- 0.73
- GRM
- 9.9
CMA / ARV
- ARV (median comp)
- $277,294
- List price
- $249,900
- Delta
- -9.88%
- Verdict
- FAIR
- Comps
- 20 within 1.0 mi
Show comp detail 9 sales within ~0.75 mi
| Address | Dist | Beds/Ba | Sqft | Sold | Price | $/sf | Match |
|---|---|---|---|---|---|---|---|
| 10022 Algiers Rd | 0.22mi | 3/2.0 | 1,680 (+7%) | 17mo | $270,000 | $161 | 64 |
| 9910 Genard Rd | 0.35mi | 3/2.0 | 1,741 (+11%) | 4mo | $199,900 | $115 | 62 |
| 5035 E Pagewick Dr | 0.62mi | 3/2.5 | 1,644 (+5%) | 2mo | $259,000 | $158 | 60 |
| 5206 E Pagewick Dr | 0.58mi | 3/2.0 | 1,629 (+4%) | 15mo | $279,999 | $172 | 54 |
| 10458 N Pagewick Dr | 0.69mi | 3/2.0 | 1,682 (+7%) | 3mo | $290,000 | $172 | 53 |
| 5027 E Fallen Bough Dr | 0.67mi | 3/2.0 | 1,719 (+10%) | 3mo | $310,000 | $180 | 50 |
| 10211 Tangiers Rd | 0.33mi | 3/1.5 | 1,337 (-15%) | 11mo | $299,000 | $224 | 49 |
| 10402 N Fallen Bough Dr | 0.63mi | 3/2.5 | 1,676 (+7%) | 12mo | $290,000 | $173 | 47 |
| 10403 N Shadowdale Dr | 0.71mi | 3/2.0 | 1,716 (+9%) | 13mo | $279,000 | $163 | 40 |
Match score weights: distance 35% · size 25% · config 20% · recency 20%. Top-matched comps best support the ARV.
Projected returns pro-forma
-1.47% appreciation · 0.25% rent growth · sell at horizon
- IRR
- -18.7%
- Equity multiple
- 0.26×
- Total profit
- $-51,980
- Equity at exit
- $54,738
- IRR
- -15.8%
- Equity multiple
- -0.15×
- Total profit
- $-80,278
- Equity at exit
- $52,846
Cash invested: $69,972 (down + closing). Projections, not guarantees.
Landlord ↔ Tenant lean methodology
- Overall (STATE)
- 87 Strongly Landlord-Friendly
- State Texas
- 87 Strongly Landlord-Friendly · R+5
- County
- — inherits STATE
- City
- — inherits STATE
ZIP-level market 77041
- Home prices YoY
- -0.6%
- Rents YoY
- 0.2%
- Active inventory
- 177
- Price-to-rent
- 9.9×
Monthly cashflow live
- Estimated rent
- $2,104 high interval (Pro) →
- Mortgage (P&I)
- −$1,311
- Tax from tax record
- −$600 /mo · $7,199/yr
- Insurance
- −$104
- HOA
- −$0
- Vacancy / Maint / Mgmt
- −$442
- Net cashflow
- $-353
Break-even live
Sensitivity live
| Price | -10% $-211 | -5% $-282 | +0% $-353 | +5% $-423 | +10% $-494 |
|---|---|---|---|---|---|
| Rent | -10% $-519 | -5% $-436 | +0% $-353 | +5% $-270 | +10% $-186 |
| Rate | -1.0pp $-227 | -0.5pp $-289 | base $-353 | +0.5pp $-417 | +1.0pp $-483 |
UW: 25.0% down · 7.5% · 30yr · 1.5% tax · 5.0% vac · 8.0% maint · 8.0% mgmt
Financing live
Cash to close
- Down payment
- $62,475
- Closing costs
- $7,497
- Reserves months
- —
- Total cash needed
- —
Loan-product check · same deal, 3 products live
Conventional
25% down · 7.5% · 30yr
- Down + closing
- —
- Monthly P&I
- —
- Monthly cashflow
- —
- DSCR
- —
- Eligible?
- —
Personal DTI + credit; lowest rate.
DSCR
20% down · 8.5% · 30yr
- Down + closing
- —
- Monthly P&I
- —
- Monthly cashflow
- —
- DSCR
- —
- Eligible?
- —
No personal income docs; deal must DSCR.
Hard money
10% down · 12.0% · 12mo
- Down + closing
- —
- Monthly P&I
- —
- Monthly cashflow
- —
- DSCR
- —
- Eligible?
- —
Short-term bridge; refi at stabilization.
Rent comps 25 comps
| Address | Beds | Baths | Sqft | Rent | $/sqft | DOM | Units | Dist |
|---|---|---|---|---|---|---|---|---|
| 10021 Alfred Ln Houston, TX | 4.0 | 3.0 | 1970 | $3,000 | $1.52 | 45d | 1 | 0.38mi |
| 10106 Teague Rd Houston, TX | 2.0 | 2.0 | 1182 | $1,700 | $1.44 | 45d | 1 | 0.64mi |
| 6620 Gessner Rd Houston, TX | 1.0–2.0 | 1.0–2.0 | 875 | $1,640 | $1.87 | 3d | 23 | 0.97mi |
| 10615 Heatherford Dr Houston, TX | 4.0 | 2.0 | 2120 | $2,495 | $1.18 | 9d | 1 | 1.09mi |
| 5550 Dancy Rd Houston, TX | 1.0–2.0 | 1.0–2.0 | 987 | $2,220 | $2.25 | 1d | 12 | 1.18mi |
| 5550 Dancy Rd Houston, TX | 2.0 | 2.0 | 1185 | $1,805 | $1.52 | 24d | 1 | 1.18mi |
| 5550 Dancy Rd Houston, TX | 1.0–2.0 | 1.0–2.0 | 987 | $2,274 | $2.30 | 45d | 37 | 1.18mi |
| 5550 Dancy Rd Unit 5587 Houston, TX | 2.0 | 2.0 | 1185 | $1,916 | $1.62 | 18d | 1 | 1.19mi |
| 10350 Clay Rd Ste 150 Houston, TX | 2.0 | 2.0 | 1079 | $1,460 | $1.35 | 45d | 1 | 1.19mi |
| 9945 Storehouse Dr Houston, TX | 3.0 | 2.5 | 2119 | $2,600 | $1.23 | 45d | 1 | 1.19mi |
| 9826 Rugged Oaks Dr Houston, TX | 3.0 | 2.5 | 1942 | $2,250 | $1.16 | 26d | 1 | 1.21mi |
| 5600 Dancy Rd Houston, TX | 1.0–2.0 | 1.0–2.0 | 934 | $2,244 | $2.40 | 1d | 104 | 1.24mi |
| 8327 W Tidwell Rd Houston, TX | 1.0–2.0 | 1.0–2.5 | 853 | $1,355 | $1.59 | 3d | 16 | 1.25mi |
| 9813 Falling Fern Ln Houston, TX | 3.0 | 2.5 | 1650 | $2,295 | $1.39 | 26d | 1 | 1.25mi |
| 9811 Falling Fern Ln Houston, TX | 3.0 | 2.5 | 1942 | $2,400 | $1.24 | 1d | 1 | 1.25mi |
| 10333 Clay Rd Unit 10370 Houston, TX | 2.0 | 2.0 | 1133 | $1,804 | $1.59 | 45d | 1 | 1.30mi |
| 10333 Clay Rd Unit 2174 Houston, TX | 2.0 | 2.0 | 1133 | $1,803 | $1.59 | 12d | 1 | 1.30mi |
| 10333 Clay Rd Unit 425 Houston, TX | 2.0 | 2.0 | 1133 | $1,763 | $1.56 | 1d | 1 | 1.30mi |
| 10333 Clay Rd Unit 424 Houston, TX | 2.0 | 2.0 | 1133 | $1,779 | $1.57 | 7d | 1 | 1.30mi |
| 10339 Clay Rd Unit 4054 Houston, TX | 2.0 | 2.0 | 1096 | $1,808 | $1.65 | 45d | 1 | 1.32mi |
| 10227 Centrepark Dr Houston, TX | 2.0 | 2.0 | 1148 | $1,558 | $1.36 | 45d | 1 | 1.35mi |
| 10221 Centrepark Dr Unit 525 Houston, TX | 3.0 | 2.0 | 1386 | $2,039 | $1.47 | 1d | 1 | 1.40mi |
| 10221 Centrepark Dr Unit 3174 Houston, TX | 3.0 | 2.0 | 1386 | $2,090 | $1.51 | 13d | 1 | 1.40mi |
| 10221 Centrepark Dr Unit 10254 Houston, TX | 3.0 | 2.0 | 1386 | $2,014 | $1.45 | 45d | 1 | 1.40mi |
| 10800 Clay Rd Houston, TX | 1.0–3.0 | 1.0–2.0 | 1016 | $2,010 | $1.98 | 1d | 33 | 1.43mi |
Listing history 24 events
-
2026-06-21days on market $249,900 Active 83 DOM
-
2026-06-18days on market $249,900 Active 80 DOM
-
2026-06-17days on market $249,900 Active 79 DOM
-
2026-06-16days on market $249,900 Active 78 DOM
-
2026-06-15pricedays on market $249,900 Active 77 DOM
-
2026-06-13days on market $269,900 Active 75 DOM
-
2026-06-13days on market $269,900 Active 74 DOM
-
2026-06-09days on market $269,900 Active 71 DOM
-
2026-06-08days on market $269,900 Active 70 DOM
-
2026-06-07days on market $269,900 Active 69 DOM
-
2026-06-04days on market $269,900 Active 66 DOM
-
2026-06-03days on market $269,900 Active 65 DOM
-
2026-06-02days on market $269,900 Active 64 DOM
-
2026-06-02days on market $269,900 Active 63 DOM
-
2026-05-31days on market $269,900 Active 62 DOM
-
2026-05-03price $269,900 569-char remark
Show marketing remark (569 chars)
Beautiful recent construction by Texas Ranch Custom Homes located in the desirable Spring Branch area. This one-story home features an open-concept floor plan with raised ceilings and a modern kitchen showcasing custom-built soft-close cabinetry and quartz countertops. The spacious primary suite includes a luxurious bathroom designed for comfort and style. The home is wired for today’s technology, including surround sound pre-wire, Wi-Fi camera capability, LED lighting, and EV-ready plug. Conveniently located just minutes from Hwy 290 and Beltway 8. No HOA.
-
2026-03-30$290,000 Active 569-char remark
Show marketing remark (569 chars)
Beautiful recent construction by Texas Ranch Custom Homes located in the desirable Spring Branch area. This one-story home features an open-concept floor plan with raised ceilings and a modern kitchen showcasing custom-built soft-close cabinetry and quartz countertops. The spacious primary suite includes a luxurious bathroom designed for comfort and style. The home is wired for today’s technology, including surround sound pre-wire, Wi-Fi camera capability, LED lighting, and EV-ready plug. Conveniently located just minutes from Hwy 290 and Beltway 8. No HOA.
-
2026-02-12soldstatus
-
2023-11-10soldstatus Sold 558-char remark
Show marketing remark (558 chars)
Gorgeous new construction by Texas Ranch Custom Homes in the Spring Branch Area. No HOA! This stunning one story home offers an open floor plan with raised ceilings, a luxurious modern kitchen with custom built soft closed cabinets that features quartz countertops. Master suite has an amazing luxury bath. It is wired for today's electronics with surround sound pre-wire, Wi-Fi cameras, LED lighting and EV ready plug outlet. Loaded with so much sophistication and style. Located minutes away from Frwy 290 and Beltway 8. The property is under construction.
-
2023-09-01status Pending 558-char remark
Show marketing remark (558 chars)
Gorgeous new construction by Texas Ranch Custom Homes in the Spring Branch Area. No HOA! This stunning one story home offers an open floor plan with raised ceilings, a luxurious modern kitchen with custom built soft closed cabinets that features quartz countertops. Master suite has an amazing luxury bath. It is wired for today's electronics with surround sound pre-wire, Wi-Fi cameras, LED lighting and EV ready plug outlet. Loaded with so much sophistication and style. Located minutes away from Frwy 290 and Beltway 8. The property is under construction.
-
2023-07-13$299,900 Active 558-char remark
Show marketing remark (558 chars)
Gorgeous new construction by Texas Ranch Custom Homes in the Spring Branch Area. No HOA! This stunning one story home offers an open floor plan with raised ceilings, a luxurious modern kitchen with custom built soft closed cabinets that features quartz countertops. Master suite has an amazing luxury bath. It is wired for today's electronics with surround sound pre-wire, Wi-Fi cameras, LED lighting and EV ready plug outlet. Loaded with so much sophistication and style. Located minutes away from Frwy 290 and Beltway 8. The property is under construction.
-
2023-01-13historical
-
2022-11-02$75,000 Active
-
2022-08-30soldstatus
ⓘ Source: listings_history table (triggers on properties + properties_extension) + one-shot
backfill from property_details.listing_events for pre-trigger history.
Tax reassessment forecast TX · Resets to sale price
- Current annual tax
- $7,199 · $600/mo
- Projected year-2 tax
- $7,199 · $600/mo
- Expected delta
- $0/yr ($0/mo · 0.0%)
ⓘ Screening estimate from a state-policy table — verify with the county assessor before closing.
Climate risk First Street
- Flood 3/10 Moderate FEMA zone X (unshaded) · 20% chance over 30 yrs
- Wildfire 1/10 Low
- Heat 9/10 Extreme 7 d/yr ≥109°F today · 23 d/yr by 30 yrs out
- Wind 9/10 Extreme 99% chance of damaging wind over 30 yrs
- Air quality 3/10 Moderate 3 unhealthy d/yr today · 3 by 30 yrs out
Nearby sold comps map
Loading sold comps map…
Walkable amenities ~0.75 mi
Loading nearby amenities…
Taxation est. · year 1
- Rental income
- $25,245
- − Mortgage interest
- −$13,998
- − Property taxes
- −$7,199
- − Insurance
- −$1,250
- − Repairs & maintenance
- −$2,020
- − Management
- −$2,020
- − Depreciation
- −$7,270
- Taxable loss
- −$8,511
- Est. tax savings @ 24.0%
- +$2,043
- After-tax cash flow
- $-2,189/yr
For passive investors: Depreciation is non-cash, so a rental often shows a tax loss while cash-flowing — sheltering income. Rental losses are passive: they offset passive income freely, and up to $25,000/yr can offset ordinary (W-2) income if you actively participate and your MAGI is under $100k (phasing out to $0 by $150k); unused losses carry forward. On sale, claimed depreciation is recaptured at up to 25%, and gains may owe capital-gains tax (a 1031 exchange can defer both). Figures are a year-1 estimate at your 24.0% rate — not tax advice; consult a CPA.
Condition & rehab AI · 3 photos
This recently constructed home in Spring Branch is in excellent condition with modern finishes and a prime location. It is move-in ready and offers high ROI potential with minor updates to landscaping and smart home features.
Value-add opportunities
- Both Landscaping and curb appeal improvements — Enhances curb appeal and can attract more buyers/renters.
- Both Add smart home features — Enhances home's modern amenities and can attract tech-savvy buyers/renters.
- Both Install smart thermostat — Improves energy efficiency and can attract buyers/renters looking for smart home features.
Renovation cost estimate screening
Value-add ROI direction
- Both Landscaping and curb appeal improvements — Enhances curb appeal and can attract more buyers/renters. ↑
- Both Add smart home features — Enhances home's modern amenities and can attract tech-savvy buyers/renters. ↑
- Both Install smart thermostat — Improves energy efficiency and can attract buyers/renters looking for smart home features. ↑
ⓘ Cost ranges are severity-bucket heuristics (US national rule-of-thumb). Get contractor quotes + a written scope before underwriting a rehab budget.
Schools (NCES district)
- District
- Cypress-Fairbanks ISD
- NCES district ID
- 4816110
- Math proficiency
- 45% ▼ -12.00%
- Reading proficiency
- 52% ▼ -2.00%
- Median HH income
- $72,025
- Composite
- 43.63/100
- National rank
- #2968
- State rank
- #161 of 826 in TX
Livability — Houston
- Score
- 74/100
- State rank
- #184
- US rank
- #4771
Category grades
Schools grade is shown separately in the Schools card above.
Census & demographics
- Census place
- Houston, TX
- County
- Harris County · 4,702,590 people
- City population
- 3,226,434
- Metro
- Houston-The Woodlands-Sugar Land, TX
- Population (ZIP)
- 33,349
- Household income
- $77,083
- Rent vs Own
- Severe rent burden
- 537.0
Population outlook (Harris County) Hauer SSP2
- Today (2025)
- 5,571,493 people
- By 2030
- 6,089,821 · +9.3%
- By 2040
- 7,142,806 · +28.2%
- By 2050
- 8,185,864 · +46.9%
- By 2075
- 10,574,329 · +89.8%
- By 2100
- 12,109,958 · +117.4%
Race, ethnicity, and origin ACS 2023
- Neighborhood character
- Diverse neighborhood (Simpson 0.67)
- Race & ethnicity
- Hispanic / Latino 50% Two or more races 25% White 23% Asian 16% Black 9% Native American 3%
- Hispanic origin (detail)
- Mexican 36% Cuban 2% Salvadoran 1%
- Common ancestry
- Italian 1% Portuguese 1% Romanian 1%
- Foreign-born
- 38% · Canada, Vietnam, China
- Languages at home
- 45% English-only · Spanish 39% Vietnamese 8% Other Indo-European 3%
Political lean MEDSL · Harris
- 2024 margin
- Lean D (+5.5) · D 52.0% · R 46.4% · Other 1.6%
- 2008→2024 swing
- +3.9pp toward D · 2008: 1.6pp · 2024: 5.5pp
- All cycles
- 2024: D+5.5 2020: D+13.3 2016: D+12.4 2012: D+0.1 2008: D+1.6
Not yet ingested
- Civics
- —
Market trends
- HPI YoY
- ▼ -1.47%
- Current HPI
- 241.5096
- Rent YoY
- ▲ 0.25%
- Metro
- Houston-The Woodlands-Sugar Land, TX
- State GDP YoY
- ▲ 3.95%
- F500 in state
- 110
Industry mix (Fortune 500 HQ in TX)
| Industry | F500 HQs | Revenue |
|---|---|---|
| Energy | 16 | $1,198B |
|
||
| Technology | 5 | $198B |
|
||
| Engineering / Construction | 4 | $72B |
|
||
| Energy Services | 3 | $60B |
|
||
| Utilities | 3 | $41B |
|
||
| Healthcare | 2 | $330B |
|
||
Price history
+259.9% since first listed9 events — show timeline
- 2026-05-03 Price Changed $269,900 HARMLS
- 2026-03-30 Listed $290,000 HARMLS
- 2026-02-12 Sold (Public Records) — Public Records
- 2023-11-10 Sold (MLS) — HARMLS
- 2023-09-01 Pending — HARMLS
- 2023-07-13 Listed $299,900 HARMLS
- 2023-01-13 Listing Removed — HARMLS
- 2022-11-02 Listed $75,000 HARMLS
- 2022-08-30 Sold (Public Records) — Public Records
Property tax history
+97.5%/yrLatest (2025): $7,199 · -6.0% YoY. Source: county tax records.
Cash-flow waterfall
monthlySold comps — $/sqft
last 12 mo · ≤1 miLoading sold comps…