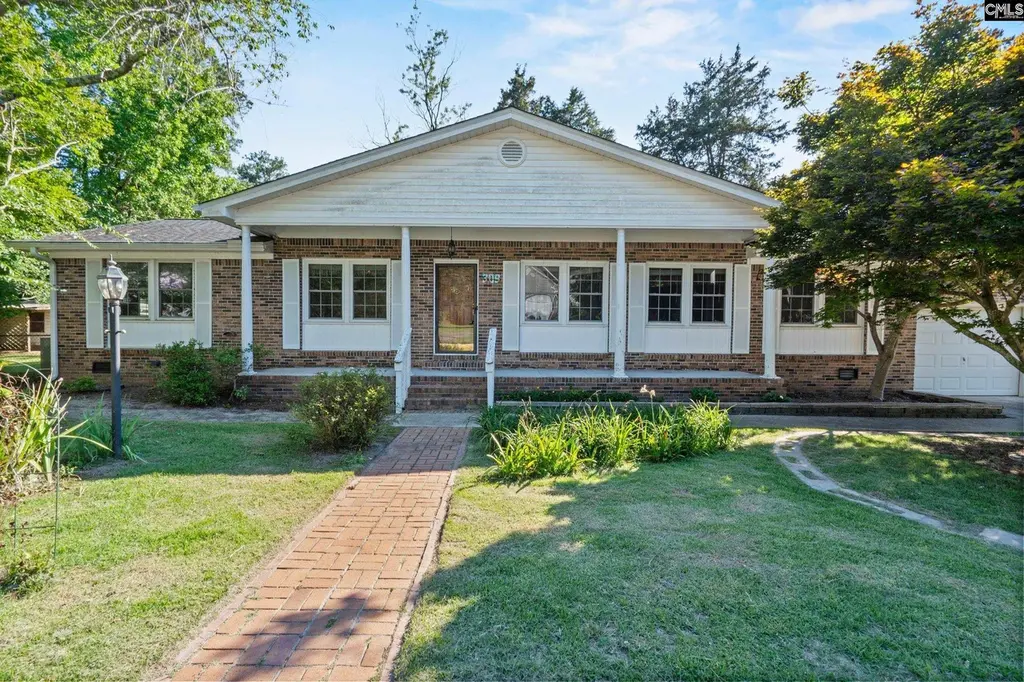
309 Remington Dr · Dentsville, SC
Flood risk 3/10 · Minor
- FEMA flood zone
- X (unshaded)
- Chance of flooding over 30 yrs
- 0.12%
- Est. flood insurance / yr
- $507 – $1,088
Fire risk 4/10 · Minor
- Est. fire insurance / yr
- $783 – $1,453
Heat risk 6/10 · Moderate
- Hot days now (above 107°F)
- 7 days/yr
- Hot days in 30 yrs
- 16 days/yr
Wind risk 6/10 · Moderate
- Chance of severe wind over 30 yrs
- 64.0%
Air-quality risk 3/10 · Minor
- Unhealthy air days now
- 3 days/yr
- Unhealthy air days in 30 yrs
- 3 days/yr
Risk factors via First Street. Map © Google.
Why this score? — see what drove the C grade
The composite is a weighted blend of 9 inputs, each scored 0–100. Each bar is that input's sub-score; the figure is the points it added to the 100-point composite (weight × sub-score).
- Cash flow +20.4/30.0
- ARV discount +15.0/15.0
- DSCR +6.5/10.0
- 1% rule +4.4/10.0
- Schools +3.6/10.0
- Livability +3.6/5.0
- Rent growth +2.6/5.0
- Condition / age +2.5/5.0
- Appreciation +0.0/10.0
$199,000
🖨 Deal sheet 📄 Offer letter ✓ Due diligence
Listing remarks
Instant Equity! Brick ranch on a corner lot in the established Greensprings neighborhood of Northeast Columbia. This single-level 3 bedroom, 2 bath home offers a functional floor plan with a formal living room, formal dining room, a separate office, and a den with a wood-burning fireplace. Hardwood floors run through the kitchen, den, and office. The primary bedroom includes a private bath and a walk-in closet. Additional features include a one-car attached garage with laundry, thermopane windows, central vacuum, and a heat pump system. Outside, enjoy a large deck, a workshop with electricity, brick pavers, a sprinkler system, and a partially fenced rear yard on a 0.30 acre corner lot. Publ
Key facts
- Separate office
- Formal dining room
- Formal living room
Tags
Property features AI
Exterior
- Parking: Main-level attached garage with space for 1 vehicle
- Utilities: Public water; Public sewer
- Home design: Single-story home
- Construction: Brick exterior above the foundation; Crawlspace foundation
- Exterior features: Deck; Sprinkler system; Workshop; Rear chain-link fence
Interior
- Kitchen: Hardwood flooring; Formica countertops; Built-in range; Dishwasher, Disposal
- Bedrooms: Main-level master bedroom with private bath and walk-in closet; Other bedrooms located on the main level
- Flooring: Hardwood floors
- Bathrooms: Two full bathrooms
- Heating & cooling: Heat pump serving the first level (heating and cooling)
- Interior features: Wood-burning fireplace; Built-in range; Dishwasher, Disposal
- Laundry & utility: Laundry located in the garage
Neighborhood map
What this means for you Summary
Snapshot
- This is a 3-bed/2.0-bath single-family listed at $199k.
Deal economics
- At list price, monthly cash flow is $260 ($3k/yr) — positive.
- The deal already cash-flows at list — no discount required.
- To meet the 1% rule (rent ≥ 1% of price), the offer needs to be $187k (6.2% below list).
- Recommended offer: $187k (6.2% below list) — sets the bar for 1% rule.
Location & tenants
- Location reads 71/100 on livability (#50 in SC) — a middle-class / working-renter tenant base. Strengths: cost of living A+, health & safety A+, housing A; Watch: amenities D+, crime F, commute F.
- Richland 02 (suburban): math 35% / reading 47% proficiency, ranked #29 of 80 in SC (top 36%) — families likely to look elsewhere, expect single-tenant / working-renter base with shorter leases.
- Zoned schools: L. B. Nelson Elementary (math 39% / reading 43%, grade F, #276 of 597 statewide, top 48%, 567 students, 76% FRL); Spring Valley High (math 53% / reading 92%, grade B+, #46 of 196 statewide, top 24%, 2,187 students, 49% FRL) — zoned schools average 62% FRL vs 38% district-wide (24 pts higher); higher-poverty schools than district average — tighter screening recommended.
- Zoned-school proficiency averages 57% at this address vs 41% district-wide (+16 pts) — the actual schools serving this property are materially stronger than the Richland 02 average implies; a family-tenant draw the district grade alone would hide.
- Market conditions: Rents flat; 341 active listings in the ZIP; 10 comparable units currently listed for rent nearby; rentals at typical pace (median 14d on market — plan ~3-4 weeks tenant-placement turnaround); 3,472 units permitted in Richland County in 2024 (1,096 in 5+ unit buildings).
- This rent runs 36% of the median local income ($62k/yr) — at the standard rent-burdened threshold; future hikes will face affordability resistance.
Forward outlook
- Local home prices are declining (-3.0%/yr); year-one equity from $1k of loan paydown is wiped out by about $6k of value loss. Plan a longer hold.
- Richland County population projected at +30% by 2050 — long-run rental-demand tailwind backs the buy-and-hold thesis.
Negotiation context
- Only 7 days on market — expect competitive offers; lowballing is unlikely to land.
Risks & watch-outs
- Climate carrying-cost: major wind risk, 64% chance of damaging wind over 30y; extreme-heat days projected 7→16/yr by 2055 (HVAC capex compounding) — expect insurance premiums to compound above CPI over the hold.
Questions for the listing agent
- Built in 1976 — when were the roof, HVAC, electrical panel, plumbing, and water heater last replaced?
- Is there a deadline driving the sale (1031 exchange, divorce, estate, relocation)? That informs how much negotiation room exists.
- Schools are D-rated, which usually means shorter tenancies and higher turnover. Who's the typical renter profile here, and what's been the actual vacancy rate?
- Crime grade is F in this area — have there been break-ins, vandalism, or insurance claims at this property in the last 3 years? What carrier currently insures it and at what premium?
- What's the average days-on-market for RENTAL listings here right now (not sales)? A rising rental-DOM trend means longer vacancies and softer asking-rent achievability than the comps imply.
- What's the recent tenant-quality profile in this submarket — average credit score on applications, eviction rate, late-payment / NSF rate, and stable-employment percentage? A property-management company in the area should have these aggregated.
- How much new for-sale + rental construction is in the pipeline within 1–3 miles? Heavy new supply typically softens prices + rents 12–24 months out; constrained supply supports both.
Investment metrics
- 1% rule
- 0.94% ✗
- Cap rate
- 7.86%
- Cash-on-cash
- 5.60%
- DSCR
- 1.25
- GRM
- 8.9
CMA / ARV
- ARV (on-the-fly)
- $244,404
- Comps found
- 1
Show comp detail 1 sale within ~0.75 mi
| Address | Dist | Beds/Ba | Sqft | Sold | Price | $/sf | Match |
|---|---|---|---|---|---|---|---|
| 144 Peaceful Ln | 0.47mi | 3/2.0 | 1,544 (-8%) | 19mo | $225,000 | $146 | 49 |
Match score weights: distance 35% · size 25% · config 20% · recency 20%. Top-matched comps best support the ARV.
Projected returns pro-forma
-3.0% appreciation · 0.21% rent growth · sell at horizon
- IRR
- -10.5%
- Equity multiple
- 0.63×
- Total profit
- $-20,841
- Equity at exit
- $29,672
- IRR
- -5.2%
- Equity multiple
- 0.70×
- Total profit
- $-16,879
- Equity at exit
- $17,206
Cash invested: $55,720 (down + closing). Projections, not guarantees.
Landlord ↔ Tenant lean methodology
- Overall (STATE)
- 90 Strongly Landlord-Friendly
- State South Carolina
- 90 Strongly Landlord-Friendly · R+6
- County
- — inherits STATE
- City
- — inherits STATE
ZIP-level market 29223
- Rents YoY
- 0.2%
- Active inventory
- 341
- Price-to-rent
- 8.9×
Monthly cashflow live
- Estimated rent
- $1,867 high interval (Pro) →
- Mortgage (P&I)
- −$1,044
- Tax from tax record
- −$88 /mo · $1,060/yr
- Insurance
- −$83
- HOA
- −$0
- Vacancy / Maint / Mgmt
- −$392
- Net cashflow
- $260
Break-even live
UW: 25.0% down · 7.5% · 30yr · 1.5% tax · 5.0% vac · 8.0% maint · 8.0% mgmt
Financing live
Cash to close
- Down payment
- $49,750
- Closing costs
- $5,970
- Reserves months
- —
- Total cash needed
- —
Loan-product check · same deal, 3 products live
Conventional
25% down · 7.5% · 30yr
- Down + closing
- —
- Monthly P&I
- —
- Monthly cashflow
- —
- DSCR
- —
- Eligible?
- —
Personal DTI + credit; lowest rate.
DSCR
20% down · 8.5% · 30yr
- Down + closing
- —
- Monthly P&I
- —
- Monthly cashflow
- —
- DSCR
- —
- Eligible?
- —
No personal income docs; deal must DSCR.
Hard money
10% down · 12.0% · 12mo
- Down + closing
- —
- Monthly P&I
- —
- Monthly cashflow
- —
- DSCR
- —
- Eligible?
- —
Short-term bridge; refi at stabilization.
Rent comps 10 comps
| Address | Beds | Baths | Sqft | Rent | $/sqft | DOM | Units | Dist |
|---|---|---|---|---|---|---|---|---|
| 495 Blue Garden Way Columbia, SC | 4.0 | 2.5 | 2075 | $2,224 | $1.07 | 2d | 1 | 0.60mi |
| 502 Blue Garden Way Columbia, SC | 4.0 | 2.5 | 1775 | $2,183 | $1.23 | 14d | 1 | 0.64mi |
| 916 N Brickyard Rd Columbia, SC | 3.0 | 2.0 | 1350 | $1,695 | $1.26 | 14d | 1 | 0.83mi |
| 313 Brook Hollow Dr Columbia, SC | 3.0 | 3.0 | 1879 | $1,700 | $0.90 | 14d | 1 | 0.85mi |
| 109 Jaybird Ln Columbia, SC | 3.0 | 2.0 | 1250 | $1,679 | $1.34 | 2d | 1 | 0.86mi |
| 136 Westport Dr Columbia, SC | 3.0 | 2.0 | 1303 | $1,769 | $1.36 | 21d | 1 | 1.16mi |
| 108 Quinton Ln Columbia, SC | 3.0 | 2.0 | 1052 | $1,749 | $1.66 | 21d | 1 | 1.21mi |
| 113 Millhouse Ct Columbia, SC | 3.0 | 2.0 | 1936 | $2,030 | $1.05 | 19d | 1 | 1.38mi |
| 4500 Hard Scrabble Rd Columbia, SC | 1.0–3.0 | 1.0–2.0 | 1031 | $1,455 | $1.41 | 2d | 4 | 1.42mi |
| 423 Elders Pond Cir Columbia, SC | 2.0 | 2.0 | 1125 | $1,475 | $1.31 | 19d | 1 | 1.49mi |
Listing history 6 events
-
2026-06-13statusdays on market $199,000 Pending 7 DOM
-
2026-06-10days on market $199,000 Active 5 DOM
-
2026-06-09days on market $199,000 Active 4 DOM
-
2026-06-08days on market $199,000 Active 3 DOM
-
2026-06-07remarks 699-char remark
-
2026-06-07$199,000 Active 2 DOM
ⓘ Source: listings_history table (triggers on properties + properties_extension) + one-shot
backfill from property_details.listing_events for pre-trigger history.
Tax reassessment forecast SC · Resets to sale price
- Current annual tax
- $1,060 · $88/mo
- Projected year-2 tax
- $1,134 · $95/mo
- Expected delta
- +$74/yr (+$6/mo · 7.0%)
ⓘ Screening estimate from a state-policy table — verify with the county assessor before closing.
Climate risk First Street
- Flood 3/10 Moderate FEMA zone X (unshaded) · 12% chance over 30 yrs
- Wildfire 4/10 Moderate
- Heat 6/10 Major 7 d/yr ≥107°F today · 16 d/yr by 30 yrs out
- Wind 6/10 Major 64% chance of damaging wind over 30 yrs
- Air quality 3/10 Moderate 3 unhealthy d/yr today · 3 by 30 yrs out
Nearby sold comps map
Loading sold comps map…
Walkable amenities ~0.75 mi
Loading nearby amenities…
Taxation est. · year 1
- Rental income
- $22,406
- − Mortgage interest
- −$11,147
- − Property taxes
- −$1,060
- − Insurance
- −$995
- − Repairs & maintenance
- −$1,793
- − Management
- −$1,793
- − Depreciation
- −$5,789
- Taxable loss
- −$170
- Est. tax savings @ 24.0%
- +$41
- After-tax cash flow
- $3,164/yr
For passive investors: Depreciation is non-cash, so a rental often shows a tax loss while cash-flowing — sheltering income. Rental losses are passive: they offset passive income freely, and up to $25,000/yr can offset ordinary (W-2) income if you actively participate and your MAGI is under $100k (phasing out to $0 by $150k); unused losses carry forward. On sale, claimed depreciation is recaptured at up to 25%, and gains may owe capital-gains tax (a 1031 exchange can defer both). Figures are a year-1 estimate at your 24.0% rate — not tax advice; consult a CPA.
Schools (NCES district)
- District
- Richland 02
- NCES district ID
- 4503390
- Math proficiency
- 35% ▼ -15.00%
- Reading proficiency
- 47% ▼ -5.00%
- Median HH income
- $59,684
- Composite
- 36.2/100
- National rank
- #4730
- State rank
- #29 of 80 in SC
Livability — Dentsville
- Score
- 71/100
- State rank
- #50
- US rank
- #6940
Category grades
Schools grade is shown separately in the Schools card above.
Census & demographics
- County
- Richland County · 389,530 people
- City population
- 52,835
- Metro
- Columbia, SC
- Population (ZIP)
- 53,074
- Household income
- $62,408
- Rent vs Own
- Severe rent burden
- 2857.0
Population outlook (Richland County) Hauer SSP2
- Today (2025)
- 459,667 people
- By 2030
- 487,524 · +6.1%
- By 2040
- 542,035 · +17.9%
- By 2050
- 595,371 · +29.5%
- By 2075
- 732,998 · +59.5%
- By 2100
- 820,415 · +78.5%
Race, ethnicity, and origin ACS 2023
- Neighborhood character
- Diverse neighborhood (Simpson 0.60)
- Race & ethnicity
- Black 57% White 23% Hispanic / Latino 11% Two or more races 6% Asian 4%
- Hispanic origin (detail)
- Mexican 5% Puerto Rican 2%
- Common ancestry
- Slovak 1% Serbian 1% Italian 1%
- Foreign-born
- 10% · Canada, South Korea
- Languages at home
- 86% English-only · Spanish 8% Other Indo-European 2% Korean 1%
Political lean MEDSL · Richland
- 2024 margin
- Solid D (+34.6) · D 66.4% · R 31.8% · Other 1.8%
- 2008→2024 swing
- +5.7pp toward D · 2008: 28.9pp · 2024: 34.6pp
- All cycles
- 2024: D+34.6 2020: D+38.3 2016: D+32.9 2012: D+33.3 2008: D+28.9
Not yet ingested
- Civics
- —
Market trends
- HPI YoY
- ▼ -135.96%
- Current HPI
- 195.3158
- Rent YoY
- ▲ 0.21%
- Metro
- Columbia, SC
- State GDP YoY
- ▲ 4.51%
- F500 in state
- 2
Industry mix (Fortune 500 HQ in SC)
| Industry | F500 HQs | Revenue |
|---|---|---|
| Packaging | 1 | $7B |
|
||
Price history
1 event — show timeline
- 2026-06-05 Listed $199,000 Consolidated MLS
Property tax history
+2.8%/yrLatest (2025): $1,060 · +3.6% YoY. Source: county tax records.
Cash-flow waterfall
monthlySold comps — $/sqft
last 12 mo · ≤1 miLoading sold comps…