 Fourplex
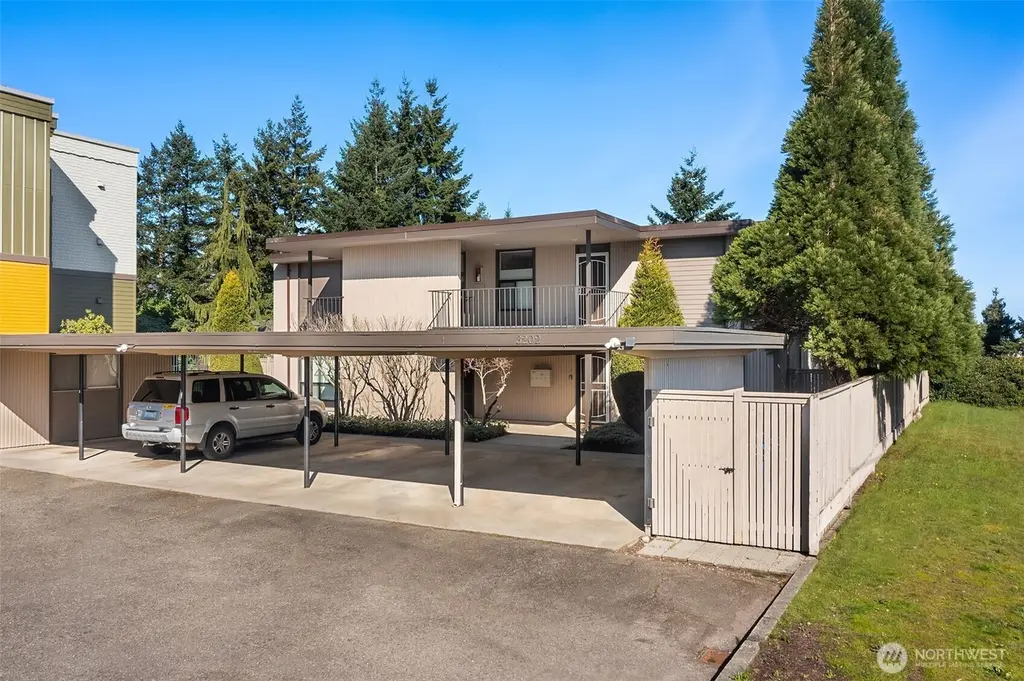
3202 S D St · Tacoma, WA
Flood risk 1/10 · Minimal
- FEMA flood zone
- X (unshaded)
- Chance of flooding over 30 yrs
- 0.0%
- Est. flood insurance / yr
- $507 – $1,088
Fire risk 1/10 · Minimal
- Est. fire insurance / yr
- $604 – $1,122
Heat risk 3/10 · Minor
- Hot days now (above 86°F)
- 7 days/yr
- Hot days in 30 yrs
- 15 days/yr
Wind risk 1/10 · Minimal
- Chance of severe wind over 30 yrs
- —
Air-quality risk 7/10 · Major
- Unhealthy air days now
- 10 days/yr
- Unhealthy air days in 30 yrs
- 12 days/yr
Risk factors via First Street. Map © Google.
Why this score? — see what drove the C+ grade
The composite is a weighted blend of 9 inputs, each scored 0–100. Each bar is that input's sub-score; the figure is the points it added to the 100-point composite (weight × sub-score).
- Cash flow +25.6/30.0
- DSCR +8.5/10.0
- ARV discount +7.5/15.0
- 1% rule +6.3/10.0
- Rent growth +5.0/5.0
- Schools +4.2/10.0
- Livability +3.9/5.0
- Condition / age +2.5/5.0
- Appreciation +0.0/10.0
$999,950
🖨 Deal sheet 📄 Offer letter ✓ Due diligence
Multi-family units
County records classify this as Multi-Family (2-4 Unit). Listing-text estimate: 4 units. confirmed
Listing remarks
Perched above the city, this striking mid-century modern style fourplex captures sweeping views of downtown Tacoma, Commencement Bay, and the Tacoma Dome from every level. A true standout, the property features oversized units that live large and feel more like homes than apartments. The lower-level one-bedroom units span nearly 1,000 sqft each, complete with fully fenced yards and stunning views both inside and out in the large yards. Upstairs, the spacious two-bedroom units approach 1,100 sqft and showcase fully rebuilt decks with storage, plus incredible view from every north-facing window. Three of the four units have been beautifully renovated with fresh paint, updated lighting, new fl
Key facts
- Designer kitchen
- Full-size pantry
- Sweeping views
Tags
Property features AI
Finance
- Other: Calculated building area: 4,032 square feet; Building type: Quadruplex (4 units total); Units in building: 4
- Financial info: Gross scheduled income: $93,240; Gross adjusted income: $94,528; Total monthly income: $7,895; Net operating income: $66,004; Total expenses: $28,523; Insurance expense: $5,828; Other expense: $1,200; Gross rent multiplier: 11.7; Listing terms: Cash, Conventional, FHA, VA Loan
Exterior
- Parking: 5 covered parking spaces; 5 carport spaces; 2 uncovered parking spaces
- Security: Partially fenced
- Utilities: Electric service; Public water (Tacoma Public Utilities); Sewer connected (Tacoma Public Utilities)
- Home design: Residential income property (multi-family, quadruplex); Two-story building; Has a view
- Construction: Wood construction; Torch down roof; Poured concrete foundation; Effective year built: 1967
- Exterior features: Partial fencing; Deck; Patio; Outbuildings; Sprinkler system; Cable TV and high-speed internet available; Corner lot with alley access, curbs and paved access; Open space nearby
Interior
- Kitchen: Each unit includes range/oven; Each unit includes refrigerator; Each unit includes dishwasher
- Bedrooms: Two 2-bedroom units; Two 1-bedroom units
- Flooring: Vinyl plank; Carpet
- Bathrooms: Each unit has 1 bathroom
- Heating & cooling: Baseboard heating; No central cooling
- Interior features: Vinyl plank and carpet flooring; Thermal windows; Coin-operated laundry (on-site); Storage
- Laundry & utility: Coin-operated laundry on-site; Washer/dryer not provided in individual units
Neighborhood map
What this means for you Summary
Snapshot
- This is a 4 × 6-bed/4.0-bath units multifamily listed at $1000k.
Deal economics
- At list price, monthly cash flow is $2k ($28k/yr) — positive. Per door: $591/mo.
- The deal already cash-flows at list — no discount required.
- Meets the 1% rule at list price ($11k rent vs $1000k).
- Recommended offer: $970k (3.0% below list) — sets the bar for market timing.
- Cap rate 9.1% vs local median 2.9% in Tacoma — top-decile yield for the area; either an underpriced asset or a hidden risk that comps aren't pricing in. Stress-test before assuming the spread holds.
Location & tenants
- Location reads 78/100 on livability (#127 in WA, #2,535 nationally) — a middle-class / working-renter tenant base. Strengths: amenities A+, commute A+, housing A+; Watch: cost of living D, crime F.
- Tacoma School District (urban): math 40% / reading 53% proficiency, ranked #169 of 291 in WA (top 58%) — families likely to look elsewhere, expect single-tenant / working-renter base with shorter leases.
- Market conditions: Rents rising fast (+11.7%/yr); 56 active listings in the ZIP; solid renter incomes; 3,209 units permitted in Pierce County in 2024 (1,269 in 5+ unit buildings).
- At $11,285/mo this rent would consume 151% of the median local household income ($90k/yr) (locally 185% of renters already pay >50% of income on rent) — very limited rent-growth headroom before tenants either downsize or default.
Forward outlook
- Local home prices are declining (-3.0%/yr); year-one equity from $7k of loan paydown is wiped out by about $30k of value loss. Plan a longer hold.
- Pierce County population projected at +26% by 2050 — long-run rental-demand tailwind backs the buy-and-hold thesis.
- At projected returns (-3.0% appreciation + 8.0% rent growth), your $280k cash investment doubles in ~8 years — after that, you're playing with house money.
Negotiation context
- It's been on market 37 days — a 3% lower offer ($970k) is reasonable based on typical stale-listing flexibility.
- 3 sale attempts since 14y ago; this cycle's ask has dropped $90k (8%) from the opening price — seller is motivated, your offer sets the floor, not the list.
- Current owner paid $510k; list at $1000k implies a 96% gain — meaningful room to come down on a strong offer.
Questions for the listing agent
- It's been on market 37 days. Have you received any prior offers? Is the seller open to a 3% concession, seller financing, or rate buy-down credit?
- Can we see the unit-by-unit rent roll, current vacancy, and any below-market leases? What's the average tenancy length?
- What capital expenditures (roof, boiler, parking lot, exteriors) have been made in the last 5 years, and what's planned in the next 2?
- Built in 1967 — when were the roof, HVAC, electrical panel, plumbing, and water heater last replaced?
- Is there a deadline driving the sale (1031 exchange, divorce, estate, relocation)? That informs how much negotiation room exists.
- Schools are B-rated — typically a magnet for longer-tenancy family renters. What's the average tenant stay here, and is there a school-zone premium baked into asking?
- Crime grade is F in this area — have there been break-ins, vandalism, or insurance claims at this property in the last 3 years? What carrier currently insures it and at what premium?
- What's the average days-on-market for RENTAL listings here right now (not sales)? A rising rental-DOM trend means longer vacancies and softer asking-rent achievability than the comps imply.
- What's the recent tenant-quality profile in this submarket — average credit score on applications, eviction rate, late-payment / NSF rate, and stable-employment percentage? A property-management company in the area should have these aggregated.
- How much new apartment / multifamily construction is in the pipeline within 1–3 miles? Heavy new supply (>2% of stock underway) typically softens rents 12–24 months out; light construction supports rent growth.
Investment metrics
- 1% rule
- 1.13% ✓
- Cap rate
- 9.13%
- Cash-on-cash
- 10.14%
- DSCR
- 1.45
- GRM
- 7.4
CMA / ARV
No comps found within radius.
Projected returns pro-forma
-3.0% appreciation · 8.0% rent growth · sell at horizon
- IRR
- 4.2%
- Equity multiple
- 1.17×
- Total profit
- $48,191
- Equity at exit
- $149,096
- IRR
- 17.8%
- Equity multiple
- 2.81×
- Total profit
- $507,167
- Equity at exit
- $86,457
Cash invested: $279,986 (down + closing). Projections, not guarantees.
Landlord ↔ Tenant lean methodology
- Overall (STATE)
- 28 Tenant-Leaning
- State Washington
- 28 Tenant-Leaning · D+8
- County
- — inherits STATE
- City
- — inherits STATE
ZIP-level market 98418
- Home prices YoY
- -29.5%
- Rents YoY
- 11.7%
- Active inventory
- 56
- Price-to-rent
- 29.5×
Monthly cashflow live
- Estimated rent
- $11,285 medium interval (Pro) →
- Mortgage (P&I)
- −$5,244
- Tax from tax record
- −$889 /mo · $10,674/yr
- Insurance
- −$417
- HOA
- −$0
- Vacancy / Maint / Mgmt
- −$2,370
- Net cashflow
- $2,365
Break-even live
4-unit breakdown (identical units grouped — click to expand)
| Units | Beds | Baths | Est. rent |
|---|---|---|---|
| 4× units | 6 | 4 | $11,284 |
| #1 | 6 | 4 | $2,821 |
| #2 | 6 | 4 | $2,821 |
| #3 | 6 | 4 | $2,821 |
| #4 | 6 | 4 | $2,821 |
| Total (4 units) | $11,285 | ||
UW: 25.0% down · 7.5% · 30yr · 1.5% tax · 5.0% vac · 8.0% maint · 8.0% mgmt
Financing live
Cash to close
- Down payment
- $249,988
- Closing costs
- $29,998
- Reserves months
- —
- Total cash needed
- —
Loan-product check · same deal, 3 products live
Conventional
25% down · 7.5% · 30yr
- Down + closing
- —
- Monthly P&I
- —
- Monthly cashflow
- —
- DSCR
- —
- Eligible?
- —
Personal DTI + credit; lowest rate.
DSCR
20% down · 8.5% · 30yr
- Down + closing
- —
- Monthly P&I
- —
- Monthly cashflow
- —
- DSCR
- —
- Eligible?
- —
No personal income docs; deal must DSCR.
Hard money
10% down · 12.0% · 12mo
- Down + closing
- —
- Monthly P&I
- —
- Monthly cashflow
- —
- DSCR
- —
- Eligible?
- —
Short-term bridge; refi at stabilization.
Listing history 15 events
-
2026-06-18price $999,950 Active 37 DOM
-
2026-06-18days on market $1,049,950 Active 37 DOM
-
2026-06-17days on market $1,049,950 Active 36 DOM
-
2026-06-16days on market $1,049,950 Active 35 DOM
-
2026-06-15days on market $1,049,950 Active 34 DOM
-
2026-06-13days on market $1,049,950 Active 32 DOM
-
2026-06-13days on market $1,049,950 Active 31 DOM
-
2026-06-10price $1,049,950 Active 28 DOM
-
2026-06-09days on market $1,089,950 Active 28 DOM
-
2026-06-08days on market $1,089,950 Active 27 DOM
-
2026-06-07days on market $1,089,950 Active 26 DOM
-
2026-06-04days on market $1,089,950 Active 23 DOM
-
2026-06-03days on market $1,089,950 Active 22 DOM
-
2026-06-02remarks 699-char remark
-
2026-06-02$1,089,950 Active 21 DOM
ⓘ Source: listings_history table (triggers on properties + properties_extension) + one-shot
backfill from property_details.listing_events for pre-trigger history.
Tax reassessment forecast WA · Resets to sale price
- Current annual tax
- $10,674 · $889/mo
- Projected year-2 tax
- $10,674 · $889/mo
- Expected delta
- $0/yr ($0/mo · 0.0%)
ⓘ Screening estimate from a state-policy table — verify with the county assessor before closing.
Climate risk First Street
- Flood 1/10 Low FEMA zone X (unshaded) · 0% chance over 30 yrs
- Wildfire 1/10 Low
- Heat 3/10 Moderate 7 d/yr ≥86°F today · 15 d/yr by 30 yrs out
- Wind 1/10 Low
- Air quality 7/10 Severe 10 unhealthy d/yr today · 12 by 30 yrs out
Nearby sold comps map
Loading sold comps map…
Walkable amenities ~0.75 mi
Loading nearby amenities…
Taxation est. · year 1
- Rental income
- $135,420
- − Mortgage interest
- −$56,013
- − Property taxes
- −$10,674
- − Insurance
- −$5,000
- − Repairs & maintenance
- −$10,834
- − Management
- −$10,834
- − Depreciation
- −$29,089
- Taxable income
- $12,977
- Est. tax owed @ 24.0%
- −$3,114
- After-tax cash flow
- $25,268/yr
For passive investors: Depreciation is non-cash, so a rental often shows a tax loss while cash-flowing — sheltering income. Rental losses are passive: they offset passive income freely, and up to $25,000/yr can offset ordinary (W-2) income if you actively participate and your MAGI is under $100k (phasing out to $0 by $150k); unused losses carry forward. On sale, claimed depreciation is recaptured at up to 25%, and gains may owe capital-gains tax (a 1031 exchange can defer both). Figures are a year-1 estimate at your 24.0% rate — not tax advice; consult a CPA.
Schools (NCES district)
- District
- Tacoma School District
- NCES district ID
- 5308700
- Math proficiency
- 40% ▬ 0.00%
- Reading proficiency
- 53% ▲ 1.00%
- Median HH income
- $52,467
- Composite
- 42.25/100
- National rank
- #6987
- State rank
- #169 of 291 in WA
Livability — Tacoma
- Score
- 78/100
- State rank
- #127
- US rank
- #2535
Category grades
Schools grade is shown separately in the Schools card above.
Census & demographics
- Census place
- Tacoma, WA
- County
- Pierce County · 788,257 people
- City population
- 212,935
- Metro
- Seattle-Tacoma-Bellevue, WA
- Population (ZIP)
- 10,264
- Household income
- $89,706
- Rent vs Own
- Severe rent burden
- 185.0
Population outlook (Pierce County) Hauer SSP2
- Today (2025)
- 956,648 people
- By 2030
- 1,010,862 · +5.7%
- By 2040
- 1,113,170 · +16.4%
- By 2050
- 1,206,524 · +26.1%
- By 2075
- 1,436,425 · +50.2%
- By 2100
- 1,563,654 · +63.5%
Race, ethnicity, and origin ACS 2023
- Neighborhood character
- Diverse neighborhood (Simpson 0.69)
- Race & ethnicity
- White 53% Two or more races 19% Hispanic / Latino 14% Black 10% Asian 7% Native American 1%
- Hispanic origin (detail)
- Mexican 8%
- Common ancestry
- Portuguese 5% Slovak 4% Italian 1%
- Foreign-born
- 11% · Canada, South Korea, China
- Languages at home
- 85% English-only · Spanish 6% Other Asian/Pacific 3% Tagalog/Filipino 2%
Political lean MEDSL · Pierce
- 2024 margin
- D (+10.8) · D 53.9% · R 43.1% · Other 3.0%
- 2008→2024 swing
- -1.4pp toward R · 2008: 12.2pp · 2024: 10.8pp
- All cycles
- 2024: D+10.8 2020: D+11.2 2016: D+7.5 2012: D+11.0 2008: D+12.2
Not yet ingested
- Civics
- —
Market trends
- HPI YoY
- ▼ -172.36%
- Current HPI
- 411.7306
- Rent YoY
- ▲ 11.66%
- Metro
- Seattle-Tacoma-Bellevue, WA
- State GDP YoY
- ▲ 4.65%
- F500 in state
- 22
Industry mix (Fortune 500 HQ in WA)
| Industry | F500 HQs | Revenue |
|---|---|---|
| Retail | 2 | $269B |
|
||
| Technology / Retail | 1 | $638B |
|
||
| Technology | 1 | $245B |
|
||
| Telecommunications | 1 | $38B |
|
||
| Food / Beverage | 1 | $36B |
|
||
| Automotive / Trucks | 1 | $34B |
|
||
Price history
+215.9% since first listed9 events — show timeline
- 2026-06-02 Relisted — NWMLS as Distributed by MLS Grid
- 2026-04-10 Listed $1,089,950 NWMLS as Distributed by MLS Grid
- 2019-03-08 Sold (Public Records) $510,000 Public Records
- 2012-11-20 Delisted — NWMLS as Distributed by MLS Grid
- 2012-11-16 Sold (Public Records) $325,000 Public Records
- 2012-11-16 Sold (MLS) $325,000 NWMLS as Distributed by MLS Grid
- 2012-09-11 Pending — NWMLS as Distributed by MLS Grid
- 2012-08-02 Pending — NWMLS as Distributed by MLS Grid
- 2012-05-29 Listed $345,000 NWMLS as Distributed by MLS Grid
Property tax history
+4.4%/yrLatest (2026): $10,674 · +0.7% YoY. Source: county tax records.
Cash-flow waterfall
monthlySold comps — $/sqft
last 12 mo · ≤1 miLoading sold comps…