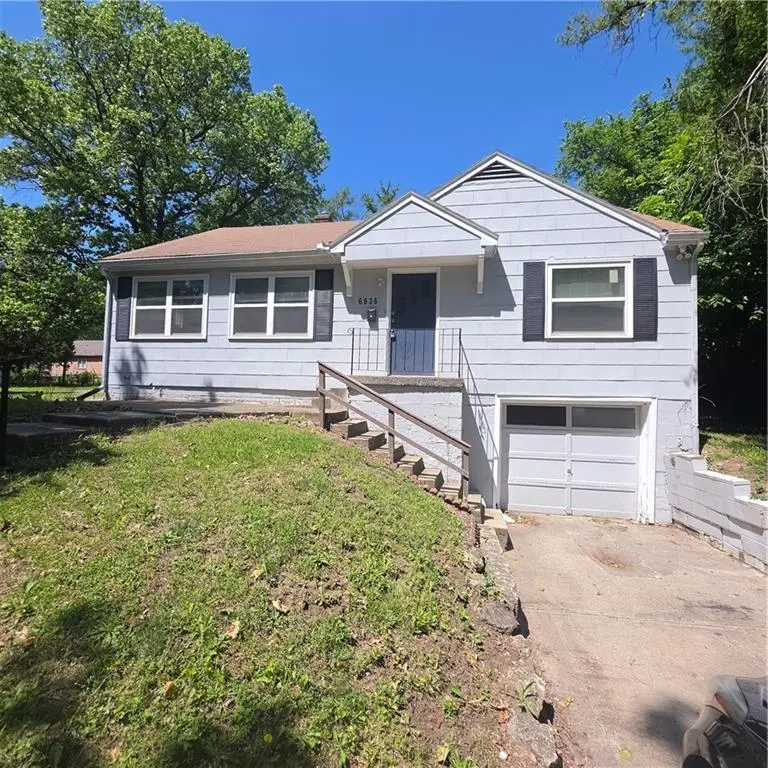
6636 Flora Ave · Kansas City, MO
Flood risk 1/10 · Minimal
- FEMA flood zone
- X (unshaded)
- Chance of flooding over 30 yrs
- 0.0%
- Est. flood insurance / yr
- $473 – $860
Fire risk 1/10 · Minimal
- Est. fire insurance / yr
- $1,054 – $1,958
Heat risk 4/10 · Minor
- Hot days now (above 106°F)
- 7 days/yr
- Hot days in 30 yrs
- 17 days/yr
Wind risk 2/10 · Minimal
- Chance of severe wind over 30 yrs
- —
Air-quality risk 3/10 · Minor
- Unhealthy air days now
- 2 days/yr
- Unhealthy air days in 30 yrs
- 4 days/yr
Risk factors via First Street. Map © Google.
Why this score? — see what drove the B grade
The composite is a weighted blend of 9 inputs, each scored 0–100. Each bar is that input's sub-score; the figure is the points it added to the 100-point composite (weight × sub-score).
- Cash flow +28.7/30.0
- ARV discount +15.0/15.0
- DSCR +10.0/10.0
- 1% rule +7.0/10.0
- Livability +3.9/5.0
- Rent growth +3.5/5.0
- Condition / age +2.5/5.0
- Schools +1.5/10.0
- Appreciation +0.0/10.0
$120,000
🖨 Deal sheet 📄 Offer letter ✓ Due diligence
Listing remarks
3 bed 1 bath raised ranch in the heart of KC. Kitchen has a nice refrigerator, stove, and dishwasher. Nice tile in the bathroom around shower. Ceiling fans in the bedrooms. Hardwood floors throughout, Newer windows. 1 car garage w/ opener. Renters just moved out. Now your chance to put a little work in this house and have instant sweat equity. Perfect for a rental or a flip or just to put a little work in and call it your own. Everything works. Move right in. Being sold "as is" "where is". No sellers disclosure.
Key facts
- Nice tile
- Ceiling fans
- Newer windows
Tags
Property features AI
Finance
- Other: Property listed as a fixer; above-grade finished area recorded at 988 (source: public records); Not in a flood plain; Estimated age: 51-75 years
- HOA & community: No association fees
Exterior
- Parking: Attached garage with 1 garage space; Basement garage entrance; Built-in parking
- Utilities: Public water; Public sewer
- Home design: Single-family residence; Raised ranch floor plan; Residential property
- Construction: Asbestos construction materials; Composition roof
- Exterior features: Fixer (property condition); City lot; Paved road with public maintenance
Interior
- Kitchen: Dishwasher; Disposal; Refrigerator; Electric range
- Bedrooms: 3 bedrooms (all on the main level)
- Flooring: Vinyl flooring; Wood flooring
- Bathrooms: 1 full bathroom with ceramic tile
- Heating & cooling: Natural gas heating; Electric cooling
- Interior features: Ceiling fans throughout
- Laundry & utility: Laundry in basement
Neighborhood map
What this means for you Summary
Snapshot
- This is a 3-bed/1.0-bath single-family listed at $120k.
Deal economics
- At list price, monthly cash flow is $399 ($5k/yr) — positive.
- The deal already cash-flows at list — no discount required.
- Meets the 1% rule at list price ($1k rent vs $120k).
- Recommended offer: $118k (1.5% below list) — sets the bar for market timing.
- Cap rate 10.3% vs local median 3.9% in Kansas City — top-decile yield for the area; either an underpriced asset or a hidden risk that comps aren't pricing in. Stress-test before assuming the spread holds.
Location & tenants
- Location reads 78/100 on livability (#28 in MO, #2,671 nationally) — a middle-class / working-renter tenant base. Strengths: amenities A+, commute A+, cost of living A+; Watch: schools C-, crime F.
- Kansas City 33 (urban): math 12% / reading 24% proficiency, ranked #308 of 324 in MO (top 95%) — low school quality limits family demand, transient renter base, plan for 1-2y turnover; 75% free/reduced lunch — lower-income household profile, screen leases tightly.
- Market conditions: Rents rising (+4.0%/yr); 131 active listings in the ZIP; 37 comparable units currently listed for rent nearby; rentals at typical pace (median 16d on market — plan ~3-4 weeks tenant-placement turnaround); 4,002 units permitted in Jackson County in 2024 (2,271 in 5+ unit buildings).
Forward outlook
- Local home prices are declining (-3.0%/yr); year-one equity from $830 of loan paydown is wiped out by about $4k of value loss. Plan a longer hold.
- Jackson County population projected at +4% by 2050 — modest demand growth; plan on rents tracking national, not racing it.
- At projected returns (-3.0% appreciation + 4.0% rent growth), your $34k cash investment doubles in ~8 years — after that, you're playing with house money.
Negotiation context
- It's been on market 19 days — a 2% lower offer ($118k) is reasonable based on typical stale-listing flexibility.
Risks & watch-outs
- Watch-outs: built in 1954 — expect roof / HVAC / electrical / plumbing capex.
Questions for the listing agent
- Built in 1954 — when were the roof, HVAC, electrical panel, plumbing, and water heater last replaced?
- Is there a deadline driving the sale (1031 exchange, divorce, estate, relocation)? That informs how much negotiation room exists.
- Crime grade is F in this area — have there been break-ins, vandalism, or insurance claims at this property in the last 3 years? What carrier currently insures it and at what premium?
- What's the average days-on-market for RENTAL listings here right now (not sales)? A rising rental-DOM trend means longer vacancies and softer asking-rent achievability than the comps imply.
- What's the recent tenant-quality profile in this submarket — average credit score on applications, eviction rate, late-payment / NSF rate, and stable-employment percentage? A property-management company in the area should have these aggregated.
- How much new for-sale + rental construction is in the pipeline within 1–3 miles? Heavy new supply typically softens prices + rents 12–24 months out; constrained supply supports both.
Investment metrics
- 1% rule
- 1.20% ✓
- Cap rate
- 10.29%
- Cash-on-cash
- 14.26%
- DSCR
- 1.63
- GRM
- 7.0
CMA / ARV
- ARV (on-the-fly)
- $147,212
- Comps found
- 12
Show comp detail 12 sales within ~0.75 mi
| Address | Dist | Beds/Ba | Sqft | Sold | Price | $/sf | Match |
|---|---|---|---|---|---|---|---|
| 6620 Flora Ave | 0.04mi | 3/2.0 | 1,037 (+5%) | 10mo | $180,000 | $174 | 77 |
| 6131 Tracy Ave | 0.59mi | 3/1.5 | 1,023 (+4%) | 2mo | $199,900 | $195 | 63 |
| 1213 E 66 Ter | 0.17mi | 2/1.0 (-1) | 866 (-12%) | 6mo | $129,000 | $149 | 61 |
| 2401 E 68th Ter | 0.67mi | 2/1.0 (-1) | 984 (-0%) | 6mo | $85,000 | $86 | 58 |
| 2230 E 67th Ter | 0.56mi | 2/1.0 (-1) | 897 (-9%) | 1mo | $99,900 | $111 | 53 |
| 6205 Forest Ave | 0.56mi | 2/1.0 (-1) | 1,055 (+7%) | 6mo | $150,000 | $142 | 53 |
| 7202 Lydia Ave | 0.72mi | 2/1.0 (-1) | 934 (-6%) | 2mo | $119,900 | $128 | 51 |
| 1917 E 71st Ter | 0.75mi | 2/1.0 (-1) | 972 (-2%) | 13mo | $89,000 | $92 | 47 |
| 6207 Forest Ave | 0.56mi | 2/1.0 (-1) | 874 (-12%) | 6mo | $130,000 | $149 | 45 |
| 6551 Holmes Rd | 0.51mi | 3/1.5 | 1,132 (+15%) | 10mo | $285,000 | $252 | 42 |
| 1901 E 70th Ter | 0.60mi | 3/1.0 | 1,131 (+14%) | 13mo | $154,950 | $137 | 37 |
| 6143 Forest Ave | 0.59mi | 2/2.5 (-1) | 1,134 (+15%) | 10mo | $184,900 | $163 | 29 |
Match score weights: distance 35% · size 25% · config 20% · recency 20%. Top-matched comps best support the ARV.
Projected returns pro-forma
-3.0% appreciation · 3.97% rent growth · sell at horizon
- IRR
- 5.6%
- Equity multiple
- 1.22×
- Total profit
- $7,360
- Equity at exit
- $17,892
- IRR
- 15.8%
- Equity multiple
- 2.34×
- Total profit
- $44,916
- Equity at exit
- $10,375
Cash invested: $33,600 (down + closing). Projections, not guarantees.
Landlord ↔ Tenant lean methodology
- Overall (STATE)
- 81 Strongly Landlord-Friendly
- State Missouri
- 81 Strongly Landlord-Friendly · R+10
- County
- — inherits STATE
- City
- — inherits STATE
ZIP-level market 64131
- Rents YoY
- 4.0%
- Active inventory
- 131
- Price-to-rent
- 7.0×
Monthly cashflow live
- Estimated rent
- $1,434 high interval (Pro) →
- Mortgage (P&I)
- −$629
- Tax from tax record
- −$54 /mo · $653/yr
- Insurance
- −$50
- HOA
- −$0
- Vacancy / Maint / Mgmt
- −$301
- Net cashflow
- $399
Break-even live
UW: 25.0% down · 7.5% · 30yr · 1.5% tax · 5.0% vac · 8.0% maint · 8.0% mgmt
Financing live
Cash to close
- Down payment
- $30,000
- Closing costs
- $3,600
- Reserves months
- —
- Total cash needed
- —
Loan-product check · same deal, 3 products live
Conventional
25% down · 7.5% · 30yr
- Down + closing
- —
- Monthly P&I
- —
- Monthly cashflow
- —
- DSCR
- —
- Eligible?
- —
Personal DTI + credit; lowest rate.
DSCR
20% down · 8.5% · 30yr
- Down + closing
- —
- Monthly P&I
- —
- Monthly cashflow
- —
- DSCR
- —
- Eligible?
- —
No personal income docs; deal must DSCR.
Hard money
10% down · 12.0% · 12mo
- Down + closing
- —
- Monthly P&I
- —
- Monthly cashflow
- —
- DSCR
- —
- Eligible?
- —
Short-term bridge; refi at stabilization.
Rent comps 37 comps
| Address | Beds | Baths | Sqft | Rent | $/sqft | DOM | Units | Dist |
|---|---|---|---|---|---|---|---|---|
| 6653 Lydia Ave Kansas City, MO | 3.0 | 1.0 | 962 | $1,500 | $1.56 | 16d | 1 | 0.07mi |
| 1435 E 66th Ter Kansas City, MO | 3.0 | 1.0 | 988 | $1,340 | $1.36 | 12d | 1 | 0.07mi |
| 6404 The Paseo Kansas City, MO | 1.0–2.0 | 1.0–2.0 | 942 | $1,600 | $1.70 | 2d | 6 | 0.27mi |
| 1805 E 67th St Kansas City, MO | 2.0 | 1.0 | 1064 | $1,200 | $1.13 | 16d | 1 | 0.27mi |
| 1831 E 68th St Kansas City, MO | 3.0 | 1.0 | 1043 | $1,250 | $1.20 | 16d | 1 | 0.39mi |
| 6551 Rockhill Rd Kansas City, MO | 1.0–2.0 | 1.0–2.0 | 912 | $2,128 | $2.33 | 1d | 10 | 0.39mi |
| 6518 Rockhill Rd Kansas City, MO | 2.0 | 1.0 | 900 | $2,090 | $2.32 | 43d | 1 | 0.42mi |
| 6512 Rockhill Rd Kansas City, MO | 2.0 | 1.0 | 900 | $1,990 | $2.21 | 1d | 1 | 0.43mi |
| 2120 E 68th Ter Kansas City, MO | 2.0 | 1.0 | 930 | $1,200 | $1.29 | 23d | 1 | 0.54mi |
| 1702 Bushman Dr Kansas City, MO | 1.0–2.0 | 1.0–2.0 | 895 | $1,065 | $1.19 | 43d | 1 | 0.64mi |
| 662 E 63rd St Kansas City, MO | 2.0 | 2.0 | 951 | $1,655 | $1.74 | 44d | 1 | 0.67mi |
| 2421 E 67th Ter Kansas City, MO | 2.0 | 1.0 | 816 | $1,125 | $1.38 | 16d | 1 | 0.69mi |
| 2430 E 67th Ter Kansas City, MO | 3.0 | 2.0 | 960 | $1,195 | $1.24 | 43d | 1 | 0.69mi |
| 6024 Tracy Ave Kansas City, MO | 3.0 | 1.0 | 1000 | $1,250 | $1.25 | 16d | 1 | 0.71mi |
| 6014 Virginia Ave Kansas City, MO | 2.0 | 1.0 | 1072 | $1,111 | $1.04 | 7d | 1 | 0.73mi |
| 2422 E 70th Ter Kansas City, MO | 2.0 | 1.0 | 748 | $1,356 | $1.81 | 12d | 1 | 0.86mi |
| 2205 E 59th St Kansas City, MO | 2.0 | 1.0 | 724 | $1,025 | $1.42 | 16d | 1 | 1.00mi |
| 7022 S Benton Ave Kansas City, MO | 3.0 | 1.5 | 1100 | $1,095 | $1.00 | 14d | 1 | 1.05mi |
| 7427 Arleta Blvd Kansas City, MO | 2.0 | 1.0 | 805 | $1,150 | $1.43 | 43d | 1 | 1.08mi |
| 2100 E 58th St Kansas City, MO | 2.0 | 1.0 | 1030 | $1,500 | $1.46 | 43d | 1 | 1.11mi |
| 5730 Garfield Ave Kansas City, MO | 3.0 | 1.0 | 866 | $1,195 | $1.38 | 16d | 1 | 1.12mi |
| 6703 Walrond Ave Kansas City, MO | 2.0 | 1.0 | 912 | $1,200 | $1.32 | 2d | 1 | 1.12mi |
| 2512 E 59th St Kansas City, MO | 2.0 | 1.0 | 750 | $1,150 | $1.53 | 43d | 1 | 1.14mi |
| 5702 Euclid Ave Kansas City, MO | 2.0 | 1.0 | 683 | $1,000 | $1.46 | 43d | 1 | 1.17mi |
| 7036 Bellefontaine Ave Unit A Kansas City, MO | 2.0 | 1.0 | 810 | $1,200 | $1.48 | 2d | 1 | 1.17mi |
| 5713 Brooklyn Ave Kansas City, MO | 2.0 | 1.0 | 600 | $1,200 | $2.00 | 7d | 1 | 1.19mi |
| 7133 Agnes Ave Kansas City, MO | 3.0 | 2.0 | 1100 | $1,645 | $1.50 | 23d | 1 | 1.20mi |
| 7411 Montgall Ave Kansas City, MO | 3.0 | 1.0 | 840 | $1,200 | $1.43 | 43d | 1 | 1.29mi |
| 7317 Agnes Ave Kansas City, MO | 2.0 | 1.0 | 767 | $895 | $1.17 | 23d | 1 | 1.34mi |
| 5529 Michigan Ave Kansas City, MO | 2.0 | 1.0 | 847 | $995 | $1.17 | 43d | 1 | 1.34mi |
| 7605 Locust St Kansas City, MO | 2.0 | 1.0 | 744 | $1,325 | $1.78 | 7d | 1 | 1.40mi |
| 6029 Indiana Ave Kansas City, MO | 2.0 | 1.0 | 832 | $1,150 | $1.38 | 43d | 1 | 1.42mi |
| 5446 Harrison St Unit 2F Kansas City, MO | 2.0 | 1.0 | 960 | $1,099 | $1.14 | 14d | 1 | 1.43mi |
| 7412 Bellefontaine Ave Unit A Kansas City, MO | 2.0 | 1.0 | 780 | $1,200 | $1.54 | 2d | 1 | 1.44mi |
| 5436 Harrison St Unit 1F Kansas City, MO | 2.0 | 1.0 | 1050 | $1,195 | $1.14 | 43d | 1 | 1.46mi |
| 7115 Bales Ave Kansas City, MO | 3.0 | 1.0 | 865 | $1,350 | $1.56 | 16d | 1 | 1.46mi |
| 7127 Bales Ave Kansas City, MO | 3.0 | 1.0 | 900 | $1,350 | $1.50 | 23d | 1 | 1.47mi |
Listing history 8 events
-
2026-06-05days on market $120,000 Active 19 DOM
-
2026-06-03days on market $120,000 Active 18 DOM
-
2026-06-02days on market $120,000 Active 17 DOM
-
2026-06-01days on market $120,000 Active 16 DOM
-
2026-05-31days on market $120,000 Active 15 DOM
-
2026-05-16$120,000 Active
-
2019-09-19soldstatus
-
1986-09-15soldstatus
ⓘ Source: listings_history table (triggers on properties + properties_extension) + one-shot
backfill from property_details.listing_events for pre-trigger history.
Tax reassessment forecast MO · Resets to sale price
- Current annual tax
- $653 · $54/mo
- Projected year-2 tax
- $1,164 · $97/mo
- Expected delta
- +$511/yr (+$43/mo · 78.2%)
ⓘ Screening estimate from a state-policy table — verify with the county assessor before closing.
Climate risk First Street
- Flood 1/10 Low FEMA zone X (unshaded) · 0% chance over 30 yrs
- Wildfire 1/10 Low
- Heat 4/10 Moderate 7 d/yr ≥106°F today · 17 d/yr by 30 yrs out
- Wind 2/10 Low
- Air quality 3/10 Moderate 2 unhealthy d/yr today · 4 by 30 yrs out
Nearby sold comps map
Loading sold comps map…
Walkable amenities ~0.75 mi
Loading nearby amenities…
Taxation est. · year 1
- Rental income
- $17,210
- − Mortgage interest
- −$6,722
- − Property taxes
- −$653
- − Insurance
- −$600
- − Repairs & maintenance
- −$1,377
- − Management
- −$1,377
- − Depreciation
- −$3,491
- Taxable income
- $2,990
- Est. tax owed @ 24.0%
- −$718
- After-tax cash flow
- $4,073/yr
For passive investors: Depreciation is non-cash, so a rental often shows a tax loss while cash-flowing — sheltering income. Rental losses are passive: they offset passive income freely, and up to $25,000/yr can offset ordinary (W-2) income if you actively participate and your MAGI is under $100k (phasing out to $0 by $150k); unused losses carry forward. On sale, claimed depreciation is recaptured at up to 25%, and gains may owe capital-gains tax (a 1031 exchange can defer both). Figures are a year-1 estimate at your 24.0% rate — not tax advice; consult a CPA.
Schools (NCES district)
- District
- Kansas City 33
- NCES district ID
- 2916400
- Math proficiency
- 12% ▼ -8.00%
- Reading proficiency
- 24% ▬ 0.00%
- Median HH income
- $35,227
- Composite
- 14.8/100
- National rank
- #9387
- State rank
- #308 of 324 in MO
Livability — Kansas City
- Score
- 78/100
- State rank
- #28
- US rank
- #2671
Category grades
Schools grade is shown separately in the Schools card above.
Census & demographics
- Census place
- Kansas City, MO
- County
- Jackson County · 687,798 people
- City population
- 439,467
- Metro
- Kansas City, MO-KS
- Population (ZIP)
- 21,942
- Household income
- $64,201
- Rent vs Own
- Severe rent burden
- 1249.0
Population outlook (Jackson County) Hauer SSP2
- Today (2025)
- 719,589 people
- By 2030
- 731,456 · +1.6%
- By 2040
- 746,689 · +3.8%
- By 2050
- 749,289 · +4.1%
- By 2075
- 736,227 · +2.3%
- By 2100
- 668,210 · -7.1%
Race, ethnicity, and origin ACS 2023
- Neighborhood character
- Diverse neighborhood (Simpson 0.61)
- Race & ethnicity
- White 48% Black 39% Hispanic / Latino 7% Two or more races 7% Asian 1%
- Hispanic origin (detail)
- Mexican 3%
- Common ancestry
- Italian 5% Slovak 1% Lithuanian 1%
- Foreign-born
- 5% · Canada, Vietnam
- Languages at home
- 93% English-only · Spanish 3% French/Haitian/Cajun 1%
Political lean MEDSL · Jackson
- 2024 margin
- D (+19.3) · D 58.9% · R 39.5% · Other 1.6%
- 2008→2024 swing
- -6.1pp toward R · 2008: 25.4pp · 2024: 19.3pp
- All cycles
- 2024: D+19.3 2020: D+22.0 2016: D+16.6 2012: D+19.0 2008: D+25.4
Not yet ingested
- Civics
- —
Market trends
- HPI YoY
- ▼ -253.25%
- Current HPI
- 340.8202
- Rent YoY
- ▲ 3.97%
- Metro
- Kansas City, MO-KS
- State GDP YoY
- ▲ 1.84%
- F500 in state
- 20
Industry mix (Fortune 500 HQ in MO)
| Industry | F500 HQs | Revenue |
|---|---|---|
| Healthcare | 1 | $163B |
|
||
| Insurance | 1 | $21B |
|
||
| Industrial Technology | 1 | $17B |
|
||
| Retail | 1 | $16B |
|
||
| Industrial Distribution | 1 | $10B |
|
||
| Utilities | 1 | $9B |
|
||
Price history
3 events — show timeline
- 2026-05-16 Listed $120,000 Heartland MLS as Distributed by MLS Grid
- 2019-09-19 Sold (Public Records) — Public Records
- 1986-09-15 Sold (Public Records) — Public Records
Property tax history
+5.1%/yrLatest (2025): $653 · -8.9% YoY. Source: county tax records.
Cash-flow waterfall
monthlySold comps — $/sqft
last 12 mo · ≤1 miLoading sold comps…