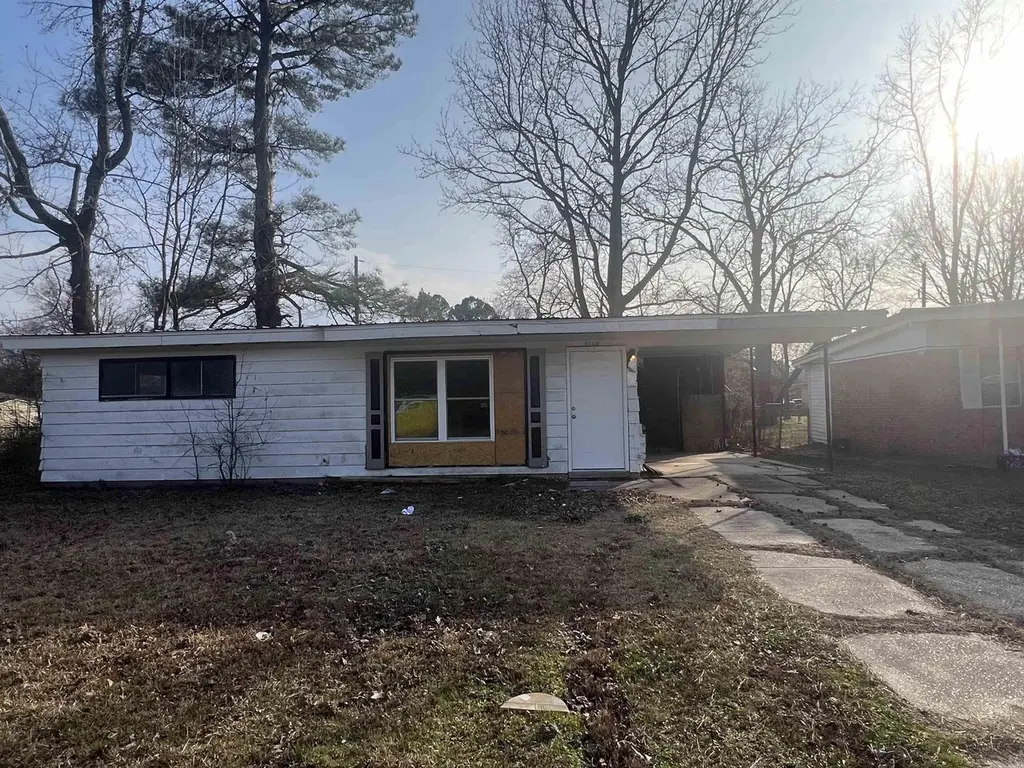
3100 Jonquil St · Pine Bluff, AR
Flood risk 1/10 · Minimal
- FEMA flood zone
- X (unshaded)
- Chance of flooding over 30 yrs
- 0.0%
- Est. flood insurance / yr
- $507 – $1,088
Fire risk 1/10 · Minimal
- Est. fire insurance / yr
- $1,499 – $2,785
Heat risk 6/10 · Moderate
- Hot days now (above 110°F)
- 7 days/yr
- Hot days in 30 yrs
- 19 days/yr
Wind risk 4/10 · Minor
- Chance of severe wind over 30 yrs
- 22.0%
Air-quality risk 1/10 · Minimal
- Unhealthy air days now
- 0 days/yr
- Unhealthy air days in 30 yrs
- 0 days/yr
Risk factors via First Street. Map © Google.
Why this score? — see what drove the C+ grade
The composite is a weighted blend of 9 inputs, each scored 0–100. Each bar is that input's sub-score; the figure is the points it added to the 100-point composite (weight × sub-score).
- Cash flow +28.3/30.0
- DSCR +10.0/10.0
- ARV discount +7.5/15.0
- 1% rule +6.5/10.0
- Rent growth +2.5/5.0
- Livability +2.5/5.0
- Condition / age +2.5/5.0
- Schools +1.0/10.0
- Appreciation +0.0/10.0
$70,000
🖨 Deal sheet 📄 Offer letter ✓ Due diligence
Listing remarks MLS
This property would be a nice addition to your rental portfolio. Much of the remodeling has already been done for you. Come by and see this property today.
Key facts
- 8,276 sq ft lot
- Parking
- Built 1950
Neighborhood map
What this means for you Summary
Snapshot
- This is a 2-bed/1.0-bath single-family listed at $70k.
Deal economics
- At list price, monthly cash flow is $225 ($3k/yr) — positive.
- The deal already cash-flows at list — no discount required.
- Meets the 1% rule at list price ($804 rent vs $70k).
- Recommended offer: $64k (9.0% below list) — sets the bar for market timing.
Location & tenants
- Location reads 50/100 on livability (#483 in AR) — a working-class tenant base; expect higher turnover. Strengths: cost of living A+, housing A; Watch: schools F, crime F, amenities F.
- Watson Chapel School District (urban): math 10% / reading 12% proficiency, ranked #228 of 238 in AR (top 96%) — low school quality limits family demand, transient renter base, plan for 1-2y turnover; 68% free/reduced lunch — lower-income household profile, screen leases tightly.
- Market conditions: 212 active listings in the ZIP; 12 comparable units currently listed for rent nearby; rentals lingering (median 44d on market — plan ~5-8 weeks vacancy on turnover, expect pricing pressure); 100% of comp listings sitting > 30 days — soft ceiling on asking rent; 62 units permitted in Jefferson County in 2024 (0 in 5+ unit buildings).
Forward outlook
- Local home prices are declining (-3.0%/yr); year-one equity from $484 of loan paydown is wiped out by about $2k of value loss. Plan a longer hold.
- Jefferson County population projected at -33% by 2050 — secular population decline; favor cash flow + early exit over multi-decade hold.
- At projected returns (-3.0% appreciation + 3.0% rent growth), your $20k cash investment doubles in ~9 years — after that, you're playing with house money.
Negotiation context
- It's been on market 118 days — a 9% lower offer ($64k) is reasonable based on typical stale-listing flexibility.
- 3 sale attempts since 2y ago with the ask held roughly flat each time — persistent listings suggest the price (not the market) is what's stuck; bring a comps-based counter.
Risks & watch-outs
- Watch-outs: built in 1950 — expect roof / HVAC / electrical / plumbing capex.
- Climate carrying-cost: extreme-heat days projected 7→19/yr by 2055 (HVAC capex compounding) — expect insurance premiums to compound above CPI over the hold.
Questions for the listing agent
- It's been on market 118 days. Have you received any prior offers? Is the seller open to a 9% concession, seller financing, or rate buy-down credit?
- Built in 1950 — when were the roof, HVAC, electrical panel, plumbing, and water heater last replaced?
- Why hasn't it sold? Are there any deal-killer items the seller is aware of (foundation, flood, title, zoning, code violations)?
- Is there a deadline driving the sale (1031 exchange, divorce, estate, relocation)? That informs how much negotiation room exists.
- Schools are F-rated, which usually means shorter tenancies and higher turnover. Who's the typical renter profile here, and what's been the actual vacancy rate?
- Crime grade is F in this area — have there been break-ins, vandalism, or insurance claims at this property in the last 3 years? What carrier currently insures it and at what premium?
- What's the average days-on-market for RENTAL listings here right now (not sales)? A rising rental-DOM trend means longer vacancies and softer asking-rent achievability than the comps imply.
- What's the recent tenant-quality profile in this submarket — average credit score on applications, eviction rate, late-payment / NSF rate, and stable-employment percentage? A property-management company in the area should have these aggregated.
- How much new for-sale + rental construction is in the pipeline within 1–3 miles? Heavy new supply typically softens prices + rents 12–24 months out; constrained supply supports both.
Investment metrics
- 1% rule
- 1.15% ✓
- Cap rate
- 10.14%
- Cash-on-cash
- 13.75%
- DSCR
- 1.61
- GRM
- 7.3
CMA / ARV
- ARV (median comp)
- $32,931
- List price
- $70,000
- Delta
- 112.57%
- Verdict
- OVERPRICED
- Comps
- 20 within 1.0 mi
Show comp detail 10 sales within ~0.75 mi
| Address | Dist | Beds/Ba | Sqft | Sold | Price | $/sf | Match |
|---|---|---|---|---|---|---|---|
| 3400 Jonquil | 0.17mi | 2/1.0 | 850 (0%) | 22mo | $13,636 | $16 | 73 |
| 3105 Jonquil | 0.04mi | 2/1.0 | 806 (-5%) | 22mo | $13,636 | $17 | 71 |
| 3307 S Iris St | 0.19mi | 2/1.0 | 750 (-12%) | 3mo | $9,000 | $12 | 69 |
| 3103 Jonquil | 0.03mi | 2/1.0 | 775 (-9%) | 22mo | $13,636 | $18 | 65 |
| 3201 Jonquil | 0.04mi | 2/1.0 | 775 (-9%) | 22mo | $13,636 | $18 | 65 |
| 3201 Rose | 0.09mi | 2/1.0 | 775 (-9%) | 22mo | $13,636 | $18 | 62 |
| 3303 Rose | 0.13mi | 2/1.0 | 775 (-9%) | 22mo | $13,636 | $18 | 61 |
| 2804 W 30th Ave | 0.55mi | 3/1.0 (+1) | 925 (+9%) | 1mo | $40,000 | $43 | 54 |
| 2813 S Orlando | 0.56mi | 3/1.0 (+1) | 974 (+15%) | 4mo | $92,750 | $95 | 41 |
| 1600 Willow | 0.70mi | 2/1.0 | 896 (+5%) | 21mo | $15,000 | $17 | 41 |
Match score weights: distance 35% · size 25% · config 20% · recency 20%. Top-matched comps best support the ARV.
Projected returns pro-forma
-3.0% appreciation · 3.0% rent growth · sell at horizon
- IRR
- 3.9%
- Equity multiple
- 1.15×
- Total profit
- $2,928
- Equity at exit
- $10,437
- IRR
- 13.3%
- Equity multiple
- 2.06×
- Total profit
- $20,834
- Equity at exit
- $6,052
Cash invested: $19,600 (down + closing). Projections, not guarantees.
Landlord ↔ Tenant lean methodology
- Overall (STATE)
- 92 Strongly Landlord-Friendly
- State Arkansas
- 92 Strongly Landlord-Friendly · R+14
- County
- — inherits STATE
- City
- — inherits STATE
ZIP-level market 71603
- Home prices YoY
- -26.0%
- Active inventory
- 212
- Price-to-rent
- 7.3×
Monthly cashflow live
- Estimated rent
- $804 high interval (Pro) →
- Mortgage (P&I)
- −$367
- Tax from tax record
- −$14 /mo · $169/yr
- Insurance
- −$29
- HOA
- −$0
- Vacancy / Maint / Mgmt
- −$169
- Net cashflow
- $225
Break-even live
UW: 25.0% down · 7.5% · 30yr · 1.5% tax · 5.0% vac · 8.0% maint · 8.0% mgmt
Financing live
Cash to close
- Down payment
- $17,500
- Closing costs
- $2,100
- Reserves months
- —
- Total cash needed
- —
Loan-product check · same deal, 3 products live
Conventional
25% down · 7.5% · 30yr
- Down + closing
- —
- Monthly P&I
- —
- Monthly cashflow
- —
- DSCR
- —
- Eligible?
- —
Personal DTI + credit; lowest rate.
DSCR
20% down · 8.5% · 30yr
- Down + closing
- —
- Monthly P&I
- —
- Monthly cashflow
- —
- DSCR
- —
- Eligible?
- —
No personal income docs; deal must DSCR.
Hard money
10% down · 12.0% · 12mo
- Down + closing
- —
- Monthly P&I
- —
- Monthly cashflow
- —
- DSCR
- —
- Eligible?
- —
Short-term bridge; refi at stabilization.
Rent comps 12 comps
| Address | Beds | Baths | Sqft | Rent | $/sqft | DOM | Units | Dist |
|---|---|---|---|---|---|---|---|---|
| 3109 Daffodil St Pine Bluff, AR | 3.0 | 1.0 | 980 | $825 | $0.84 | 43d | 1 | 0.16mi |
| 3720 Miramar Dr Unit 13 Pine Bluff, AR | 1.0 | 1.0 | 550 | $650 | $1.18 | 43d | 1 | 0.31mi |
| 2319 W 27th Ave Unit B Pine Bluff, AR | 2.0 | 1.0 | 907 | $795 | $0.88 | 43d | 1 | 0.58mi |
| 2600 W 30th Ave Unit 2 Pine Bluff, AR | 1.0 | 1.0 | 570 | $650 | $1.14 | 43d | 1 | 0.60mi |
| 2001 W 28th Ave Pine Bluff, AR | 2.0 | 1.0 | 729 | $750 | $1.03 | 43d | 1 | 0.83mi |
| 1907 W 28th Ave Pine Bluff, AR | 3.0 | 1.5 | 947 | $1,150 | $1.21 | 43d | 1 | 0.85mi |
| 4324 Union Ave Pine Bluff, AR | 2.0 | 1.0 | 702 | $650 | $0.93 | 43d | 1 | 1.10mi |
| 1107 S Cypress St Unit 1 Pine Bluff, AR | 2.0 | 1.0 | 875 | $700 | $0.80 | 43d | 1 | 1.16mi |
| 2810 S Poplar St Unit 8 Pine Bluff, AR | 1.0 | 1.0 | 1040 | $759 | $0.73 | 43d | 1 | 1.39mi |
| 2100 W 40th Ave Pine Bluff, AR | 1.0 | 1.0 | 711 | $650 | $0.91 | 43d | 2 | 1.40mi |
| 1901 W 40th Ave Pine Bluff, AR | 2.0 | 1.0 | 854 | $765 | $0.90 | 43d | 1 | 1.42mi |
| 3008 S Elm St Pine Bluff, AR | 2.0 | 1.0 | 802 | $1,200 | $1.50 | 43d | 1 | 1.49mi |
Listing history 24 events
-
2026-06-19days on market $70,000 Active 118 DOM
-
2026-06-18days on market $70,000 Active 117 DOM
-
2026-06-17days on market $70,000 Active 116 DOM
-
2026-06-16days on market $70,000 Active 115 DOM
-
2026-06-15days on market $70,000 Active 114 DOM
-
2026-06-14days on market $70,000 Active 112 DOM
-
2026-06-12days on market $70,000 Active 111 DOM
-
2026-06-09days on market $70,000 Active 108 DOM
-
2026-06-08days on market $70,000 Active 107 DOM
-
2026-06-07days on market $70,000 Active 106 DOM
-
2026-06-05days on market $70,000 Active 103 DOM
-
2026-06-03days on market $70,000 Active 102 DOM
-
2026-06-02days on market $70,000 Active 101 DOM
-
2026-06-01days on market $70,000 Active 100 DOM
-
2026-05-31days on market $70,000 Active 99 DOM
-
2026-05-30days on market $70,000 Active 98 DOM
-
2026-02-16$70,000 New Listing 155-char remark
Show marketing remark (155 chars)
This property would be a nice addition to your rental portfolio. Much of the remodeling has already been done for you. Come by and see this property today.
-
2025-03-14soldstatus $85,000 199-char remark
Show marketing remark (199 chars)
Bundel of 12 houses and 3 vacant lots. 3100,3408,3203,3402,3313,3205, 3306,3202,3311 Jonquil 3301,3307,3303 S Iris 3004 N Iris 3404 Rose 2104 Howard All in the Miramar Add, Pine Bluff Jefferson Co AR
-
2025-03-14$85,000 199-char remark
Show marketing remark (199 chars)
Bundel of 12 houses and 3 vacant lots. 3100,3408,3203,3402,3313,3205, 3306,3202,3311 Jonquil 3301,3307,3303 S Iris 3004 N Iris 3404 Rose 2104 Howard All in the Miramar Add, Pine Bluff Jefferson Co AR
-
2025-03-13soldstatus $85,000
-
2025-01-27status Under Contract
-
2025-01-24historical
-
2024-12-02$15,000 New Listing
-
2000-07-21soldstatus $11,000
ⓘ Source: listings_history table (triggers on properties + properties_extension) + one-shot
backfill from property_details.listing_events for pre-trigger history.
Tax reassessment forecast AR · Resets to sale price
- Current annual tax
- $169 · $14/mo
- Projected year-2 tax
- $448 · $37/mo
- Expected delta
- +$279/yr (+$23/mo · 165.7%)
ⓘ Screening estimate from a state-policy table — verify with the county assessor before closing.
Climate risk First Street
- Flood 1/10 Low FEMA zone X (unshaded) · 0% chance over 30 yrs
- Wildfire 1/10 Low
- Heat 6/10 Major 7 d/yr ≥110°F today · 19 d/yr by 30 yrs out
- Wind 4/10 Moderate 22% chance of damaging wind over 30 yrs
- Air quality 1/10 Low 0 unhealthy d/yr today · 0 by 30 yrs out
Nearby sold comps map
Loading sold comps map…
Walkable amenities ~0.75 mi
Loading nearby amenities…
Taxation est. · year 1
- Rental income
- $9,644
- − Mortgage interest
- −$3,921
- − Property taxes
- −$169
- − Insurance
- −$350
- − Repairs & maintenance
- −$772
- − Management
- −$772
- − Depreciation
- −$2,036
- Taxable income
- $1,625
- Est. tax owed @ 24.0%
- −$390
- After-tax cash flow
- $2,305/yr
For passive investors: Depreciation is non-cash, so a rental often shows a tax loss while cash-flowing — sheltering income. Rental losses are passive: they offset passive income freely, and up to $25,000/yr can offset ordinary (W-2) income if you actively participate and your MAGI is under $100k (phasing out to $0 by $150k); unused losses carry forward. On sale, claimed depreciation is recaptured at up to 25%, and gains may owe capital-gains tax (a 1031 exchange can defer both). Figures are a year-1 estimate at your 24.0% rate — not tax advice; consult a CPA.
Schools (NCES district)
- District
- Watson Chapel School District
- NCES district ID
- 0513930
- Math proficiency
- 10% ▼ -11.00%
- Reading proficiency
- 12% ▼ -10.00%
- Median HH income
- $40,521
- Composite
- 9.55/100
- National rank
- #9845
- State rank
- #228 of 238 in AR
Livability — Pine Bluff
- Score
- 50/100
- State rank
- #483
- US rank
- #25645
Category grades
Schools grade is shown separately in the Schools card above.
Census & demographics
- Census place
- Pine Bluff, AR
- County
- Jefferson County · 29,578 people
- City population
- 29,578
- Metro
- Pine Bluff, AR
- Population (ZIP)
- 29,578
- Household income
- $53,130
- Rent vs Own
- Severe rent burden
- 657.0
Population outlook (Jefferson County) Hauer SSP2
- Today (2025)
- 63,110 people
- By 2030
- 58,519 · -7.3%
- By 2040
- 49,740 · -21.2%
- By 2050
- 42,331 · -32.9%
- By 2075
- 29,591 · -53.1%
- By 2100
- 21,047 · -66.7%
Race, ethnicity, and origin ACS 2023
- Neighborhood character
- Majority Black (62%)
- Race & ethnicity
- Black 62% White 33% Two or more races 2% Hispanic / Latino 2%
- Common ancestry
- Italian 2% Slovak 1%
- Foreign-born
- 2% · Canada
- Languages at home
- 98% English-only · Spanish 1%
Political lean MEDSL · Jefferson
- 2024 margin
- Strong D (+20.1) · D 59.2% · R 39.2% · Other 1.6%
- 2008→2024 swing
- -6.2pp toward R · 2008: 26.3pp · 2024: 20.1pp
- All cycles
- 2024: D+20.1 2020: D+21.7 2016: D+25.3 2012: D+29.0 2008: D+26.3
Not yet ingested
- Civics
- —
Market trends
- HPI YoY
- ▼ -72.43%
- Current HPI
- 206.5994
- Rent YoY
- —
- Metro
- Pine Bluff, AR
- State GDP YoY
- ▲ 3.80%
- F500 in state
- 10
Industry mix (Fortune 500 HQ in AR)
| Industry | F500 HQs | Revenue |
|---|---|---|
| Retail | 1 | $681B |
|
||
| Food / Agriculture | 1 | $53B |
|
||
| Retail / Energy | 1 | $22B |
|
||
| Transportation / Logistics | 1 | $12B |
|
||
| Energy | 1 | $4B |
|
||
Price history
+536.4% since first listed8 events — show timeline
- 2026-02-16 Listed $70,000 CARMLS
- 2025-03-14 Listed $85,000 CARMLS
- 2025-03-14 Sold (MLS) $85,000 CARMLS
- 2025-03-13 Sold (Public Records) $85,000 Public Records
- 2025-01-27 Pending — CARMLS
- 2025-01-24 Listing Removed — CARMLS
- 2024-12-02 Listed $15,000 CARMLS
- 2000-07-21 Sold (Public Records) $11,000 Public Records
Property tax history
+3.5%/yrLatest (2025): $169 · +8.3% YoY. Source: county tax records.
Cash-flow waterfall
monthlySold comps — $/sqft
last 12 mo · ≤1 miLoading sold comps…