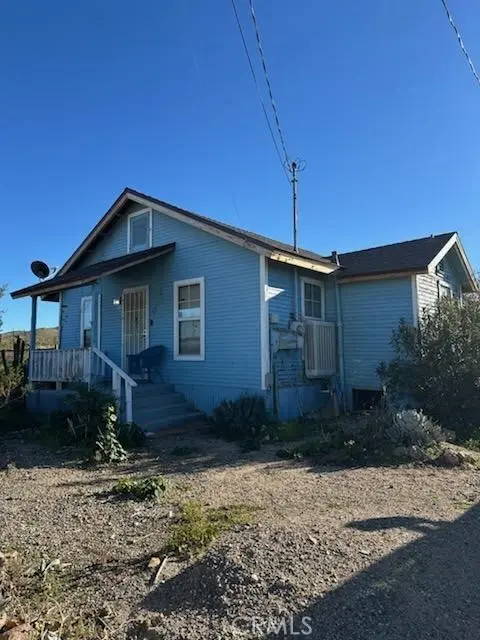
501 Johannesburg · Johannesburg, CA
Flood risk 1/10 · Minimal
- FEMA flood zone
- X (unshaded)
- Chance of flooding over 30 yrs
- 0.0%
- Est. flood insurance / yr
- $507 – $1,088
Fire risk 5/10 · Moderate
- Est. fire insurance / yr
- $659 – $1,223
Heat risk 7/10 · Major
- Hot days now (above 99°F)
- 7 days/yr
- Hot days in 30 yrs
- 21 days/yr
Wind risk 1/10 · Minimal
- Chance of severe wind over 30 yrs
- —
Air-quality risk 5/10 · Moderate
- Unhealthy air days now
- 7 days/yr
- Unhealthy air days in 30 yrs
- 7 days/yr
Risk factors via First Street. Map © Google.
Why this score? — see what drove the C grade
The composite is a weighted blend of 9 inputs, each scored 0–100. Each bar is that input's sub-score; the figure is the points it added to the 100-point composite (weight × sub-score).
- Cash flow +27.0/30.0
- DSCR +9.3/10.0
- 1% rule +6.7/10.0
- Appreciation +5.0/10.0
- Schools +2.9/10.0
- Rent growth +2.5/5.0
- Condition / age +2.5/5.0
- ARV discount +2.0/15.0
- Livability +1.5/5.0
$89,900
🖨 Deal sheet 📄 Offer letter ✓ Due diligence
Listing remarks MLS
Located in a quiet rural area of Johannesburg, CA, this 2-bedroom, 1-bath home sits on a spacious corner lot and offers great potential as a rental property, or peaceful rural getaway. A large laundry room provides flexibility and can be converted into a third bedroom, adding additional value and income potential. Major system upgrades, including a newer roof (approximately 2 years old), a tankless water heater (1 year old), and a recently serviced septic system that was pumped just 6 months ago. The home is connected to city water and operates on propane. A large corner lot offers ample outdoor space, along with an additional storage shed for tools or equipment. Some interior updates have already been started, making this a great opportunity for an investor or owner-occupant ready to add their personal touch and finish the project. Conveniently located near a gas station, this property combines rural living with accessibility. Sold as-is, this is a solid opportunity to build equity and customize a home to your vision.
Key facts
- Newer roof
- Spacious corner lot
- Large laundry room
Tags
Neighborhood map
What this means for you Summary
Snapshot
- This is a 2-bed/1.0-bath single-family listed at $90k.
Deal economics
- At list price, monthly cash flow is $251 ($3k/yr) — positive.
- The deal already cash-flows at list — no discount required.
- Meets the 1% rule at list price ($1k rent vs $90k).
- Recommended offer: $82k (9.0% below list) — sets the bar for market timing.
Location & tenants
- Location reads 30/100 on livability (#1,466 in CA) — a limited-amenity area; tenant pool skews transient or value-seeking. Strengths: crime A; Watch: cost of living D, amenities F, commute F.
- Sierra Sands Unified (town): math 25% / reading 39% proficiency, ranked #294 of 517 in CA (top 57%) — families likely to look elsewhere, expect single-tenant / working-renter base with shorter leases.
- Market conditions: 11 active listings in the ZIP; 3,244 units permitted in Kern County in 2024 (73 in 5+ unit buildings).
Forward outlook
- In year one you build about $3k of equity ($622 loan paydown + $3k appreciation (3.0% local appreciation)).
- Kern County population projected at +17% by 2050 — long-run rental-demand tailwind backs the buy-and-hold thesis.
- At projected returns (3.0% appreciation + 3.0% rent growth), your $25k cash investment doubles in ~4 years — after that, you're playing with house money.
- By year 10, paydown + projected appreciation supports a ~$32k cash-out refi (75% LTV) — recoverable capital for the next deal without selling this one.
Negotiation context
- It's been on market 116 days — a 9% lower offer ($82k) is reasonable based on typical stale-listing flexibility.
- Current owner paid $45k; list at $90k implies a 100% gain — meaningful room to come down on a strong offer.
Risks & watch-outs
- Watch-outs: built in 1932 — expect roof / HVAC / electrical / plumbing capex.
- Climate carrying-cost: moderate wildfire risk; extreme-heat days projected 7→21/yr by 2055 (HVAC capex compounding) — expect insurance premiums to compound above CPI over the hold.
Questions for the listing agent
- It's been on market 116 days. Have you received any prior offers? Is the seller open to a 9% concession, seller financing, or rate buy-down credit?
- Built in 1932 — when were the roof, HVAC, electrical panel, plumbing, and water heater last replaced?
- Why hasn't it sold? Are there any deal-killer items the seller is aware of (foundation, flood, title, zoning, code violations)?
- Is there a deadline driving the sale (1031 exchange, divorce, estate, relocation)? That informs how much negotiation room exists.
- Schools are B-rated — typically a magnet for longer-tenancy family renters. What's the average tenant stay here, and is there a school-zone premium baked into asking?
- What's the average days-on-market for RENTAL listings here right now (not sales)? A rising rental-DOM trend means longer vacancies and softer asking-rent achievability than the comps imply.
- What's the recent tenant-quality profile in this submarket — average credit score on applications, eviction rate, late-payment / NSF rate, and stable-employment percentage? A property-management company in the area should have these aggregated.
- How much new for-sale + rental construction is in the pipeline within 1–3 miles? Heavy new supply typically softens prices + rents 12–24 months out; constrained supply supports both.
Investment metrics
- 1% rule
- 1.17% ✓
- Cap rate
- 9.65%
- Cash-on-cash
- 11.97%
- DSCR
- 1.53
- GRM
- 7.1
CMA / ARV
- ARV (median comp)
- $80,111
- List price
- $89,900
- Delta
- 12.22%
- Verdict
- OVERPRICED
- Comps
- 5 within 1.0 mi
Show comp detail 2 sales within ~0.75 mi
| Address | Dist | Beds/Ba | Sqft | Sold | Price | $/sf | Match |
|---|---|---|---|---|---|---|---|
| 310 Buluwayo Ave | 0.14mi | 1/1.0 (-1) | 847 (+2%) | 11mo | $38,000 | $45 | 75 |
| 504 Broadway Ave | 0.08mi | 2/1.0 | 940 (+14%) | 23mo | $143,000 | $152 | 54 |
Match score weights: distance 35% · size 25% · config 20% · recency 20%. Top-matched comps best support the ARV.
Projected returns pro-forma
3.0% appreciation · 3.0% rent growth · sell at horizon
- IRR
- 18.7%
- Equity multiple
- 2.07×
- Total profit
- $26,817
- Equity at exit
- $40,423
- IRR
- 20.0%
- Equity multiple
- 3.90×
- Total profit
- $73,051
- Equity at exit
- $62,297
Cash invested: $25,172 (down + closing). Projections, not guarantees.
Landlord ↔ Tenant lean methodology
- Overall (STATE)
- 18 Strongly Tenant-Friendly
- State California
- 18 Strongly Tenant-Friendly · D+13
- County
- — inherits STATE
- City
- — inherits STATE
ZIP-level market 93528
- Active inventory
- 11
- Price-to-rent
- 7.1×
Monthly cashflow live
- Estimated rent
- $1,055 medium interval (Pro) →
- Mortgage (P&I)
- −$471
- Tax from tax record
- −$73 /mo · $877/yr
- Insurance
- −$37
- HOA
- −$0
- Vacancy / Maint / Mgmt
- −$221
- Net cashflow
- $251
Break-even live
UW: 25.0% down · 7.5% · 30yr · 1.5% tax · 5.0% vac · 8.0% maint · 8.0% mgmt
Financing live
Cash to close
- Down payment
- $22,475
- Closing costs
- $2,697
- Reserves months
- —
- Total cash needed
- —
Loan-product check · same deal, 3 products live
Conventional
25% down · 7.5% · 30yr
- Down + closing
- —
- Monthly P&I
- —
- Monthly cashflow
- —
- DSCR
- —
- Eligible?
- —
Personal DTI + credit; lowest rate.
DSCR
20% down · 8.5% · 30yr
- Down + closing
- —
- Monthly P&I
- —
- Monthly cashflow
- —
- DSCR
- —
- Eligible?
- —
No personal income docs; deal must DSCR.
Hard money
10% down · 12.0% · 12mo
- Down + closing
- —
- Monthly P&I
- —
- Monthly cashflow
- —
- DSCR
- —
- Eligible?
- —
Short-term bridge; refi at stabilization.
Listing history 7 events
-
2026-06-03days on market $89,900 Active 116 DOM
-
2026-06-03days on market $89,900 Active 115 DOM
-
2026-06-01days on market $89,900 Active 114 DOM
-
2026-05-31days on market $89,900 Active 113 DOM
-
2026-02-07$89,900 Active 1034-char remark
Show marketing remark (1034 chars)
Located in a quiet rural area of Johannesburg, CA, this 2-bedroom, 1-bath home sits on a spacious corner lot and offers great potential as a rental property, or peaceful rural getaway. A large laundry room provides flexibility and can be converted into a third bedroom, adding additional value and income potential. Major system upgrades, including a newer roof (approximately 2 years old), a tankless water heater (1 year old), and a recently serviced septic system that was pumped just 6 months ago. The home is connected to city water and operates on propane. A large corner lot offers ample outdoor space, along with an additional storage shed for tools or equipment. Some interior updates have already been started, making this a great opportunity for an investor or owner-occupant ready to add their personal touch and finish the project. Conveniently located near a gas station, this property combines rural living with accessibility. Sold as-is, this is a solid opportunity to build equity and customize a home to your vision.
-
2007-07-12soldstatus $45,000
-
1998-10-20soldstatus $8,000
ⓘ Source: listings_history table (triggers on properties + properties_extension) + one-shot
backfill from property_details.listing_events for pre-trigger history.
Tax reassessment forecast CA · Resets to sale price
- Current annual tax
- $877 · $73/mo
- Projected year-2 tax
- $877 · $73/mo
- Expected delta
- $0/yr ($0/mo · 0.0%)
ⓘ Screening estimate from a state-policy table — verify with the county assessor before closing.
Climate risk First Street
- Flood 1/10 Low FEMA zone X (unshaded) · 0% chance over 30 yrs
- Wildfire 5/10 Major
- Heat 7/10 Severe 7 d/yr ≥99°F today · 21 d/yr by 30 yrs out
- Wind 1/10 Low
- Air quality 5/10 Major 7 unhealthy d/yr today · 7 by 30 yrs out
Nearby sold comps map
Loading sold comps map…
Walkable amenities ~0.75 mi
Loading nearby amenities…
Taxation est. · year 1
- Rental income
- $12,654
- − Mortgage interest
- −$5,036
- − Property taxes
- −$877
- − Insurance
- −$450
- − Repairs & maintenance
- −$1,012
- − Management
- −$1,012
- − Depreciation
- −$2,615
- Taxable income
- $1,653
- Est. tax owed @ 24.0%
- −$397
- After-tax cash flow
- $2,617/yr
For passive investors: Depreciation is non-cash, so a rental often shows a tax loss while cash-flowing — sheltering income. Rental losses are passive: they offset passive income freely, and up to $25,000/yr can offset ordinary (W-2) income if you actively participate and your MAGI is under $100k (phasing out to $0 by $150k); unused losses carry forward. On sale, claimed depreciation is recaptured at up to 25%, and gains may owe capital-gains tax (a 1031 exchange can defer both). Figures are a year-1 estimate at your 24.0% rate — not tax advice; consult a CPA.
Schools (NCES district)
- District
- Sierra Sands Unified
- NCES district ID
- 0636800
- Math proficiency
- 25% ▼ -11.00%
- Reading proficiency
- 39% ▼ -11.00%
- Median HH income
- $58,937
- Composite
- 28.66/100
- National rank
- #6699
- State rank
- #294 of 517 in CA
Livability — Johannesburg
- Score
- 30/100
- State rank
- #1466
- US rank
- #27894
Category grades
Schools grade is shown separately in the Schools card above.
Census & demographics
- Census place
- Johannesburg, CA
- City population
- 77
- Population (ZIP)
- 77
Population outlook (Kern County) Hauer SSP2
- Today (2025)
- 947,286 people
- By 2030
- 978,984 · +3.3%
- By 2040
- 1,045,018 · +10.3%
- By 2050
- 1,105,232 · +16.7%
- By 2075
- 1,229,538 · +29.8%
- By 2100
- 1,238,059 · +30.7%
Race, ethnicity, and origin ACS 2023
- Neighborhood character
- Predominantly Asian (100%)
- Race & ethnicity
- Asian 100%
- Foreign-born
- 87% · Vietnam
- Languages at home
- 0% English-only · Vietnamese 77% Chinese 23%
Political lean MEDSL · Kern
- 2024 margin
- Strong R (+21.1) · D 38.2% · R 59.3% · Other 2.5%
- 2008→2024 swing
- -3.3pp toward R · 2008: -17.8pp · 2024: -21.1pp
- All cycles
- 2024: R+21.1 2020: R+10.2 2016: R+15.0 2012: R+20.9 2008: R+17.8
Not yet ingested
- Civics
- —
Market trends
- HPI YoY
- —
- Current HPI
- —
- Rent YoY
- —
- Metro
- —
- State GDP YoY
- ▲ 3.21%
- F500 in state
- 116
Industry mix (Fortune 500 HQ in CA)
| Industry | F500 HQs | Revenue |
|---|---|---|
| Technology | 27 | $1,492B |
|
||
| Financial Services | 3 | $174B |
|
||
| Retail | 3 | $44B |
|
||
| Insurance | 3 | $26B |
|
||
| Media / Entertainment | 2 | $115B |
|
||
| Pharmaceuticals / Biotech | 2 | $62B |
|
||
Price history
+1023.8% since first listed3 events — show timeline
- 2026-02-07 Listed $89,900 CRMLS
- 2007-07-12 Sold (Public Records) $45,000 Public Records
- 1998-10-20 Sold (Public Records) $8,000 Public Records
Property tax history
+7.7%/yrLatest (2025): $877 · +6.2% YoY. Source: county tax records.
Cash-flow waterfall
monthlySold comps — $/sqft
last 12 mo · ≤1 miLoading sold comps…