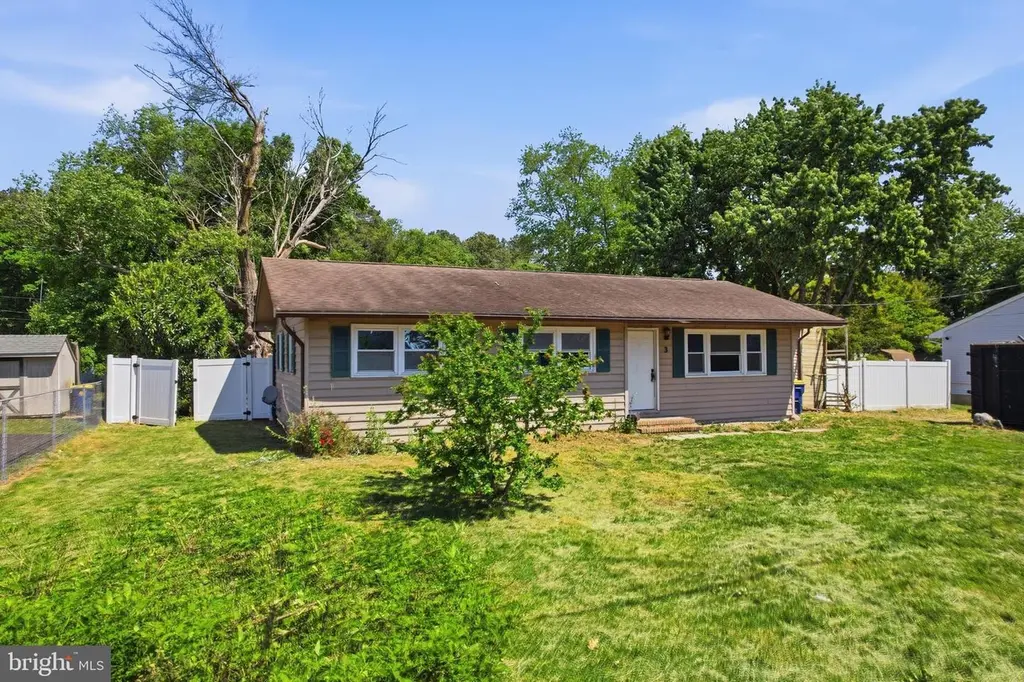
3 Lowber St · Frederica, DE
Flood risk 1/10 · Minimal
- FEMA flood zone
- X (unshaded)
- Chance of flooding over 30 yrs
- 0.0%
- Est. flood insurance / yr
- $507 – $1,088
Fire risk 1/10 · Minimal
- Est. fire insurance / yr
- $476 – $884
Heat risk 8/10 · Major
- Hot days now (above 101°F)
- 7 days/yr
- Hot days in 30 yrs
- 16 days/yr
Wind risk 8/10 · Major
- Chance of severe wind over 30 yrs
- 80.0%
Air-quality risk 2/10 · Minimal
- Unhealthy air days now
- 1 days/yr
- Unhealthy air days in 30 yrs
- 2 days/yr
Risk factors via First Street. Map © Google.
Why this score? — see what drove the B+ grade
The composite is a weighted blend of 9 inputs, each scored 0–100. Each bar is that input's sub-score; the figure is the points it added to the 100-point composite (weight × sub-score).
- Cash flow +30.0/30.0
- ARV discount +15.0/15.0
- DSCR +10.0/10.0
- 1% rule +9.3/10.0
- Livability +3.4/5.0
- Schools +3.0/10.0
- Rent growth +2.5/5.0
- Condition / age +2.5/5.0
- Appreciation +0.0/10.0
$189,777
🖨 Deal sheet (PDF) 📄 Offer letter ✓ Due diligence
Listing remarks
Handyman Special! Instant Equity to be Earned! Great opportunity for investors or handy buyers looking to build equity! This 3-bedroom, 1-bath ranch home in Frederica offers solid potential with a functional layout and plenty of space inside and out. The main level features a spacious living room, dining room, kitchen, family room, three bedrooms, and a full bathroom. A full unfinished basement provides endless possibilities for storage, workshop space, or future finishing potential. Outside, you’ll find a detached garage and a large, spacious yard perfect for entertaining, expansion, or outdoor enjoyment. With some TLC, this property could truly shine. Schedule a showing today!
Key facts
- Large spacious yard
- Detached garage
- 0.35 acre lot
Tags
Property features AI
Exterior
- Parking: Asphalt driveway; Driveway parking
- Utilities: Public water; Public sewer; Electric power
- Home design: Detached structure; Shingle roof; Fee simple ownership; Year built estimated
- Construction: Stick built construction; Slab foundation
- Exterior features: Not in a federal flood zone; No tidal water on the lot; Other structures above grade and below grade; Pets allowed with no restrictions
Interior
- Bedrooms: Three bedrooms on the main level
- Bathrooms: One full bathroom
- Heating & cooling: Baseboard electric heating; Ceiling fans; Window air conditioning units; Electric cooling fuel; Electric hot water
- Interior features: Estimated living area; Full basement
Neighborhood map
What this means for you Summary
Snapshot
- This is a 4-bed/1.0-bath single-family listed at $190k.
Deal economics
- At list price, monthly cash flow is $995 ($12k/yr) — positive.
- The deal already cash-flows at list — no discount required.
- Meets the 1% rule at list price ($3k rent vs $190k).
- Recommended offer: $187k (1.5% below list) — sets the bar for market timing.
- Cap rate 12.6% vs local median 7.0% in Frederica — top-decile yield for the area; either an underpriced asset or a hidden risk that comps aren't pricing in. Stress-test before assuming the spread holds.
Location & tenants
- Location reads 68/100 on livability (#34 in DE) — a middle-class / working-renter tenant base. Strengths: cost of living A+, housing A+, health & safety A+; Watch: employment D+, crime F, amenities F.
- Lake Forest School District (rural): math 26% / reading 44% proficiency, ranked #13 of 26 in DE (top 50%) — families likely to look elsewhere, expect single-tenant / working-renter base with shorter leases.
- Zoned schools: Lake Forest High School (math 27% / reading 47%, grade F, #16 of 40 statewide, top 38%, 870 students, 0% FRL) — zoned schools average 0% FRL vs 47% district-wide (47 pts lower); this property's tenant base skews higher-income than the district average.
- Market conditions: 74 active listings in the ZIP; 1 comparable units currently listed for rent nearby; solid renter incomes; 1,201 units permitted in Kent County in 2024 (116 in 5+ unit buildings).
- This rent runs 40% of the median local income ($80k/yr) — at the standard rent-burdened threshold; future hikes will face affordability resistance.
Forward outlook
- Local home prices are declining (-3.0%/yr); year-one equity from $1k of loan paydown is wiped out by about $6k of value loss. Plan a longer hold.
- Kent County population projected at +22% by 2050 — long-run rental-demand tailwind backs the buy-and-hold thesis.
- At projected returns (-3.0% appreciation + 3.0% rent growth), your $53k cash investment doubles in ~6 years — after that, you're playing with house money.
Negotiation context
- It's been on market 23 days — a 2% lower offer ($187k) is reasonable based on typical stale-listing flexibility.
- 9 sale attempts since 20y ago with the ask held roughly flat each time — persistent listings suggest the price (not the market) is what's stuck; bring a comps-based counter.
Risks & watch-outs
- Climate carrying-cost: severe wind risk, 80% chance of damaging wind over 30y; extreme-heat days projected 7→16/yr by 2055 (HVAC capex compounding) — expect insurance premiums to compound above CPI over the hold.
Questions for the listing agent
- Built in 1969 — when were the roof, HVAC, electrical panel, plumbing, and water heater last replaced?
- Is there a deadline driving the sale (1031 exchange, divorce, estate, relocation)? That informs how much negotiation room exists.
- Schools are B-rated — typically a magnet for longer-tenancy family renters. What's the average tenant stay here, and is there a school-zone premium baked into asking?
- Crime grade is F in this area — have there been break-ins, vandalism, or insurance claims at this property in the last 3 years? What carrier currently insures it and at what premium?
- What's the average days-on-market for RENTAL listings here right now (not sales)? A rising rental-DOM trend means longer vacancies and softer asking-rent achievability than the comps imply.
- What's the recent tenant-quality profile in this submarket — average credit score on applications, eviction rate, late-payment / NSF rate, and stable-employment percentage? A property-management company in the area should have these aggregated.
- How much new for-sale + rental construction is in the pipeline within 1–3 miles? Heavy new supply typically softens prices + rents 12–24 months out; constrained supply supports both.
Investment metrics
- 1% rule
- 1.43% ✓
- Cap rate
- 12.59%
- Cash-on-cash
- 22.47%
- DSCR
- 2.00
- GRM
- 5.8
CMA / ARV
- ARV (median comp)
- $270,629
- List price
- $189,777
- Delta
- -26.13%
- Verdict
- UNDERPRICED
- Comps
- 20 within 1.0 mi
Show comp detail 7 sales within ~0.75 mi
| Address | Dist | Beds/Ba | Sqft | Sold | Price | $/sf | Match |
|---|---|---|---|---|---|---|---|
| 9 4th St | 0.36mi | 4/2.0 | 1,360 (-4%) | 2mo | $255,000 | $188 | 72 |
| 5 Hillside Ave | 0.37mi | 3/1.5 (-1) | 1,440 (+2%) | 8mo | $290,000 | $201 | 66 |
| 104 Coleman Ave | 0.11mi | 3/2.0 (-1) | 1,274 (-10%) | 8mo | $287,500 | $226 | 63 |
| 74 Frog Leg Ln | 0.29mi | 3/2.0 (-1) | 1,352 (-4%) | 11mo | $164,000 | $121 | 62 |
| 7 4th St | 0.37mi | 4/2.0 | 1,393 (-1%) | 22mo | $265,000 | $190 | 58 |
| 1 Jackson St | 0.24mi | 3/2.5 (-1) | 1,536 (+9%) | 6mo | $324,900 | $212 | 58 |
| 116 Jackson St | 0.33mi | 3/2.5 (-1) | 1,346 (-5%) | 22mo | $225,000 | $167 | 48 |
Match score weights: distance 35% · size 25% · config 20% · recency 20%. Top-matched comps best support the ARV.
Projected returns pro-forma
-3.0% appreciation · 3.0% rent growth · sell at horizon
- IRR
- 15.3%
- Equity multiple
- 1.61×
- Total profit
- $32,567
- Equity at exit
- $28,296
- IRR
- 23.9%
- Equity multiple
- 3.06×
- Total profit
- $109,722
- Equity at exit
- $16,408
Cash invested: $53,138 (down + closing). Projections, not guarantees.
Landlord ↔ Tenant lean methodology
- Overall (STATE)
- 70 Landlord-Friendly
- State Delaware
- 70 Landlord-Friendly · D+7
- County
- — inherits STATE
- City
- — inherits STATE
ZIP-level market 19946
- Home prices YoY
- -16.1%
- Active inventory
- 74
- Price-to-rent
- 5.8×
Monthly cashflow live
- Estimated rent
- $2,709 medium interval (Pro) →
- Mortgage (P&I)
- −$995
- Tax from tax record
- −$70 /mo · $846/yr
- Insurance
- −$79
- HOA
- −$0
- Vacancy / Maint / Mgmt
- −$569
- Net cashflow
- $995
Break-even live
Sensitivity live
| Price | -10% $1,103 | -5% $1,049 | +0% $995 | +5% $941 | +10% $888 |
|---|---|---|---|---|---|
| Rent | -10% $781 | -5% $888 | +0% $995 | +5% $1,102 | +10% $1,209 |
| Rate | -1.0pp $1,091 | -0.5pp $1,043 | base $995 | +0.5pp $946 | +1.0pp $896 |
UW: 25.0% down · 7.5% · 30yr · 1.5% tax · 5.0% vac · 8.0% maint · 8.0% mgmt
Financing live
Cash to close
- Down payment
- $47,444
- Closing costs
- $5,693
- Reserves months
- —
- Total cash needed
- —
Loan-product check · same deal, 3 products live
Conventional
25% down · 7.5% · 30yr
- Down + closing
- —
- Monthly P&I
- —
- Monthly cashflow
- —
- DSCR
- —
- Eligible?
- —
Personal DTI + credit; lowest rate.
DSCR
20% down · 8.5% · 30yr
- Down + closing
- —
- Monthly P&I
- —
- Monthly cashflow
- —
- DSCR
- —
- Eligible?
- —
No personal income docs; deal must DSCR.
Hard money
10% down · 12.0% · 12mo
- Down + closing
- —
- Monthly P&I
- —
- Monthly cashflow
- —
- DSCR
- —
- Eligible?
- —
Short-term bridge; refi at stabilization.
Rent comps 1 comps
| Address | Beds | Baths | Sqft | Rent | $/sqft | DOM | Units | Dist |
|---|---|---|---|---|---|---|---|---|
| 39 Riptide Ct Frederica, DE | 3.0 | 2.5 | 1855 | $2,100 | $1.13 | 45d | 1 | 0.76mi |
Listing history 50 events
-
2026-06-21days on market $189,777 Active 23 DOM
-
2026-06-19days on market $189,777 Active 21 DOM
-
2026-06-18days on market $189,777 Active 20 DOM
-
2026-06-17days on market $189,777 Active 19 DOM
-
2026-06-16days on market $189,777 Active 18 DOM
-
2026-06-15price $189,777 Active 17 DOM
-
2026-06-15days on market $195,000 Active 17 DOM
-
2026-06-14days on market $195,000 Active 15 DOM
-
2026-06-13days on market $195,000 Active 14 DOM
-
2026-06-10days on market $195,000 Active 12 DOM
-
2026-06-09days on market $195,000 Active 11 DOM
-
2026-06-08days on market $195,000 Active 10 DOM
-
2026-06-07days on market $195,000 Active 9 DOM
-
2026-06-05days on market $195,000 Active 6 DOM
-
2026-06-03days on market $195,000 Active 5 DOM
-
2026-06-02days on market $195,000 Active 4 DOM
-
2026-06-01days on market $195,000 Active 3 DOM
-
2026-05-31days on market $195,000 Active 2 DOM
-
2026-05-08$199,900 Active 693-char remark
-
2026-05-06historical $199,900 693-char remark
-
2026-04-23soldstatus $226,500
-
2026-04-01historical
-
2026-04-01historical
-
2026-04-01$170,000
-
2021-01-28soldstatus $151,500
-
2021-01-27soldstatus $151,500 Closed
-
2021-01-05status Pending
-
2020-12-19$165,000 Active
-
2017-06-12soldstatus $135,000
-
2017-06-09soldstatus $135,000
-
2017-06-09soldstatus $135,000 Sold
-
2017-06-09historical
-
2017-05-08status Under Contract
-
2017-05-06historical
-
2017-04-07price $145,000
-
2016-11-29price $146,000
-
2016-11-07status Active
-
2016-11-05historical
-
2016-09-28price $148,500
-
2016-05-23price $149,900
-
2016-05-16price $154,500
-
2016-02-01price $154,900
-
2016-01-11price $158,500
-
2015-11-06$159,900 Active
-
2015-11-06$145,000
-
2015-11-06$145,000
-
2006-10-19soldstatus $149,950
-
2006-10-09soldstatus $149,950
-
2006-09-01historical
-
2006-08-23$149,950
ⓘ Source: listings_history table (triggers on properties + properties_extension) + one-shot
backfill from property_details.listing_events for pre-trigger history.
Tax reassessment forecast DE · Partial reset (capped growth)
- Current annual tax
- $846 · $70/mo
- Projected year-2 tax
- $973 · $81/mo
- Expected delta
- +$127/yr (+$11/mo · 15.1%)
ⓘ Screening estimate from a state-policy table — verify with the county assessor before closing.
Climate risk First Street
- Flood 1/10 Low FEMA zone X (unshaded) · 0% chance over 30 yrs
- Wildfire 1/10 Low
- Heat 8/10 Severe 7 d/yr ≥101°F today · 16 d/yr by 30 yrs out
- Wind 8/10 Severe 80% chance of damaging wind over 30 yrs
- Air quality 2/10 Low 1 unhealthy d/yr today · 2 by 30 yrs out
Nearby sold comps map
Loading sold comps map…
Walkable amenities ~0.75 mi
Loading nearby amenities…
Taxation est. · year 1
- Rental income
- $32,505
- − Mortgage interest
- −$10,630
- − Property taxes
- −$846
- − Insurance
- −$949
- − Repairs & maintenance
- −$2,600
- − Management
- −$2,600
- − Depreciation
- −$5,521
- Taxable income
- $9,358
- Est. tax owed @ 24.0%
- −$2,246
- After-tax cash flow
- $9,696/yr
For passive investors: Depreciation is non-cash, so a rental often shows a tax loss while cash-flowing — sheltering income. Rental losses are passive: they offset passive income freely, and up to $25,000/yr can offset ordinary (W-2) income if you actively participate and your MAGI is under $100k (phasing out to $0 by $150k); unused losses carry forward. On sale, claimed depreciation is recaptured at up to 25%, and gains may owe capital-gains tax (a 1031 exchange can defer both). Figures are a year-1 estimate at your 24.0% rate — not tax advice; consult a CPA.
Schools (NCES district)
- District
- Lake Forest School District
- NCES district ID
- 1000790
- Math proficiency
- 26% ▼ -23.00%
- Reading proficiency
- 44% ▼ -14.00%
- Median HH income
- $52,034
- Composite
- 30.47/100
- National rank
- #6225
- State rank
- #13 of 26 in DE
Livability — Frederica
- Score
- 68/100
- State rank
- #34
- US rank
- #9737
Category grades
Schools grade is shown separately in the Schools card above.
Census & demographics
- Census place
- Frederica, DE
- County
- Kent County · 82,184 people
- City population
- 5,603
- Metro
- Dover, DE
- Population (ZIP)
- 5,603
- Household income
- $80,459
- Rent vs Own
- Severe rent burden
- 128.0
Population outlook (Kent County) Hauer SSP2
- Today (2025)
- 194,477 people
- By 2030
- 204,351 · +5.1%
- By 2040
- 222,135 · +14.2%
- By 2050
- 236,483 · +21.6%
- By 2075
- 266,327 · +36.9%
- By 2100
- 275,335 · +41.6%
Race, ethnicity, and origin ACS 2023
- Neighborhood character
- Diverse neighborhood (Simpson 0.55)
- Race & ethnicity
- White 64% Black 19% Two or more races 10% Hispanic / Latino 5%
- Common ancestry
- Romanian 2% Italian 1% Iranian 1%
- Foreign-born
- 3% · Canada
- Languages at home
- 97% English-only · Spanish 3%
Political lean MEDSL · Kent
- 2024 margin
- Toss-up / Even · D 50.2% · R 48.2% · Other 1.7%
- 2008→2024 swing
- -7.8pp toward R · 2008: 9.8pp · 2024: 2.0pp
- All cycles
- 2024: D+2.0 2020: D+4.1 2016: R+4.9 2012: D+4.9 2008: D+9.8
Not yet ingested
- Civics
- —
Market trends
- HPI YoY
- ▼ -36.16%
- Current HPI
- 189.0713
- Rent YoY
- —
- Metro
- Dover, DE
- State GDP YoY
- —
- F500 in state
- 0
Price history
+848.9% since first listed36 events — show timeline
- 2026-06-15 Price Changed $189,777 BRIGHT MLS
- 2026-05-29 Listing Removed — BRIGHT MLS
- 2026-05-29 Listed $195,000 BRIGHT MLS
- 2026-05-08 Listed $199,900 BRIGHT MLS
- 2026-05-06 Coming Soon — BRIGHT MLS
- 2026-04-23 Sold (Public Records) $226,500 Public Records
- 2026-04-01 Listed $170,000 BRIGHT MLS
- 2026-04-01 Listing Removed — BRIGHT MLS
- 2026-04-01 Listing Removed — BRIGHT MLS
- 2021-01-28 Sold (Public Records) $151,500 Public Records
- 2021-01-27 Sold (MLS) $151,500 BRIGHT MLS
- 2021-01-05 Pending — BRIGHT MLS
- 2020-12-19 Listed $165,000 BRIGHT MLS
- 2017-06-12 Sold (Public Records) $135,000 Public Records
- 2017-06-09 Listing Removed — BRIGHT MLS
- 2017-06-09 Sold (MLS) $135,000 BRIGHT MLS
- 2017-06-09 Sold (MLS) $135,000 TREND
- 2017-05-08 Pending — TREND
- 2017-05-06 Listing Removed — BRIGHT MLS
- 2017-04-07 Price Changed $145,000 TREND
- 2016-11-29 Price Changed $146,000 TREND
- 2016-11-07 Relisted — TREND
- 2016-11-05 Delisted — TREND
- 2016-09-28 Price Changed $148,500 TREND
- 2016-05-23 Price Changed $149,900 TREND
- 2016-05-16 Price Changed $154,500 TREND
- 2016-02-01 Price Changed $154,900 TREND
- 2016-01-11 Price Changed $158,500 TREND
- 2015-11-06 Listed $159,900 TREND
- 2015-11-06 Listed $145,000 BRIGHT MLS
- 2015-11-06 Listed $145,000 BRIGHT MLS
- 2006-10-19 Sold (Public Records) $149,950 Public Records
- 2006-10-09 Sold (MLS) $149,950 BRIGHT MLS
- 2006-09-01 Listing Removed — BRIGHT MLS
- 2006-08-23 Listed $149,950 BRIGHT MLS
- 1994-06-01 Sold (Public Records) $20,000 Public Records
Property tax history
+4.6%/yrLatest (2025): $846 · +0.4% YoY. Source: county tax records.
Cash-flow waterfall
monthlySold comps — $/sqft
last 12 mo · ≤1 miLoading sold comps…