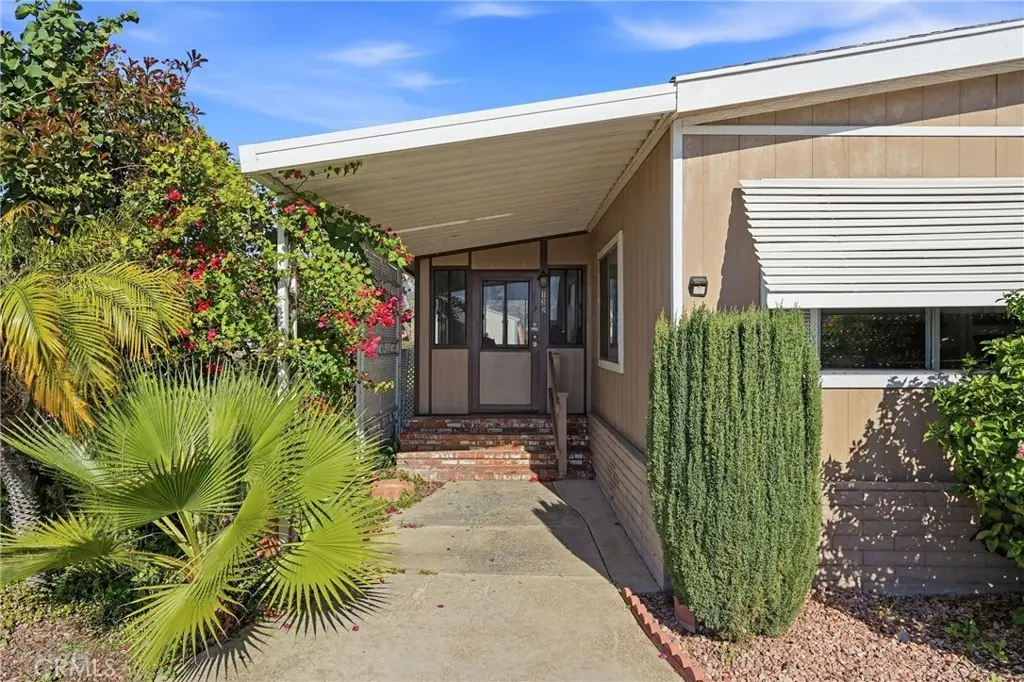
1456 E Philadelphia #132 · Ontario, CA
Flood risk 4/10 · Minor
- FEMA flood zone
- X
- Chance of flooding over 30 yrs
- 0.2%
- Est. flood insurance / yr
- $507 – $1,088
Fire risk 1/10 · Minimal
- Est. fire insurance / yr
- $659 – $1,223
Heat risk 8/10 · Major
- Hot days now (above 100°F)
- 7 days/yr
- Hot days in 30 yrs
- 19 days/yr
Wind risk 1/10 · Minimal
- Chance of severe wind over 30 yrs
- —
Air-quality risk 9/10 · Severe
- Unhealthy air days now
- 23 days/yr
- Unhealthy air days in 30 yrs
- 26 days/yr
Risk factors via First Street. Map © Google.
Why this score? — see what drove the B+ grade
The composite is a weighted blend of 9 inputs, each scored 0–100. Each bar is that input's sub-score; the figure is the points it added to the 100-point composite (weight × sub-score).
- Cash flow +30.0/30.0
- ARV discount +12.8/15.0
- 1% rule +10.0/10.0
- DSCR +10.0/10.0
- Schools +3.7/10.0
- Livability +3.2/5.0
- Rent growth +3.1/5.0
- Condition / age +2.5/5.0
- Appreciation +0.0/10.0
$127,000
🖨 Deal sheet 📄 Offer letter ✓ Due diligence
Listing remarks
CORNER LOT * * NO ONE IN FRONT OF YOU. .. Welcome to this charming 2-bedroom, 2-bathroom manufactured home located in the sought-after 55+ gated community of Rancho Ontario. Featuring approximately 1,440 sq ft of living space, this home offers an open floor plan with a spacious living room and family room, a comfortable main suite with large mirrored closets, and a full bathroom with a garden tub and stand-up shower. The guest bedroom is conveniently situated near the laundry area. FACING THE PARK! Residents enjoy a resort-style lifestyle with resort amenities such as a heated pool and spa open year-round, clubhouse with billiards, card/game rooms and fitness center, pickleball and bocce
Key facts
- 1,248 sq ft lot
- 2 parking spots
- Community pool
Property features AI
Finance
- Financial info: Land lease: $1,650
- HOA & community: Senior community; Clubhouse; Pool; Spa; Gym/exercise room; Billiard room; Card room; Meeting room; Barbecue area; Pickleball; Dog park
Exterior
- Parking: Carport (2 spaces); Has parking; RV parking available (fee applies)
- Security: Gated community
- Utilities: District/public water; Public sewer; Natural gas available; Electricity available
- Home design: Single-story mobile home; Entry at front and side; One level; Mobile home model P; Turnkey; updated/remodeled
- Construction: Pier jacks foundation; Mobile home remains; Year built from public records
- Exterior features: Covered patio; Community pool (in-ground, heated); Tennis court (private); Shed (1); Siding skirting
Interior
- Kitchen: Refrigerator; Gas oven; Dishwasher; Utility sink; Quartz and granite counters; Self-closing cabinet doors; Water heater unit
- Bedrooms: Primary bedroom (down); Primary suite
- Flooring: Laminate flooring
- Bathrooms: 2 full bathrooms; Bathtub; Shower-in-tub
- Heating & cooling: Central cooling; Central furnace heating
- Interior features: Open floor plan; High ceilings (9 feet+); Storage space; Quartz counters; Granite counters; Double pane windows; Covered patio; Gated community; Community spa (in-ground, heated)
- Laundry & utility: Laundry room; Washer included; Dryer included; Washer hookup
Neighborhood map
What this means for you Summary
Snapshot
- This is a 2-bed/2.0-bath manufactured listed at $127k.
Deal economics
- At list price, monthly cash flow is $1k ($17k/yr) — positive.
- The deal already cash-flows at list — no discount required.
- Meets the 1% rule at list price ($3k rent vs $127k).
- Recommended offer: $123k (3.0% below list) — sets the bar for market timing.
- Cap rate 19.9% vs local median 2.7% in Ontario — top-decile yield for the area; either an underpriced asset or a hidden risk that comps aren't pricing in. Stress-test before assuming the spread holds.
Location & tenants
- Location reads 63/100 on livability (#435 in CA) — a middle-class / working-renter tenant base. Strengths: commute A-, housing B+; Watch: schools F, cost of living F, health & safety F.
- Ontario-Montclair (urban): math 35% / reading 44% proficiency, ranked #731 of 1,400 in CA (top 52%) — families likely to look elsewhere, expect single-tenant / working-renter base with shorter leases; 75% free/reduced lunch — lower-income household profile, screen leases tightly.
- Market conditions: Rents rising (+2.4%/yr); 314 active listings in the ZIP; 8 comparable units currently listed for rent nearby; rentals leasing fast (median 3d on market — plan ~1-2 weeks tenant-placement turnaround); solid renter incomes; 5,458 units permitted in San Bernardino County in 2024 (1,500 in 5+ unit buildings).
- This rent runs 35% of the median local income ($101k/yr) — at the standard rent-burdened threshold; future hikes will face affordability resistance.
Forward outlook
- Local home prices are declining (-3.0%/yr); year-one equity from $878 of loan paydown is wiped out by about $4k of value loss. Plan a longer hold.
- San Bernardino County population projected at +15% by 2050 — modest demand growth; plan on rents tracking national, not racing it.
- At projected returns (-3.0% appreciation + 2.4% rent growth), your $36k cash investment doubles in ~3 years — after that, you're playing with house money.
Negotiation context
- It's been on market 57 days — a 3% lower offer ($123k) is reasonable based on typical stale-listing flexibility.
- 8 sale attempts since 5y ago with the ask held roughly flat each time — persistent listings suggest the price (not the market) is what's stuck; bring a comps-based counter.
Risks & watch-outs
- Climate carrying-cost: extreme-heat days projected 7→19/yr by 2055 (HVAC capex compounding) — expect insurance premiums to compound above CPI over the hold.
Questions for the listing agent
- It's been on market 57 days. Have you received any prior offers? Is the seller open to a 3% concession, seller financing, or rate buy-down credit?
- Is there a deadline driving the sale (1031 exchange, divorce, estate, relocation)? That informs how much negotiation room exists.
- Schools are F-rated, which usually means shorter tenancies and higher turnover. Who's the typical renter profile here, and what's been the actual vacancy rate?
- What's the average days-on-market for RENTAL listings here right now (not sales)? A rising rental-DOM trend means longer vacancies and softer asking-rent achievability than the comps imply.
- What's the recent tenant-quality profile in this submarket — average credit score on applications, eviction rate, late-payment / NSF rate, and stable-employment percentage? A property-management company in the area should have these aggregated.
- How much new for-sale + rental construction is in the pipeline within 1–3 miles? Heavy new supply typically softens prices + rents 12–24 months out; constrained supply supports both.
Investment metrics
- 1% rule
- 2.31% ✓
- Cap rate
- 19.95%
- Cash-on-cash
- 48.76%
- DSCR
- 3.17
- GRM
- 3.6
CMA / ARV
- ARV (on-the-fly)
- $144,000
- Comps found
- 12
Show comp detail 12 sales within ~0.75 mi
| Address | Dist | Beds/Ba | Sqft | Sold | Price | $/sf | Match |
|---|---|---|---|---|---|---|---|
| 1456 E Philadelphia St Spc 390 | 0.00mi | 3/2.0 (+1) | 1,469 (+2%) | 1mo | $180,000 | $123 | 91 |
| 1456 E Philadelphia #2 | 0.00mi | 3/2.0 (+1) | 1,425 (-1%) | 3mo | $187,000 | $131 | 90 |
| 1456 E Philadelphia #24 | 0.00mi | 2/2.0 | 1,536 (+7%) | 5mo | $130,000 | $85 | 85 |
| 1456 E Philadelphia St #300 | 0.00mi | 3/2.0 (+1) | 1,440 (0%) | 15mo | $164,900 | $115 | 82 |
| 1456 E Philadelphia St Spc 424 | 0.00mi | 3/2.0 (+1) | 1,536 (+7%) | 2mo | $80,000 | $52 | 82 |
| 1456 E Philadelphia St Spc 41 | 0.00mi | 2/2.0 | 1,248 (-13%) | 1mo | $161,000 | $129 | 77 |
| 1456 E Philadelphia St #230 | 0.00mi | 3/2.0 (+1) | 1,495 (+4%) | 15mo | $120,000 | $80 | 76 |
| 1456 E Philadelphia #372 | 0.00mi | 3/2.0 (+1) | 1,600 (+11%) | 2mo | $96,000 | $60 | 75 |
| 1456 E Philadelphia St Spc 444 | 0.00mi | 3/2.0 (+1) | 1,560 (+8%) | 11mo | $150,000 | $96 | 72 |
| 1456 E Philadelphia St #108 | 0.00mi | 2/2.0 | 1,248 (-13%) | 10mo | $125,000 | $100 | 70 |
| 1456 E Philadelphia St #101 | 0.00mi | 3/2.0 (+1) | 1,602 (+11%) | 15mo | $186,000 | $116 | 64 |
| 1456 E PHILADELPHIA St #431 | 0.00mi | 3/2.0 (+1) | 1,617 (+12%) | 16mo | $148,000 | $92 | 61 |
Match score weights: distance 35% · size 25% · config 20% · recency 20%. Top-matched comps best support the ARV.
Projected returns pro-forma
-3.0% appreciation · 2.39% rent growth · sell at horizon
- IRR
- 45.6%
- Equity multiple
- 2.96×
- Total profit
- $69,701
- Equity at exit
- $18,936
- IRR
- 51.2%
- Equity multiple
- 5.84×
- Total profit
- $172,108
- Equity at exit
- $10,981
Cash invested: $35,560 (down + closing). Projections, not guarantees.
Landlord ↔ Tenant lean methodology
- Overall (STATE)
- 18 Strongly Tenant-Friendly
- State California
- 18 Strongly Tenant-Friendly · D+13
- County
- — inherits STATE
- City
- — inherits STATE
ZIP-level market 91761
- Rents YoY
- 2.4%
- Active inventory
- 314
- Price-to-rent
- 3.6×
Monthly cashflow live
- Estimated rent
- $2,940 high interval (Pro) →
- Mortgage (P&I)
- −$666
- Tax est. 1.5%
- −$159 /mo · $1,905/yr
- Insurance
- −$53
- HOA
- −$0
- Vacancy / Maint / Mgmt
- −$617
- Net cashflow
- $1,445
Break-even live
UW: 25.0% down · 7.5% · 30yr · 1.5% tax · 5.0% vac · 8.0% maint · 8.0% mgmt
Financing live
Cash to close
- Down payment
- $31,750
- Closing costs
- $3,810
- Reserves months
- —
- Total cash needed
- —
Loan-product check · same deal, 3 products live
Conventional
25% down · 7.5% · 30yr
- Down + closing
- —
- Monthly P&I
- —
- Monthly cashflow
- —
- DSCR
- —
- Eligible?
- —
Personal DTI + credit; lowest rate.
DSCR
20% down · 8.5% · 30yr
- Down + closing
- —
- Monthly P&I
- —
- Monthly cashflow
- —
- DSCR
- —
- Eligible?
- —
No personal income docs; deal must DSCR.
Hard money
10% down · 12.0% · 12mo
- Down + closing
- —
- Monthly P&I
- —
- Monthly cashflow
- —
- DSCR
- —
- Eligible?
- —
Short-term bridge; refi at stabilization.
Rent comps 8 comps
| Address | Beds | Baths | Sqft | Rent | $/sqft | DOM | Units | Dist |
|---|---|---|---|---|---|---|---|---|
| 1110 E Philadelphia St Ontario, CA | 1.0–2.0 | 1.0–2.0 | 904 | $3,207 | $3.55 | 1d | 12 | 0.47mi |
| 2432 S Garfield Pl Ontario, CA | 3.0 | 2.0 | 1118 | $3,150 | $2.82 | 1d | 1 | 0.66mi |
| 2631 S Cucamonga Ave Ontario, CA | 3.0 | 2.5 | 1726 | $3,400 | $1.97 | 43d | 1 | 0.71mi |
| 2042 S Bon View Ave Unit C Ontario, CA | 2.0 | 2.5 | 1364 | $2,700 | $1.98 | 1d | 1 | 0.85mi |
| 629 E Madeleine Privado Ontario, CA | 3.0 | 2.5 | 1465 | $3,350 | $2.29 | 43d | 1 | 1.29mi |
| 629 E Madeleine Privado Ontario, CA | 3.0 | 2.5 | 1465 | $3,250 | $2.22 | 21d | 1 | 1.29mi |
| 619 E Riverside Dr Ontario, CA | 1.0–2.0 | 1.0–2.0 | 866 | $2,295 | $2.65 | 2d | 5 | 1.43mi |
| 551 E Riverside Dr Ontario, CA | 1.0–2.0 | 1.0–2.0 | 782 | $2,665 | $3.41 | 2d | 12 | 1.49mi |
Listing history 37 events
-
2026-06-18days on market $127,000 Active 57 DOM
-
2026-06-17days on market $127,000 Active 56 DOM
-
2026-06-16days on market $127,000 Active 55 DOM
-
2026-06-15days on market $127,000 Active 54 DOM
-
2026-06-13days on market $127,000 Active 52 DOM
-
2026-06-13days on market $127,000 Active 51 DOM
-
2026-06-09days on market $127,000 Active 48 DOM
-
2026-06-08days on market $127,000 Active 47 DOM
-
2026-06-07days on market $127,000 Active 46 DOM
-
2026-06-04days on market $127,000 Active 43 DOM
-
2026-06-03days on market $127,000 Active 42 DOM
-
2026-06-02days on market $127,000 Active 41 DOM
-
2026-06-01days on market $127,000 Active 40 DOM
-
2026-05-31days on market $127,000 Active 39 DOM
-
2026-04-22$127,000 Active
-
2026-04-22historical $127,000
-
2026-04-16historical
-
2026-01-26price $130,000
-
2026-01-08$140,000 Active
-
2026-01-06historical
-
2025-11-17historical
-
2025-10-23price $140,000
-
2025-09-26$145,000 Active
-
2024-09-24status Pending Sale
-
2024-09-09historical
-
2024-08-02price $135,900
-
2024-07-23status Active
-
2024-06-21historical Active Under Contract
-
2024-05-31$129,900 Active
-
2023-10-27soldstatus $116,500 Closed Sale
-
2023-10-22historical Active Under Contract
-
2023-05-03status Active
-
2023-05-02historical Active Under Contract
-
2023-02-03$129,900 Active
-
2023-01-27historical $129,900
-
2021-11-02historical
-
2021-10-20$79,999 Active
ⓘ Source: listings_history table (triggers on properties + properties_extension) + one-shot
backfill from property_details.listing_events for pre-trigger history.
Climate risk First Street
- Flood 4/10 Moderate FEMA zone X · 20% chance over 30 yrs
- Wildfire 1/10 Low
- Heat 8/10 Severe 7 d/yr ≥100°F today · 19 d/yr by 30 yrs out
- Wind 1/10 Low
- Air quality 9/10 Extreme 23 unhealthy d/yr today · 26 by 30 yrs out
Nearby sold comps map
Loading sold comps map…
Walkable amenities ~0.75 mi
Loading nearby amenities…
Taxation est. · year 1
- Rental income
- $35,280
- − Mortgage interest
- −$7,114
- − Property taxes
- −$1,905
- − Insurance
- −$635
- − Repairs & maintenance
- −$2,822
- − Management
- −$2,822
- − Depreciation
- −$3,695
- Taxable income
- $16,287
- Est. tax owed @ 24.0%
- −$3,909
- After-tax cash flow
- $13,431/yr
For passive investors: Depreciation is non-cash, so a rental often shows a tax loss while cash-flowing — sheltering income. Rental losses are passive: they offset passive income freely, and up to $25,000/yr can offset ordinary (W-2) income if you actively participate and your MAGI is under $100k (phasing out to $0 by $150k); unused losses carry forward. On sale, claimed depreciation is recaptured at up to 25%, and gains may owe capital-gains tax (a 1031 exchange can defer both). Figures are a year-1 estimate at your 24.0% rate — not tax advice; consult a CPA.
Schools (NCES district)
- District
- Ontario-Montclair
- NCES district ID
- 0628470
- Math proficiency
- 35% ▲ 4.00%
- Reading proficiency
- 44% ▲ 2.00%
- Median HH income
- $50,668
- Composite
- 36.57/100
- National rank
- #9282
- State rank
- #731 of 1400 in CA
Livability — Ontario
- Score
- 63/100
- State rank
- #435
- US rank
- #14949
Category grades
Schools grade is shown separately in the Schools card above.
Census & demographics
- Census place
- Ontario, CA
- County
- San Bernardino County · 2,030,291 people
- City population
- 183,440
- Metro
- Riverside-San Bernardino-Ontario, CA
- Population (ZIP)
- 62,935
- Household income
- $100,578
- Rent vs Own
- Severe rent burden
- 1853.0
Population outlook (San Bernardino County) Hauer SSP2
- Today (2025)
- 2,300,329 people
- By 2030
- 2,378,907 · +3.4%
- By 2040
- 2,523,137 · +9.7%
- By 2050
- 2,642,388 · +14.9%
- By 2075
- 2,880,769 · +25.2%
- By 2100
- 2,909,436 · +26.5%
Race, ethnicity, and origin ACS 2023
- Neighborhood character
- Predominantly Hispanic (66%)
- Race & ethnicity
- Hispanic / Latino 66% Two or more races 23% White 15% Asian 9% Black 6% Native American 2%
- Hispanic origin (detail)
- Mexican 59%
- Common ancestry
- Iranian 1% Lithuanian 1% Italian 1%
- Foreign-born
- 24% · Canada, China, Vietnam
- Languages at home
- 51% English-only · Spanish 41% Chinese 3% Tagalog/Filipino 1%
Political lean MEDSL · San Bernardino
- 2024 margin
- Toss-up / Even · D 47.5% · R 49.7% · Other 2.8%
- 2008→2024 swing
- -8.5pp toward R · 2008: 6.3pp · 2024: -2.1pp
- All cycles
- 2024: R+2.1 2020: D+10.7 2016: D+9.8 2012: D+5.4 2008: D+6.3
Not yet ingested
- Civics
- —
Market trends
- HPI YoY
- ▼ -374.91%
- Current HPI
- 400.5674
- Rent YoY
- ▲ 2.39%
- Metro
- Riverside-San Bernardino-Ontario, CA
- State GDP YoY
- ▲ 3.21%
- F500 in state
- 116
Industry mix (Fortune 500 HQ in CA)
| Industry | F500 HQs | Revenue |
|---|---|---|
| Technology | 27 | $1,492B |
|
||
| Financial Services | 3 | $174B |
|
||
| Retail | 3 | $44B |
|
||
| Insurance | 3 | $26B |
|
||
| Media / Entertainment | 2 | $115B |
|
||
| Pharmaceuticals / Biotech | 2 | $62B |
|
||
Price history
+58.8% since first listed23 events — show timeline
- 2026-04-22 Listed $127,000 CRMLS
- 2026-04-22 Coming Soon $127,000 CRMLS
- 2026-04-16 Listing Removed — CRMLS
- 2026-01-26 Price Changed $130,000 CRMLS
- 2026-01-08 Listed $140,000 CRMLS
- 2026-01-06 Coming Soon — CRMLS
- 2025-11-17 Listing Removed — CRMLS
- 2025-10-23 Price Changed $140,000 CRMLS
- 2025-09-26 Listed $145,000 CRMLS
- 2024-09-24 Pending — CRMLS
- 2024-09-09 Listing Removed — CRMLS
- 2024-08-02 Price Changed $135,900 CRMLS
- 2024-07-23 Relisted — CRMLS
- 2024-06-21 Contingent — CRMLS
- 2024-05-31 Listed $129,900 CRMLS
- 2023-10-27 Sold (MLS) $116,500 CRMLS
- 2023-10-22 Contingent — CRMLS
- 2023-05-03 Relisted — CRMLS
- 2023-05-02 Contingent — CRMLS
- 2023-02-03 Listed $129,900 CRMLS
- 2023-01-27 Coming Soon $129,900 CRMLS
- 2021-11-02 Listing Removed — CRMLS
- 2021-10-20 Listed $79,999 CRMLS
Property tax history
+2.3%/yrLatest (2025): $190 · +0.3% YoY. Source: county tax records.
Cash-flow waterfall
monthlySold comps — $/sqft
last 12 mo · ≤1 miLoading sold comps…