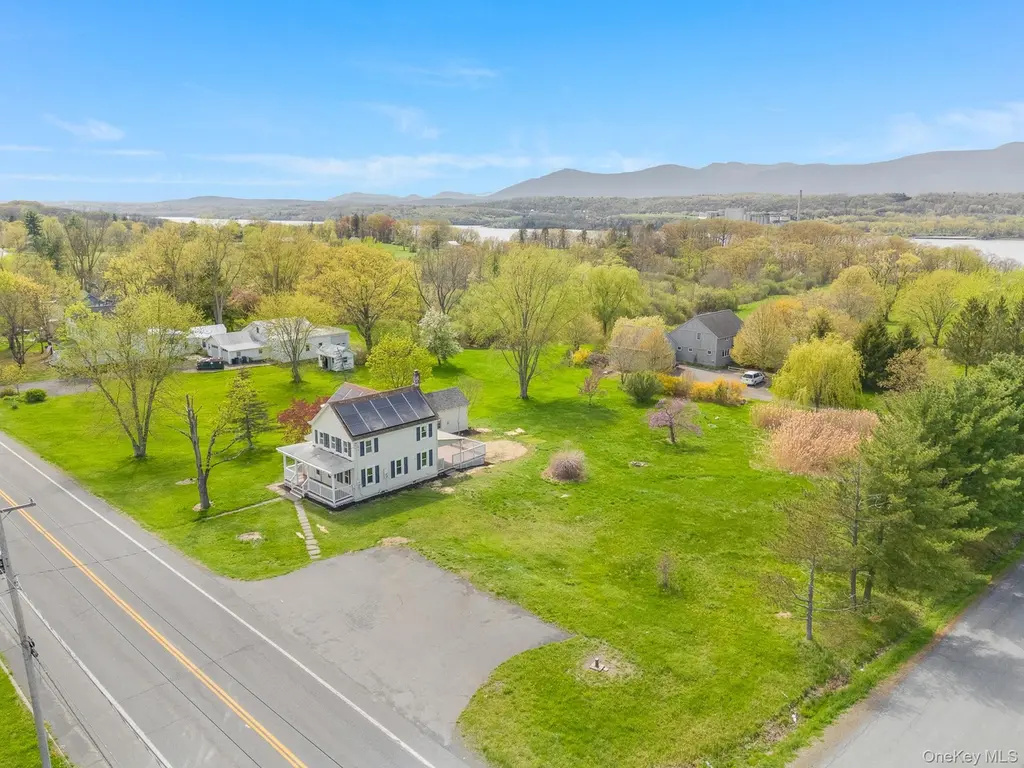
4421 State Route 9G · Germantown, NY
Flood risk 1/10 · Minimal
- FEMA flood zone
- X
- Chance of flooding over 30 yrs
- 0.0%
- Est. flood insurance / yr
- $473 – $860
Fire risk 2/10 · Minimal
- Est. fire insurance / yr
- $691 – $1,283
Heat risk 4/10 · Minor
- Hot days now (above 99°F)
- 7 days/yr
- Hot days in 30 yrs
- 16 days/yr
Wind risk 4/10 · Minor
- Chance of severe wind over 30 yrs
- 9.0%
Air-quality risk 2/10 · Minimal
- Unhealthy air days now
- 0 days/yr
- Unhealthy air days in 30 yrs
- 1 days/yr
Risk factors via First Street. Map © Google.
Why this score? — see what drove the C- grade
The composite is a weighted blend of 9 inputs, each scored 0–100. Each bar is that input's sub-score; the figure is the points it added to the 100-point composite (weight × sub-score).
- ARV discount +15.0/15.0
- Appreciation +10.0/10.0
- Cash flow +9.7/30.0
- Schools +4.8/10.0
- Livability +3.5/5.0
- 1% rule +2.9/10.0
- DSCR +2.8/10.0
- Rent growth +2.5/5.0
- Condition / age +2.5/5.0
$399,000
🖨 Deal sheet 📄 Offer letter ✓ Due diligence
Listing remarks
You’ll appreciate the space and setting this Colonial-style home offers, situated on 0.82 acres in Germantown. A front porch leads you inside to a formal dining room and a spacious living room, with access to an office or den that can easily adapt to your needs. The main level also includes an updated half bathroom and an enclosed sunroom that extends your living space and opens out to a brand-new deck, creating a natural flow for gatherings or quiet evenings at home. The eat-in kitchen features stainless-steel appliances, granite countertops, and a peninsula with enough room to accommodate a dining area. Upstairs, the second level offers three well-proportioned bedrooms and a full ba
Key facts
- Formal dining room
- Brand-new deck
- Enclosed sunroom
Tags
Property features AI
Exterior
- Parking: Driveway
- Utilities: Electricity connected (Central Hudson); Septic system
- Home design: Single family residence; Living area measured
- Construction: Frame and vinyl siding construction
- Exterior features: Frame construction with vinyl siding; Not waterfront
Interior
- Kitchen: Dishwasher; Microwave; Oven; Range; Refrigerator; Stainless steel appliances; Granite counters
- Bedrooms: Total rooms: 7
- Bathrooms: 1 full bath; 1 half bath
- Heating & cooling: Oil heating; Radiant heat; No central cooling
- Interior features: Eat-in kitchen; Formal dining room; Granite countertops; Recessed lighting; Unfinished basement; Unfinished attic
- Laundry & utility: Oil water heater
Neighborhood map
What this means for you Summary
Snapshot
- This is a 3-bed/1.5-bath single-family listed at $399k.
Deal economics
- At list price, monthly cash flow is $-260 ($-3k/yr) — negative.
- To cash-flow at today's rent, offer at most $361k (9.4% below list).
- To meet the 1% rule (rent ≥ 1% of price), the offer needs to be $316k (20.8% below list).
- Recommended offer: $316k (20.8% below list) — sets the bar for 1% rule.
Location & tenants
- Location reads 70/100 on livability (#441 in NY) — a middle-class / working-renter tenant base. Strengths: crime A+, housing A+, employment A; Watch: cost of living D, amenities F, commute F.
- Germantown Central School District (rural): math 54% / reading 51% proficiency, ranked #387 of 755 in NY (top 51%) — acceptable for families but not a draw, mixed tenant base, ~2y average lease.
- Zoned schools: Germantown Elementary School (math 52% / reading 57%, grade C, #908 of 2,108 statewide, top 46%, 276 students, 41% FRL); Germantown Junior-Senior High School (math 57% / reading 54%, grade C, #905 of 1,100 statewide, top 83%, 209 students, 42% FRL).
- Market conditions: 40 active listings in the ZIP; 136 units permitted in Columbia County in 2024 (0 in 5+ unit buildings).
Forward outlook
- In year one you build about $43k of equity ($3k loan paydown + $40k appreciation (10.0% local appreciation)).
- Columbia County population projected at -22% by 2050 — secular population decline; favor cash flow + early exit over multi-decade hold.
- By year 2, paydown + projected appreciation supports a ~$69k cash-out refi (75% LTV) — recoverable capital for the next deal without selling this one.
Negotiation context
- It's been on market 56 days — a 3% lower offer ($387k) is reasonable based on typical stale-listing flexibility.
Risks & watch-outs
- Watch-outs: built in 1910 — expect roof / HVAC / electrical / plumbing capex.
Questions for the listing agent
- What do current leases actually rent for vs. the listed asking? Can we see a recent rent roll and the last 12 months of T-12 income?
- It's been on market 56 days. Have you received any prior offers? Is the seller open to a 21% concession, seller financing, or rate buy-down credit?
- Built in 1910 — when were the roof, HVAC, electrical panel, plumbing, and water heater last replaced?
- Is there a deadline driving the sale (1031 exchange, divorce, estate, relocation)? That informs how much negotiation room exists.
- Schools are B-rated — typically a magnet for longer-tenancy family renters. What's the average tenant stay here, and is there a school-zone premium baked into asking?
- What's the average days-on-market for RENTAL listings here right now (not sales)? A rising rental-DOM trend means longer vacancies and softer asking-rent achievability than the comps imply.
- What's the recent tenant-quality profile in this submarket — average credit score on applications, eviction rate, late-payment / NSF rate, and stable-employment percentage? A property-management company in the area should have these aggregated.
- How much new for-sale + rental construction is in the pipeline within 1–3 miles? Heavy new supply typically softens prices + rents 12–24 months out; constrained supply supports both.
Investment metrics
- 1% rule
- 0.79% ✗
- Cap rate
- 5.51%
- Cash-on-cash
- -2.79%
- DSCR
- 0.88
- GRM
- 10.5
CMA / ARV
- ARV (median comp)
- $523,246
- List price
- $399,000
- Delta
- -23.75%
- Verdict
- UNDERPRICED
- Comps
- 10 within 1.0 mi
Show comp detail 2 sales within ~0.75 mi
| Address | Dist | Beds/Ba | Sqft | Sold | Price | $/sf | Match |
|---|---|---|---|---|---|---|---|
| 1515 Cr 31 | 0.58mi | 3/2.0 | 1,500 (+1%) | 21mo | $429,000 | $286 | 52 |
| 150 Main St | 0.63mi | 3/1.0 | 1,600 (+8%) | 6mo | $150,000 | $94 | 51 |
Match score weights: distance 35% · size 25% · config 20% · recency 20%. Top-matched comps best support the ARV.
Projected returns pro-forma
10.0% appreciation · 3.0% rent growth · sell at horizon
- IRR
- 22.3%
- Equity multiple
- 2.80×
- Total profit
- $200,796
- Equity at exit
- $359,451
- IRR
- 20.0%
- Equity multiple
- 6.41×
- Total profit
- $604,427
- Equity at exit
- $775,169
Cash invested: $111,720 (down + closing). Projections, not guarantees.
Landlord ↔ Tenant lean methodology
- Overall (STATE)
- 15 Strongly Tenant-Friendly
- State New York
- 15 Strongly Tenant-Friendly · D+10
- County
- — inherits STATE
- City
- — inherits STATE
ZIP-level market 12526
- Home prices YoY
- 8.9%
- Active inventory
- 40
- Price-to-rent
- 10.5×
Monthly cashflow live
- Estimated rent
- $3,161 medium interval (Pro) →
- Mortgage (P&I)
- −$2,092
- Tax est. 1.5%
- −$499 /mo · $5,985/yr
- Insurance
- −$166
- HOA
- −$0
- Vacancy / Maint / Mgmt
- −$664
- Net cashflow
- $-260
Break-even live
UW: 25.0% down · 7.5% · 30yr · 1.5% tax · 5.0% vac · 8.0% maint · 8.0% mgmt
Financing live
Cash to close
- Down payment
- $99,750
- Closing costs
- $11,970
- Reserves months
- —
- Total cash needed
- —
Loan-product check · same deal, 3 products live
Conventional
25% down · 7.5% · 30yr
- Down + closing
- —
- Monthly P&I
- —
- Monthly cashflow
- —
- DSCR
- —
- Eligible?
- —
Personal DTI + credit; lowest rate.
DSCR
20% down · 8.5% · 30yr
- Down + closing
- —
- Monthly P&I
- —
- Monthly cashflow
- —
- DSCR
- —
- Eligible?
- —
No personal income docs; deal must DSCR.
Hard money
10% down · 12.0% · 12mo
- Down + closing
- —
- Monthly P&I
- —
- Monthly cashflow
- —
- DSCR
- —
- Eligible?
- —
Short-term bridge; refi at stabilization.
Listing history 17 events
-
2026-06-19days on market $399,000 Active 56 DOM
-
2026-06-18days on market $399,000 Active 55 DOM
-
2026-06-17days on market $399,000 Active 54 DOM
-
2026-06-16days on market $399,000 Active 53 DOM
-
2026-06-15days on market $399,000 Active 52 DOM
-
2026-06-14days on market $399,000 Active 50 DOM
-
2026-06-12days on market $399,000 Active 49 DOM
-
2026-06-09days on market $399,000 Active 46 DOM
-
2026-06-08days on market $399,000 Active 45 DOM
-
2026-06-07days on market $399,000 Active 44 DOM
-
2026-06-07days on market $399,000 Active 43 DOM
-
2026-06-04days on market $399,000 Active 40 DOM
-
2026-06-02days on market $399,000 Active 39 DOM
-
2026-06-01days on market $399,000 Active 38 DOM
-
2026-05-31days on market $399,000 Active 37 DOM
-
2026-05-31days on market $399,000 Active 36 DOM
-
2026-04-24$399,000 Active 1746-char remark
ⓘ Source: listings_history table (triggers on properties + properties_extension) + one-shot
backfill from property_details.listing_events for pre-trigger history.
Climate risk First Street
- Flood 1/10 Low FEMA zone X · 0% chance over 30 yrs
- Wildfire 2/10 Low
- Heat 4/10 Moderate 7 d/yr ≥99°F today · 16 d/yr by 30 yrs out
- Wind 4/10 Moderate 9% chance of damaging wind over 30 yrs
- Air quality 2/10 Low 0 unhealthy d/yr today · 1 by 30 yrs out
Nearby sold comps map
Loading sold comps map…
Walkable amenities ~0.75 mi
Loading nearby amenities…
Taxation est. · year 1
- Rental income
- $37,936
- − Mortgage interest
- −$22,350
- − Property taxes
- −$5,985
- − Insurance
- −$1,995
- − Repairs & maintenance
- −$3,035
- − Management
- −$3,035
- − Depreciation
- −$11,607
- Taxable loss
- −$10,072
- Est. tax savings @ 24.0%
- +$2,417
- After-tax cash flow
- $-702/yr
For passive investors: Depreciation is non-cash, so a rental often shows a tax loss while cash-flowing — sheltering income. Rental losses are passive: they offset passive income freely, and up to $25,000/yr can offset ordinary (W-2) income if you actively participate and your MAGI is under $100k (phasing out to $0 by $150k); unused losses carry forward. On sale, claimed depreciation is recaptured at up to 25%, and gains may owe capital-gains tax (a 1031 exchange can defer both). Figures are a year-1 estimate at your 24.0% rate — not tax advice; consult a CPA.
Schools (NCES district)
- District
- Germantown Central School District
- NCES district ID
- 3612030
- Math proficiency
- 54% ▲ 1.00%
- Reading proficiency
- 51% ▼ -2.00%
- Median HH income
- $60,242
- Composite
- 47.76/100
- National rank
- #4894
- State rank
- #387 of 755 in NY
Livability — Germantown
- Score
- 70/100
- State rank
- #441
- US rank
- #7728
Category grades
Schools grade is shown separately in the Schools card above.
Census & demographics
- Census place
- Germantown, NY
- Population (ZIP)
- 3,427
Population outlook (Columbia County) Hauer SSP2
- Today (2025)
- 58,662 people
- By 2030
- 56,557 · -3.6%
- By 2040
- 51,324 · -12.5%
- By 2050
- 45,790 · -21.9%
- By 2075
- 35,232 · -39.9%
- By 2100
- 25,846 · -55.9%
Race, ethnicity, and origin ACS 2023
- Neighborhood character
- Predominantly White (84%)
- Race & ethnicity
- White 84% Two or more races 8% Hispanic / Latino 6% Black 3%
- Hispanic origin (detail)
- Mexican 1% Puerto Rican 3% Cuban 1%
- Common ancestry
- Romanian 5% Lithuanian 4% Iranian 3%
- Foreign-born
- 8% · Canada, South Korea
- Languages at home
- 93% English-only · Spanish 4% Russian/Polish/Slavic 1% German/W. Germanic 1%
Political lean MEDSL · Columbia
- 2024 margin
- D (+14.7) · D 57.4% · R 42.6%
- 2008→2024 swing
- +1.3pp toward D · 2008: 13.4pp · 2024: 14.7pp
- All cycles
- 2024: D+14.7 2020: D+16.7 2016: D+1.4 2012: D+11.7 2008: D+13.4
Not yet ingested
- Civics
- —
Market trends
- HPI YoY
- ▲ 41.93%
- Current HPI
- 511.9627
- Rent YoY
- —
- Metro
- —
- State GDP YoY
- ▲ 2.60%
- F500 in state
- 92
Industry mix (Fortune 500 HQ in NY)
| Industry | F500 HQs | Revenue |
|---|---|---|
| Financial Services | 10 | $950B |
|
||
| Consumer Goods | 9 | $162B |
|
||
| Insurance | 4 | $225B |
|
||
| Telecommunications | 2 | $144B |
|
||
| Pharmaceuticals | 2 | $112B |
|
||
| Media / Entertainment | 2 | $69B |
|
||
Price history
1 event — show timeline
- 2026-04-24 Listed $399,000 OneKey® MLS as Distributed by MLS Grid
Cash-flow waterfall
monthlySold comps — $/sqft
last 12 mo · ≤1 miLoading sold comps…