1201 Blue Bell Rd · Forestdale, AL
Flood risk No data
- FEMA flood zone
- —
- Chance of flooding over 30 yrs
- —
- Est. flood insurance / yr
- —
Fire risk No data
- Est. fire insurance / yr
- —
Heat risk No data
- Hot days now (above threshold)
- —
- Hot days in 30 yrs
- —
Wind risk No data
- Chance of severe wind over 30 yrs
- —
Air-quality risk No data
- Unhealthy air days now
- —
- Unhealthy air days in 30 yrs
- —
Risk factors via First Street. Map © Google.
Why this score? — see what drove the B grade
The composite is a weighted blend of 9 inputs, each scored 0–100. Each bar is that input's sub-score; the figure is the points it added to the 100-point composite (weight × sub-score).
- Cash flow +30.0/30.0
- ARV discount +15.0/15.0
- DSCR +10.0/10.0
- 1% rule +9.1/10.0
- Livability +2.9/5.0
- Rent growth +2.7/5.0
- Condition / age +2.0/5.0
- Schools +1.8/10.0
- Appreciation +0.0/10.0
$90,000
🖨 Deal sheet 📄 Offer letter ✓ Due diligence
Listing remarks
Great opportunity for first time buyers or investors! Two properties to choose from on corner and adjacent lots; a little TLC brings huge potential. Not an investor, just looking for your new home, we’ve got that! Looking to buy a home that would be a great rental, with a second home to boot, we’ve got that too! Solid and convenient location just minutes from all the happenings that Birmingham has to offer. This home can be purchased with the home MLS number 21451912! Call for info today!
Key facts
- 9,147 sq ft lot
- Built 1939
- Listed 22 days
Neighborhood map
What this means for you Summary
Snapshot
- This is a 3-bed/1.5-bath single-family listed at $90k. Condition is rated fair.
Deal economics
- At list price, monthly cash flow is $379 ($5k/yr) — positive.
- The deal already cash-flows at list — no discount required.
- Meets the 1% rule at list price ($1k rent vs $90k).
- Recommended offer: $89k (1.5% below list) — sets the bar for market timing.
- Cap rate 11.3% vs local median 6.5% in Forestdale — top-decile yield for the area; either an underpriced asset or a hidden risk that comps aren't pricing in. Stress-test before assuming the spread holds.
Location & tenants
- Location reads 58/100 on livability (#367 in AL) — a working-class tenant base; expect higher turnover. Strengths: cost of living A+, housing A+; Watch: employment D+, schools D-, amenities F.
- Jefferson County (suburban): math 9% / reading 32% proficiency, ranked #104 of 129 in AL (top 81%) — low school quality limits family demand, transient renter base, plan for 1-2y turnover.
- Market conditions: Rents flat; 116 active listings in the ZIP; 20 comparable units currently listed for rent nearby; rentals at typical pace (median 19d on market — plan ~3-4 weeks tenant-placement turnaround); 40% of comp listings sitting > 30 days — soft ceiling on asking rent; 2,114 units permitted in Jefferson County in 2024 (556 in 5+ unit buildings).
Forward outlook
- Local home prices are declining (-3.0%/yr); year-one equity from $622 of loan paydown is wiped out by about $3k of value loss. Plan a longer hold.
- Jefferson County population projected to shrink 4% by 2050 — rents likely to lag national; underwrite the cash flow, not the appreciation.
- At projected returns (-3.0% appreciation + 0.7% rent growth), your $25k cash investment doubles in ~9 years — after that, you're playing with house money.
Negotiation context
- It's been on market 23 days — a 2% lower offer ($89k) is reasonable based on typical stale-listing flexibility.
Risks & watch-outs
- Watch-outs: built in 1939 — expect roof / HVAC / electrical / plumbing capex.
Questions for the listing agent
- Have any recent inspections been done? Can we get a copy of the seller's disclosures and any deferred-maintenance estimates?
- Built in 1939 — when were the roof, HVAC, electrical panel, plumbing, and water heater last replaced?
- Is there a deadline driving the sale (1031 exchange, divorce, estate, relocation)? That informs how much negotiation room exists.
- Schools are D-rated, which usually means shorter tenancies and higher turnover. Who's the typical renter profile here, and what's been the actual vacancy rate?
- What's the average days-on-market for RENTAL listings here right now (not sales)? A rising rental-DOM trend means longer vacancies and softer asking-rent achievability than the comps imply.
- What's the recent tenant-quality profile in this submarket — average credit score on applications, eviction rate, late-payment / NSF rate, and stable-employment percentage? A property-management company in the area should have these aggregated.
- How much new for-sale + rental construction is in the pipeline within 1–3 miles? Heavy new supply typically softens prices + rents 12–24 months out; constrained supply supports both.
Investment metrics
- 1% rule
- 1.41% ✓
- Cap rate
- 11.35%
- Cash-on-cash
- 18.04%
- DSCR
- 1.80
- GRM
- 5.9
CMA / ARV
- ARV (median comp)
- $130,758
- List price
- $90,000
- Delta
- -31.17%
- Verdict
- UNDERPRICED
- Comps
- 20 within 1.0 mi
Show comp detail 12 sales within ~0.75 mi
| Address | Dist | Beds/Ba | Sqft | Sold | Price | $/sf | Match |
|---|---|---|---|---|---|---|---|
| 1024 Heflin Ave | 0.39mi | 3/2.0 | 1,275 (-1%) | 5mo | $166,000 | $130 | 74 |
| 528 Blue Bell Rd | 0.14mi | 3/2.0 | 1,192 (-8%) | 8mo | $125,000 | $105 | 72 |
| 620 Blue Bell Rd | 0.06mi | 3/1.0 | 1,180 (-8%) | 16mo | $86,000 | $73 | 67 |
| 524 Shelby St | 0.38mi | 3/2.0 | 1,159 (-10%) | 9mo | $114,000 | $98 | 56 |
| 1001 Dover Ln | 0.25mi | 3/1.5 | 1,482 (+15%) | 12mo | $140,000 | $94 | 54 |
| 1401 Heflin Ave W | 0.67mi | 3/2.0 | 1,232 (-4%) | 8mo | $110,000 | $89 | 53 |
| 1313 Devine Dr | 0.51mi | 3/2.0 | 1,317 (+2%) | 22mo | $162,900 | $124 | 53 |
| 544 Perry St | 0.53mi | 3/1.0 | 1,388 (+8%) | 10mo | $83,000 | $60 | 52 |
| 941 Lynndale Ln | 0.51mi | 3/1.0 | 1,248 (-3%) | 21mo | $105,000 | $84 | 51 |
| 1457 Pratt Hwy | 0.50mi | 3/2.0 | 1,480 (+15%) | 4mo | $110,000 | $74 | 47 |
| 711 Oak Ridge Dr | 0.66mi | 3/1.0 | 1,421 (+10%) | 8mo | $136,000 | $96 | 44 |
| 123 Chickasaw Dr | 0.74mi | 3/1.0 | 1,176 (-9%) | 15mo | $136,500 | $116 | 36 |
Match score weights: distance 35% · size 25% · config 20% · recency 20%. Top-matched comps best support the ARV.
Projected returns pro-forma
-3.0% appreciation · 0.74% rent growth · sell at horizon
- IRR
- 7.0%
- Equity multiple
- 1.27×
- Total profit
- $6,751
- Equity at exit
- $13,419
- IRR
- 14.3%
- Equity multiple
- 2.03×
- Total profit
- $25,982
- Equity at exit
- $7,782
Cash invested: $25,200 (down + closing). Projections, not guarantees.
Landlord ↔ Tenant lean methodology
- Overall (STATE)
- 90 Strongly Landlord-Friendly
- State Alabama
- 90 Strongly Landlord-Friendly · R+15
- County
- — inherits STATE
- City
- — inherits STATE
ZIP-level market 35214
- Home prices YoY
- -20.0%
- Rents YoY
- 0.7%
- Active inventory
- 116
- Price-to-rent
- 5.9×
Monthly cashflow live
- Estimated rent
- $1,267 high interval (Pro) →
- Mortgage (P&I)
- −$472
- Tax est. 1.5%
- −$112 /mo · $1,350/yr
- Insurance
- −$38
- HOA
- −$0
- Vacancy / Maint / Mgmt
- −$266
- Net cashflow
- $379
Break-even live
UW: 25.0% down · 7.5% · 30yr · 1.5% tax · 5.0% vac · 8.0% maint · 8.0% mgmt
Financing live
Cash to close
- Down payment
- $22,500
- Closing costs
- $2,700
- Reserves months
- —
- Total cash needed
- —
Loan-product check · same deal, 3 products live
Conventional
25% down · 7.5% · 30yr
- Down + closing
- —
- Monthly P&I
- —
- Monthly cashflow
- —
- DSCR
- —
- Eligible?
- —
Personal DTI + credit; lowest rate.
DSCR
20% down · 8.5% · 30yr
- Down + closing
- —
- Monthly P&I
- —
- Monthly cashflow
- —
- DSCR
- —
- Eligible?
- —
No personal income docs; deal must DSCR.
Hard money
10% down · 12.0% · 12mo
- Down + closing
- —
- Monthly P&I
- —
- Monthly cashflow
- —
- DSCR
- —
- Eligible?
- —
Short-term bridge; refi at stabilization.
Rent comps 20 comps
| Address | Beds | Baths | Sqft | Rent | $/sqft | DOM | Units | Dist |
|---|---|---|---|---|---|---|---|---|
| 1204 Pratt Hwy Birmingham, AL | 3.0 | 1.0 | 1124 | $1,125 | $1.00 | 15d | 1 | 0.11mi |
| 1137 Pratt Hwy Birmingham, AL | 3.0 | 1.0 | 993 | $1,045 | $1.05 | 1d | 1 | 0.13mi |
| 1147 Oakley Dr Birmingham, AL | 3.0 | 1.0 | 1352 | $1,250 | $0.92 | 43d | 1 | 0.26mi |
| 1143 Oakley Dr Birmingham, AL | 3.0 | 1.0 | 1066 | $1,300 | $1.22 | 43d | 1 | 0.26mi |
| 1344 Pratt Hwy Birmingham, AL | 3.0 | 2.0 | 936 | $980 | $1.05 | 43d | 1 | 0.27mi |
| 905 Lynndale Ln Birmingham, AL | 4.0 | 2.0 | 1625 | $1,550 | $0.95 | 1d | 1 | 0.41mi |
| 305 Rose Hill Rd Birmingham, AL | 3.0 | 1.5 | 1285 | $1,200 | $0.93 | 10d | 1 | 0.44mi |
| 161 Cindy Ln Birmingham, AL | 3.0 | 2.0 | 1388 | $1,425 | $1.03 | 23d | 1 | 0.57mi |
| 656 Kenwood Dr Birmingham, AL | 3.0 | 1.0 | 1252 | $1,175 | $0.94 | 15d | 1 | 0.63mi |
| 617 Ozark Ct Birmingham, AL | 3.0 | 2.0 | 1242 | $1,195 | $0.96 | 3d | 1 | 0.65mi |
| 115 Crabapple Ln Birmingham, AL | 1.0–3.0 | 1.0–2.0 | 906 | $1,027 | $1.13 | 11d | 19 | 0.74mi |
| 629 Lanett Ave Birmingham, AL | 3.0 | 1.0 | 1092 | $1,200 | $1.10 | 43d | 1 | 0.78mi |
| 120 Dewberry Ln Birmingham, AL | 3.0 | 2.0 | 1485 | $1,510 | $1.02 | 19d | 1 | 0.84mi |
| 436 Henry St Birmingham, AL | 3.0 | 2.0 | 1159 | $1,090 | $0.94 | 43d | 1 | 1.02mi |
| 1533 Choctaw Dr Birmingham, AL | 3.0 | 1.0 | 1241 | $1,175 | $0.95 | 43d | 1 | 1.04mi |
| 528 Lamplighter Ln Birmingham, AL | 3.0 | 1.0 | 1114 | $1,220 | $1.10 | 3d | 1 | 1.25mi |
| 1712 Riderwood Trl Birmingham, AL | 3.0 | 1.0 | 1456 | $1,150 | $0.79 | 15d | 1 | 1.26mi |
| 225 Bayberry Rd Birmingham, AL | 3.0 | 1.0 | 1496 | $1,261 | $0.84 | 19d | 1 | 1.28mi |
| 308 Cimmaron Dr Birmingham, AL | 3.0 | 2.0 | 1479 | $1,250 | $0.85 | 43d | 1 | 1.43mi |
| 328 Cimmaron Dr Birmingham, AL | 3.0 | 1.0 | 1472 | $1,100 | $0.75 | 43d | 1 | 1.47mi |
Listing history 1 events
-
2026-05-04$90,000 Active 505-char remark
ⓘ Source: listings_history table (triggers on properties + properties_extension) + one-shot
backfill from property_details.listing_events for pre-trigger history.
Nearby sold comps map
Loading sold comps map…
Walkable amenities ~0.75 mi
Loading nearby amenities…
Taxation est. · year 1
- Rental income
- $15,203
- − Mortgage interest
- −$5,041
- − Property taxes
- −$1,350
- − Insurance
- −$450
- − Repairs & maintenance
- −$1,216
- − Management
- −$1,216
- − Depreciation
- −$2,618
- Taxable income
- $3,311
- Est. tax owed @ 24.0%
- −$795
- After-tax cash flow
- $3,752/yr
For passive investors: Depreciation is non-cash, so a rental often shows a tax loss while cash-flowing — sheltering income. Rental losses are passive: they offset passive income freely, and up to $25,000/yr can offset ordinary (W-2) income if you actively participate and your MAGI is under $100k (phasing out to $0 by $150k); unused losses carry forward. On sale, claimed depreciation is recaptured at up to 25%, and gains may owe capital-gains tax (a 1031 exchange can defer both). Figures are a year-1 estimate at your 24.0% rate — not tax advice; consult a CPA.
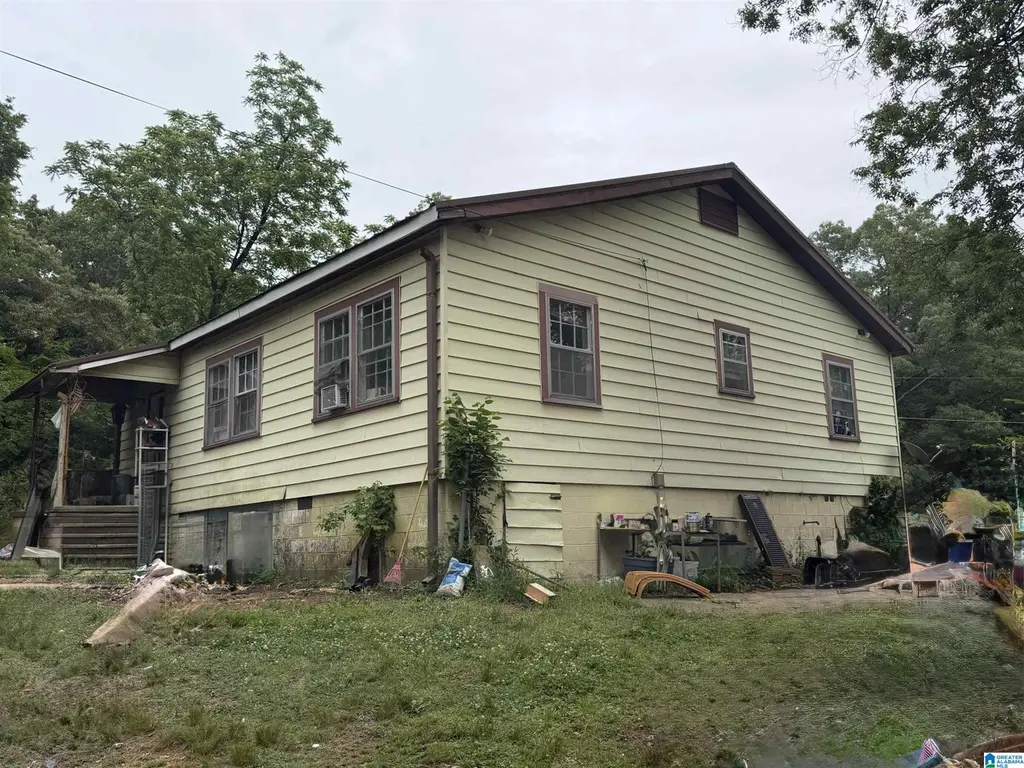
Condition & rehab AI · 1 photo
This property requires moderate renovations to improve its exterior and interior condition, significantly enhancing its resale and rental value.
Repairs flagged
- Major exterior siding — Significant wear and tear
- Major roof — Aged appearance and potential leaks
- Major flooring — Worn and in need of replacement
- Major interior walls/paint — Chipped and worn, requiring repainting
Value-add opportunities
- Both exterior siding replacement — Improves curb appeal and home value
- Both roof repair/replacement — Fixes potential leaks and enhances home value
- Both flooring replacement — Enhances living space and boosts rental value
- Both painting and interior updates — Enhances home aesthetics and boosts resale value
Renovation cost estimate screening
| Repair item | Severity | Est. cost |
|---|---|---|
| exterior siding · Significant wear and tear | Major | $15,000–50,000 |
| roof · Aged appearance and potential leaks | Major | $15,000–50,000 |
| flooring · Worn and in need of replacement | Major | $15,000–50,000 |
| interior walls/paint · Chipped and worn, requiring repainting | Major | $15,000–50,000 |
| Total estimated repair cost · 4 items | $60,000–200,000 |
Value-add ROI direction
- Both exterior siding replacement — Improves curb appeal and home value ↑
- Both roof repair/replacement — Fixes potential leaks and enhances home value ↑
- Both flooring replacement — Enhances living space and boosts rental value ↑
- Both painting and interior updates — Enhances home aesthetics and boosts resale value ↑
ⓘ Cost ranges are severity-bucket heuristics (US national rule-of-thumb). Get contractor quotes + a written scope before underwriting a rehab budget.
Schools (NCES district)
- District
- Jefferson County
- NCES district ID
- 0101920
- Math proficiency
- 9% ▼ -24.00%
- Reading proficiency
- 32% ▼ -5.00%
- Median HH income
- $51,712
- Composite
- 18.4/100
- National rank
- #8937
- State rank
- #104 of 129 in AL
Livability — Forestdale
- Score
- 58/100
- State rank
- #367
- US rank
- #21236
Category grades
Schools grade is shown separately in the Schools card above.
Census & demographics
- Census place
- Forestdale, AL
- County
- Jefferson County · 527,445 people
- City population
- 210,422
- Metro
- Birmingham-Hoover, AL
- Population (ZIP)
- 17,027
- Household income
- $56,383
- Rent vs Own
- Severe rent burden
- 578.0
Population outlook (Jefferson County) Hauer SSP2
- Today (2025)
- 669,185 people
- By 2030
- 669,694 · +0.1%
- By 2040
- 661,388 · -1.2%
- By 2050
- 643,086 · -3.9%
- By 2075
- 577,267 · -13.7%
- By 2100
- 474,758 · -29.1%
Race, ethnicity, and origin ACS 2023
- Neighborhood character
- Predominantly Black (77%)
- Race & ethnicity
- Black 77% White 18% Two or more races 2%
- Foreign-born
- 1% · Canada
- Languages at home
- 98% English-only · Spanish 2%
Political lean MEDSL · Jefferson
- 2024 margin
- D (+10.4) · D 54.6% · R 44.2% · Other 1.2%
- 2008→2024 swing
- +5.4pp toward D · 2008: 5.1pp · 2024: 10.4pp
- All cycles
- 2024: D+10.4 2020: D+13.2 2016: D+7.2 2012: D+6.0 2008: D+5.1
Not yet ingested
- Civics
- —
Market trends
- HPI YoY
- ▼ -54.48%
- Current HPI
- 218.5233
- Rent YoY
- ▲ 0.74%
- Metro
- Birmingham-Hoover, AL
- State GDP YoY
- ▲ 2.94%
- F500 in state
- 4
Industry mix (Fortune 500 HQ in AL)
| Industry | F500 HQs | Revenue |
|---|---|---|
| Financial Services | 1 | $8B |
|
||
| Healthcare | 1 | $5B |
|
||
Cash-flow waterfall
monthlySold comps — $/sqft
last 12 mo · ≤1 miLoading sold comps…