4 Reservoir Rd · Brattleboro, VT
Flood risk 1/10 · Minimal
- FEMA flood zone
- X (unshaded)
- Chance of flooding over 30 yrs
- 0.0%
- Est. flood insurance / yr
- $473 – $860
Fire risk 1/10 · Minimal
- Est. fire insurance / yr
- $480 – $892
Heat risk 2/10 · Minimal
- Hot days now (above 93°F)
- 7 days/yr
- Hot days in 30 yrs
- 15 days/yr
Wind risk 4/10 · Minor
- Chance of severe wind over 30 yrs
- 8.0%
Air-quality risk 2/10 · Minimal
- Unhealthy air days now
- 0 days/yr
- Unhealthy air days in 30 yrs
- 1 days/yr
Risk factors via First Street. Map © Google.
Why this score? — see what drove the B- grade
The composite is a weighted blend of 9 inputs, each scored 0–100. Each bar is that input's sub-score; the figure is the points it added to the 100-point composite (weight × sub-score).
- Cash flow +30.0/30.0
- 1% rule +10.0/10.0
- DSCR +10.0/10.0
- Schools +5.0/10.0
- ARV discount +4.8/15.0
- Livability +3.4/5.0
- Rent growth +2.5/5.0
- Condition / age +2.5/5.0
- Appreciation +0.0/10.0
$78,000
🖨 Deal sheet 📄 Offer letter ✓ Due diligence
Listing remarks MLS
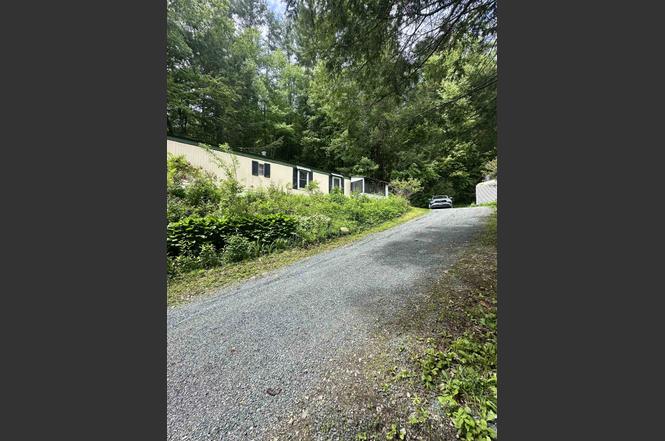
This sweet brightly sunlit home is move in ready and on a quiet dead-end road. This home offers two bedrooms and one full bathroom. Right outside your back door you can enjoy a concrete patio for all your grilling and gathering needs. There are many flower gardens outside that offer an array of colors in the spring and summertime. This home is located in Tri park/Deep wood.
Key facts
- Covered entryway
- Flower beds
- Updated bathroom
Tags
Property features AI
Finance
- Other: Located on association/dead-end/dirt road frontage; Directions available from Route 9 in West Brattleboro (local directions provided)
- HOA & community: Park rent included in a monthly fee of $507; One-time fee of $507 noted
Exterior
- Parking: Driveway surfaced with crushed stone
- Utilities: Public water; Public sewer; Circuit breaker electrical service; Cable internet available; On-site cable and LP/bottle gas
- Home design: Single wide mobile home; Located in the Deepwood mobile park (park-approved)
- Construction: Built in 1982; Aluminum siding; Metal roof
- Exterior features: Open and sloping lot near trails and neighborhood amenities; Walking trails nearby; Near public transportation
Interior
- Bathrooms: 1 full bathroom
- Heating & cooling: Hot air heating
- Interior features: 4 total rooms
Neighborhood map
What this means for you Summary
Snapshot
- This is a 2-bed/1.0-bath manufactured listed at $78k.
Deal economics
- At list price, monthly cash flow is $398 ($5k/yr) — positive.
- The deal already cash-flows at list — no discount required.
- Meets the 1% rule at list price ($2k rent vs $78k).
- Cap rate 12.4% vs local median 4.5% in Brattleboro — top-decile yield for the area; either an underpriced asset or a hidden risk that comps aren't pricing in. Stress-test before assuming the spread holds.
Location & tenants
- Location reads 67/100 on livability (#42 in VT) — a middle-class / working-renter tenant base. Strengths: schools A+, health & safety A+, cost of living B; Watch: crime F, amenities D-, commute F.
- Market conditions: 82 active listings in the ZIP; 188 units permitted in Windham County in 2024 (0 in 5+ unit buildings).
- This rent runs 32% of the median local income ($66k/yr) — at the standard rent-burdened threshold; future hikes will face affordability resistance.
Forward outlook
- Local home prices are declining (-3.0%/yr); year-one equity from $539 of loan paydown is wiped out by about $2k of value loss. Plan a longer hold.
- Windham County population projected at -26% by 2050 — secular population decline; favor cash flow + early exit over multi-decade hold.
- At projected returns (-3.0% appreciation + 3.0% rent growth), your $22k cash investment doubles in ~6 years — after that, you're playing with house money.
Negotiation context
- Only 3 days on market — expect competitive offers; lowballing is unlikely to land.
- 7 sale attempts since 24y ago with the ask held roughly flat each time — persistent listings suggest the price (not the market) is what's stuck; bring a comps-based counter.
- Current owner paid $67k; 16% above their basis — modest negotiation headroom, anchor on the comps not their cost.
Risks & watch-outs
- Watch-outs: HOA is 29% of rent.
Questions for the listing agent
- What does the HOA fee cover, when was the last increase, and are there any pending special assessments or reserve-fund shortfalls?
- Is there a deadline driving the sale (1031 exchange, divorce, estate, relocation)? That informs how much negotiation room exists.
- Schools are A-rated — typically a magnet for longer-tenancy family renters. What's the average tenant stay here, and is there a school-zone premium baked into asking?
- Crime grade is F in this area — have there been break-ins, vandalism, or insurance claims at this property in the last 3 years? What carrier currently insures it and at what premium?
- What's the average days-on-market for RENTAL listings here right now (not sales)? A rising rental-DOM trend means longer vacancies and softer asking-rent achievability than the comps imply.
- What's the recent tenant-quality profile in this submarket — average credit score on applications, eviction rate, late-payment / NSF rate, and stable-employment percentage? A property-management company in the area should have these aggregated.
- How much new for-sale + rental construction is in the pipeline within 1–3 miles? Heavy new supply typically softens prices + rents 12–24 months out; constrained supply supports both.
Investment metrics
- 1% rule
- 2.25% ✓
- Cap rate
- 12.42%
- Cash-on-cash
- 21.89%
- DSCR
- 1.97
- GRM
- 3.7
CMA / ARV
- ARV (on-the-fly)
- $73,528
- Comps found
- 1
Show comp detail 1 sale within ~0.75 mi
| Address | Dist | Beds/Ba | Sqft | Sold | Price | $/sf | Match |
|---|---|---|---|---|---|---|---|
| 6 Thistle Hl | 0.20mi | 2/1.0 | 784 (+8%) | 14mo | $79,000 | $101 | 67 |
Match score weights: distance 35% · size 25% · config 20% · recency 20%. Top-matched comps best support the ARV.
Projected returns pro-forma
-3.0% appreciation · 3.0% rent growth · sell at horizon
- IRR
- 14.8%
- Equity multiple
- 1.60×
- Total profit
- $13,036
- Equity at exit
- $11,630
- IRR
- 23.7%
- Equity multiple
- 3.07×
- Total profit
- $45,254
- Equity at exit
- $6,744
Cash invested: $21,840 (down + closing). Projections, not guarantees.
Landlord ↔ Tenant lean methodology
- Overall (STATE)
- 41 Moderately Tenant-Leaning
- State Vermont
- 41 Moderately Tenant-Leaning · D+15
- County
- — inherits STATE
- City
- — inherits STATE
ZIP-level market 05301
- Home prices YoY
- -19.2%
- Active inventory
- 82
- Price-to-rent
- 3.7×
Monthly cashflow live
- Estimated rent
- $1,756 medium interval (Pro) →
- Mortgage (P&I)
- −$409
- Tax from tax record
- −$40 /mo · $486/yr
- Insurance
- −$32
- HOA
- −$507
- Vacancy / Maint / Mgmt
- −$369
- Net cashflow
- $398
Break-even live
UW: 25.0% down · 7.5% · 30yr · 1.5% tax · 5.0% vac · 8.0% maint · 8.0% mgmt
Financing live
Cash to close
- Down payment
- $19,500
- Closing costs
- $2,340
- Reserves months
- —
- Total cash needed
- —
Loan-product check · same deal, 3 products live
Conventional
25% down · 7.5% · 30yr
- Down + closing
- —
- Monthly P&I
- —
- Monthly cashflow
- —
- DSCR
- —
- Eligible?
- —
Personal DTI + credit; lowest rate.
DSCR
20% down · 8.5% · 30yr
- Down + closing
- —
- Monthly P&I
- —
- Monthly cashflow
- —
- DSCR
- —
- Eligible?
- —
No personal income docs; deal must DSCR.
Hard money
10% down · 12.0% · 12mo
- Down + closing
- —
- Monthly P&I
- —
- Monthly cashflow
- —
- DSCR
- —
- Eligible?
- —
Short-term bridge; refi at stabilization.
HOA detail
- Monthly dues
- $507 · $6,084/yr
Listing history 4 events
-
2026-06-18days on market $78,000 Active 3 DOM
-
2026-06-17days on market $78,000 Active 2 DOM
-
2026-06-15remarks 273-char remark
-
2026-06-15$78,000 Active 1 DOM
ⓘ Source: listings_history table (triggers on properties + properties_extension) + one-shot
backfill from property_details.listing_events for pre-trigger history.
Tax reassessment forecast VT · Partial reset (capped growth)
- Current annual tax
- $486 · $40/mo
- Projected year-2 tax
- $984 · $82/mo
- Expected delta
- +$498/yr (+$42/mo · 102.6%)
ⓘ Screening estimate from a state-policy table — verify with the county assessor before closing.
Climate risk First Street
- Flood 1/10 Low FEMA zone X (unshaded) · 0% chance over 30 yrs
- Wildfire 1/10 Low
- Heat 2/10 Low 7 d/yr ≥93°F today · 15 d/yr by 30 yrs out
- Wind 4/10 Moderate 8% chance of damaging wind over 30 yrs
- Air quality 2/10 Low 0 unhealthy d/yr today · 1 by 30 yrs out
Nearby sold comps map
Loading sold comps map…
Walkable amenities ~0.75 mi
Loading nearby amenities…
Taxation est. · year 1
- Rental income
- $21,074
- − Mortgage interest
- −$4,369
- − Property taxes
- −$486
- − Insurance
- −$390
- − Repairs & maintenance
- −$1,686
- − Management
- −$1,686
- − HOA
- −$6,084
- − Depreciation
- −$2,269
- Taxable income
- $4,104
- Est. tax owed @ 24.0%
- −$985
- After-tax cash flow
- $3,795/yr
For passive investors: Depreciation is non-cash, so a rental often shows a tax loss while cash-flowing — sheltering income. Rental losses are passive: they offset passive income freely, and up to $25,000/yr can offset ordinary (W-2) income if you actively participate and your MAGI is under $100k (phasing out to $0 by $150k); unused losses carry forward. On sale, claimed depreciation is recaptured at up to 25%, and gains may owe capital-gains tax (a 1031 exchange can defer both). Figures are a year-1 estimate at your 24.0% rate — not tax advice; consult a CPA.
Schools (NCES district)
No district data.
Livability — Brattleboro
- Score
- 67/100
- State rank
- #42
- US rank
- #10223
Category grades
Schools grade is shown separately in the Schools card above.
Census & demographics
- Census place
- West Brattleboro, VT
- County
- Windham County · 16,955 people
- City population
- 16,955
- Metro
- nan
- Population (ZIP)
- 16,955
- Household income
- $65,910
- Rent vs Own
- Severe rent burden
- 594.0
Population outlook (Windham County) Hauer SSP2
- Today (2025)
- 40,432 people
- By 2030
- 38,472 · -4.8%
- By 2040
- 33,954 · -16.0%
- By 2050
- 29,774 · -26.4%
- By 2075
- 22,351 · -44.7%
- By 2100
- 15,961 · -60.5%
Race, ethnicity, and origin ACS 2023
- Neighborhood character
- Predominantly White (90%)
- Race & ethnicity
- White 90% Two or more races 6% Hispanic / Latino 3% Asian 2%
- Common ancestry
- Lithuanian 7% Romanian 5% Italian 4%
- Foreign-born
- 2% · Canada
- Languages at home
- 97% English-only · Spanish 2% Other Asian/Pacific 1%
Political lean MEDSL · Windham
- 2024 margin
- Solid D (+42.7) · D 69.6% · R 26.9% · Other 3.5%
- 2008→2024 swing
- -5.4pp toward R · 2008: 48.1pp · 2024: 42.7pp
- All cycles
- 2024: D+42.7 2020: D+47.3 2016: D+42.0 2012: D+49.2 2008: D+48.1
Not yet ingested
- Civics
- —
Market trends
- HPI YoY
- ▼ -67.19%
- Current HPI
- 283.2338
- Rent YoY
- —
- Metro
- nan
- State GDP YoY
- —
- F500 in state
- 0
Price history
+687.9% since first listed19 events — show timeline
- 2026-06-15 Listed $78,000 PrimeMLS
- 2024-02-02 Sold (Public Records) $67,000 Public Records
- 2024-02-01 Sold (MLS) $67,000 PrimeMLS
- 2024-01-01 Pending — PrimeMLS
- 2023-11-27 Relisted — PrimeMLS
- 2023-11-24 Pending — PrimeMLS
- 2023-11-17 Listed $67,000 PrimeMLS
- 2023-03-17 Sold (Public Records) $60,000 Public Records
- 2023-03-10 Sold (MLS) $60,000 PrimeMLS
- 2023-02-03 Pending — PrimeMLS
- 2023-01-30 Relisted — PrimeMLS
- 2023-01-25 Pending — PrimeMLS
- 2023-01-20 Listed $60,000 PrimeMLS
- 2021-08-09 Sold (Public Records) $30,000 Public Records
- 2009-04-06 Sold (Public Records) $25,000 Public Records
- 2009-04-02 Sold (MLS) $25,000 PrimeMLS
- 2008-10-15 Listed $27,000 PrimeMLS
- 2002-06-18 Sold (MLS) $9,900 PrimeMLS
- 2002-03-23 Listed $9,900 PrimeMLS
Property tax history
-3.7%/yrLatest (2024): $486 · +20.6% YoY. Source: county tax records.
Cash-flow waterfall
monthlySold comps — $/sqft
last 12 mo · ≤1 miLoading sold comps…