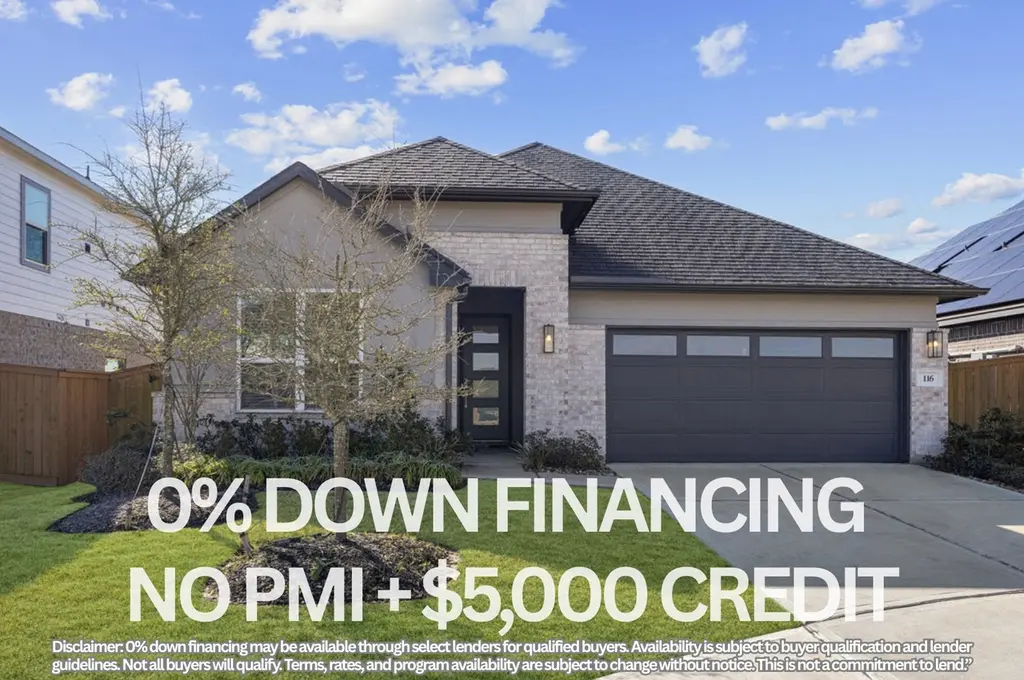
116 Solana Point Dr · Katy, TX
Flood risk 6/10 · Moderate
- FEMA flood zone
- X (unshaded)
- Chance of flooding over 30 yrs
- 0.9%
- Est. flood insurance / yr
- $507 – $1,088
Fire risk 4/10 · Minor
- Est. fire insurance / yr
- $1,222 – $2,270
Heat risk 8/10 · Major
- Hot days now (above 111°F)
- 6 days/yr
- Hot days in 30 yrs
- 18 days/yr
Wind risk 9/10 · Severe
- Chance of severe wind over 30 yrs
- 99.0%
Air-quality risk 2/10 · Minimal
- Unhealthy air days now
- 1 days/yr
- Unhealthy air days in 30 yrs
- 1 days/yr
Risk factors via First Street. Map © Google.
Why this score? — see what drove the D grade
The composite is a weighted blend of 9 inputs, each scored 0–100. Each bar is that input's sub-score; the figure is the points it added to the 100-point composite (weight × sub-score).
- ARV discount +15.0/15.0
- Cash flow +6.9/30.0
- Schools +5.7/10.0
- 1% rule +4.7/10.0
- Condition / age +4.0/5.0
- Livability +3.8/5.0
- Rent growth +2.3/5.0
- DSCR +1.2/10.0
- Appreciation +0.0/10.0
$305,000
🖨 Deal sheet (PDF) 📄 Offer letter ✓ Due diligence
Listing remarks
Fall in love with this beautiful 4-bedroom home featuring premium upgrades. The open-concept floor plan has luxury finishes throughout, including brand-new LV plank floors, a stucco exterior, and four-sided brick. Fully equipped with KitchenAid and Whirlpool appliances, whole-house water filtration/softener, ceiling fans, blinds, gutters, and a full sprinkler system, this home is truly better-than-new. Enjoy monthly savings with the included solar panels. The primary suite features dual vanities and a walk-in closet, while the secondary bedrooms offer flexibility for families, guests, or a home office. This lot is in a prime location in the community, no back neighbors, and 1/2 mile from Cr
Key facts
- Whirlpool appliances
- Stucco exterior
- Four-sided brick
Tags
Property features AI
Finance
- HOA & community: Association: GrandManor; Annual association fee; Community amenities include clubhouse, fitness center, playground, dog park, park, trails, pool, pickleball, beach access/rights
Exterior
- Parking: Attached 2-car garage
- Security: Prewired for security; Security system owned
- Utilities: Public water; Public sewer
- Home design: Residential property; Faces north; Built in 2022; Slab foundation
- Construction: Brick and stucco exterior; Composition roof; Built in 2022
- Exterior features: Covered patio; Deck; Patio; Private yard; Fence (back yard); Sprinkler/irrigation; Tennis court(s); Association pool
Interior
- Kitchen: Dishwasher; Electric oven; Gas cooktop; Garbage disposal; Microwave; Refrigerator
- Bedrooms: Primary bedroom (First floor) — 16x14; Bedroom (First floor) — 12x11; Bedroom (First floor) — 12x12; Bedroom (First floor) — 11x10
- Flooring: Plank flooring; Vinyl flooring
- Bathrooms: 2 full bathrooms
- Heating & cooling: Central heating (gas); Central electric air conditioning; Has heating; Has cooling
- Interior features: Breakfast bar; Double vanity; Kitchen island; Kitchen/family room combo; Pantry; Soaking tub; Separate shower; Window treatments; Ceiling fans; Kitchen/dining combo; Reverse osmosis system; Low emissivity windows; Window coverings; Water softener (owned); Tankless water heater
- Laundry & utility: Washer; Dryer; Washer hookup; Electric dryer hookup; Gas dryer hookup
Neighborhood map
What this means for you Summary
Snapshot
- This is a 4-bed/2.0-bath single-family listed at $305k. Condition is rated good.
Deal economics
- At list price, monthly cash flow is $-455 ($-5k/yr) — negative.
- To cash-flow at today's rent, offer at most $229k (24.8% below list).
- To meet the 1% rule (rent ≥ 1% of price), the offer needs to be $296k (2.9% below list).
- Recommended offer: $229k (24.8% below list) — sets the bar for cash-flow.
- Cap rate 4.5% vs local median 3.0% in Katy — top-decile yield for the area; either an underpriced asset or a hidden risk that comps aren't pricing in. Stress-test before assuming the spread holds.
Location & tenants
- Location reads 76/100 on livability (#111 in TX, #3,613 nationally) — a middle-class / working-renter tenant base. Strengths: employment A+, cost of living A+, housing A+; Watch: crime C-, amenities D, commute F.
- Katy ISD (suburban): math 61% / reading 63% proficiency, ranked #29 of 826 in TX (top 4%) — acceptable for families but not a draw, mixed tenant base, ~2y average lease.
- Zoned schools: Katy El (math 63% / reading 61%, grade B, #321 of 4,322 statewide, top 8%, 682 students, 26% FRL); Katy J H (math 52% / reading 51%, grade C, #318 of 1,662 statewide, top 20%, 1,094 students, 53% FRL); Katy H S (math 62% / reading 74%, grade B, #150 of 1,632 statewide, top 10%, 3,330 students, 38% FRL).
- Market conditions: Rents soft (-0.8%/yr); 2729 active listings in the ZIP; 7 comparable units currently listed for rent nearby; rentals leasing fast (median 7d on market — plan ~1-2 weeks tenant-placement turnaround); 43% of comp listings sitting > 30 days — soft ceiling on asking rent; high-income renter base; 483 units permitted in Waller County in 2024 (89 in 5+ unit buildings).
- This rent runs 30% of the median local income ($118k/yr) — at the standard rent-burdened threshold; future hikes will face affordability resistance.
Forward outlook
- Local home prices are declining (-3.0%/yr); year-one equity from $2k of loan paydown is wiped out by about $9k of value loss. Plan a longer hold.
- Waller County population projected at +62% by 2050 — long-run rental-demand tailwind backs the buy-and-hold thesis.
Negotiation context
- It's been on market 31 days — a 3% lower offer ($296k) is reasonable based on typical stale-listing flexibility.
- 2 sale attempts with the ask held roughly flat each time — persistent listings suggest the price (not the market) is what's stuck; bring a comps-based counter.
Risks & watch-outs
- Watch-outs: property tax is 3.8% of price.
- Climate carrying-cost: major flood risk; severe wind risk, 99% chance of damaging wind over 30y; extreme-heat days projected 6→18/yr by 2055 (HVAC capex compounding) — expect insurance premiums to compound above CPI over the hold.
Questions for the listing agent
- What do current leases actually rent for vs. the listed asking? Can we see a recent rent roll and the last 12 months of T-12 income?
- It's been on market 31 days. Have you received any prior offers? Is the seller open to a 25% concession, seller financing, or rate buy-down credit?
- Property tax is high relative to price — has the assessment been appealed recently, and will the sale trigger a re-assessment?
- What does the HOA fee cover, when was the last increase, and are there any pending special assessments or reserve-fund shortfalls?
- Is there a deadline driving the sale (1031 exchange, divorce, estate, relocation)? That informs how much negotiation room exists.
- Schools are B-rated — typically a magnet for longer-tenancy family renters. What's the average tenant stay here, and is there a school-zone premium baked into asking?
- The area grade is low — what's the realistic commute time and amenity access for the typical tenant pool here? Any planned neighborhood developments (good or bad) we should know about?
- What's the average days-on-market for RENTAL listings here right now (not sales)? A rising rental-DOM trend means longer vacancies and softer asking-rent achievability than the comps imply.
- What's the recent tenant-quality profile in this submarket — average credit score on applications, eviction rate, late-payment / NSF rate, and stable-employment percentage? A property-management company in the area should have these aggregated.
- How much new for-sale + rental construction is in the pipeline within 1–3 miles? Heavy new supply typically softens prices + rents 12–24 months out; constrained supply supports both.
Investment metrics
- 1% rule
- 0.97% ✗
- Cap rate
- 4.50%
- Cash-on-cash
- -6.40%
- DSCR
- 0.72
- GRM
- 8.6
CMA / ARV
- ARV (median comp)
- $370,288
- List price
- $305,000
- Delta
- -11.15%
- Verdict
- UNDERPRICED
- Comps
- 20 within 1.0 mi
Show comp detail 12 sales within ~0.75 mi
| Address | Dist | Beds/Ba | Sqft | Sold | Price | $/sf | Match |
|---|---|---|---|---|---|---|---|
| 409 Aurora Creek Ln | 0.26mi | 4/2.5 | 1,915 (+2%) | 15mo | $340,400 | $178 | 70 |
| 109 Sea Glass Cv | 0.21mi | 3/2.5 (-1) | 1,977 (+6%) | 7mo | $319,000 | $161 | 68 |
| 408 Long Beach Bay Dr | 0.28mi | 3/2.5 (-1) | 1,988 (+6%) | 5mo | $300,000 | $151 | 65 |
| 155 Solana Point Dr | 0.14mi | 3/2.0 (-1) | 2,017 (+8%) | 13mo | $355,000 | $176 | 65 |
| 104 Solana Point Dr | 0.03mi | 4/3.0 | 2,136 (+14%) | 7mo | $309,990 | $145 | 65 |
| 27119 Angel Creek Ln | 0.40mi | 3/2.5 (-1) | 1,866 (-0%) | 15mo | $351,165 | $188 | 62 |
| 562 Long Beach Bay | 0.45mi | 4/3.0 | 1,948 (+4%) | 14mo | $334,900 | $172 | 57 |
| 437 Aurora Creek Ln | 0.30mi | 3/2.0 (-1) | 1,717 (-8%) | 13mo | $288,000 | $168 | 57 |
| 2476 Fairway Harbor Dr | 0.70mi | 3/2.0 (-1) | 1,850 (-1%) | 6mo | $358,885 | $194 | 55 |
| 800 Stella Vista Ct | 0.37mi | 3/2.0 (-1) | 1,999 (+7%) | 13mo | $399,000 | $200 | 55 |
| 2408 Seamist Cove Ln | 0.69mi | 3/2.0 (-1) | 1,850 (-1%) | 12mo | $389,332 | $210 | 51 |
| 479 Long Beach Bay Dr | 0.40mi | 3/2.0 (-1) | 1,592 (-15%) | 6mo | $299,000 | $188 | 47 |
Match score weights: distance 35% · size 25% · config 20% · recency 20%. Top-matched comps best support the ARV.
Projected returns pro-forma
-3.0% appreciation · 0.0% rent growth · sell at horizon
- IRR
- -31.9%
- Equity multiple
- -0.01×
- Total profit
- $-86,638
- Equity at exit
- $45,476
- IRR
- -68.6%
- Equity multiple
- -0.69×
- Total profit
- $-144,435
- Equity at exit
- $26,371
Cash invested: $85,400 (down + closing). Projections, not guarantees.
Landlord ↔ Tenant lean methodology
- Overall (STATE)
- 87 Strongly Landlord-Friendly
- State Texas
- 87 Strongly Landlord-Friendly · R+5
- County
- — inherits STATE
- City
- — inherits STATE
ZIP-level market 77493
- Rents YoY
- -0.8%
- Active inventory
- 2729
- Price-to-rent
- 8.6×
Monthly cashflow live
- Estimated rent
- $2,962 high interval (Pro) →
- Mortgage (P&I)
- −$1,599
- Tax from tax record
- −$956 /mo · $11,469/yr
- Insurance
- −$127
- HOA
- −$113
- Vacancy / Maint / Mgmt
- −$622
- Net cashflow
- $-455
Break-even live
Sensitivity live
| Price | -10% $-283 | -5% $-369 | +0% $-455 | +5% $-542 | +10% $-628 |
|---|---|---|---|---|---|
| Rent | -10% $-689 | -5% $-572 | +0% $-455 | +5% $-338 | +10% $-221 |
| Rate | -1.0pp $-302 | -0.5pp $-378 | base $-455 | +0.5pp $-534 | +1.0pp $-615 |
UW: 25.0% down · 7.5% · 30yr · 1.5% tax · 5.0% vac · 8.0% maint · 8.0% mgmt
Financing live
Cash to close
- Down payment
- $76,250
- Closing costs
- $9,150
- Reserves months
- —
- Total cash needed
- —
Loan-product check · same deal, 3 products live
Conventional
25% down · 7.5% · 30yr
- Down + closing
- —
- Monthly P&I
- —
- Monthly cashflow
- —
- DSCR
- —
- Eligible?
- —
Personal DTI + credit; lowest rate.
DSCR
20% down · 8.5% · 30yr
- Down + closing
- —
- Monthly P&I
- —
- Monthly cashflow
- —
- DSCR
- —
- Eligible?
- —
No personal income docs; deal must DSCR.
Hard money
10% down · 12.0% · 12mo
- Down + closing
- —
- Monthly P&I
- —
- Monthly cashflow
- —
- DSCR
- —
- Eligible?
- —
Short-term bridge; refi at stabilization.
Rent comps 7 comps
| Address | Beds | Baths | Sqft | Rent | $/sqft | DOM | Units | Dist |
|---|---|---|---|---|---|---|---|---|
| 28625 Clay Rd Katy, TX | 4.0 | 2.0 | 1872 | $2,000 | $1.07 | 45d | 1 | 0.72mi |
| 1495 Twilight Green Dr Katy, TX | 3.0 | 2.5 | 2000 | $2,400 | $1.20 | 45d | 1 | 0.96mi |
| 27035 Beacon Glen Dr Katy, TX | 2.0–4.0 | 2.0–3.0 | 1890 | $3,949 | $2.09 | 0d | 17 | 0.97mi |
| 2654 Aruba Bend Dr Katy, TX | 3.0–5.0 | 2.0–3.0 | 1958 | $3,015 | $1.54 | 0d | 50 | 1.02mi |
| 2845 Shimmer Edge Dr Katy, TX | 3.0 | 3.0 | 2362 | $2,400 | $1.02 | 7d | 1 | 1.15mi |
| 3004 Fall Gold Ln Katy, TX | 5.0 | 3.0 | 2156 | $3,850 | $1.79 | 45d | 1 | 1.35mi |
| 3004 Fall Gold Ln Katy, TX | 5.0 | 3.0 | 2156 | $2,599 | $1.21 | 0d | 1 | 1.35mi |
HOA detail
- Monthly dues
- $113 · $1,356/yr
- Likely covers
- waterpool
Listing history 17 events
-
2026-06-21days on market $305,000 Active 31 DOM
-
2026-06-18days on market $305,000 Active 28 DOM
-
2026-06-17days on market $305,000 Active 27 DOM
-
2026-06-16days on market $305,000 Active 26 DOM
-
2026-06-15days on market $305,000 Active 25 DOM
-
2026-06-13days on market $305,000 Active 23 DOM
-
2026-06-09days on market $305,000 Active 19 DOM
-
2026-06-08days on market $305,000 Active 18 DOM
-
2026-06-07days on market $305,000 Active 17 DOM
-
2026-06-04days on market $305,000 Active 14 DOM
-
2026-06-03days on market $305,000 Active 13 DOM
-
2026-06-02days on market $305,000 Active 12 DOM
-
2026-06-01days on market $305,000 Active 11 DOM
-
2026-05-31days on market $305,000 Active 10 DOM
-
2026-05-14price $305,000 997-char remark
-
2026-04-27price $329,000 997-char remark
-
2026-01-30$350,000 Active 997-char remark
ⓘ Source: listings_history table (triggers on properties + properties_extension) + one-shot
backfill from property_details.listing_events for pre-trigger history.
Tax reassessment forecast TX · Resets to sale price
- Current annual tax
- $11,469 · $956/mo
- Projected year-2 tax
- $11,469 · $956/mo
- Expected delta
- $0/yr ($0/mo · 0.0%)
ⓘ Screening estimate from a state-policy table — verify with the county assessor before closing.
Climate risk First Street
- Flood 6/10 Major FEMA zone X (unshaded) · 90% chance over 30 yrs
- Wildfire 4/10 Moderate
- Heat 8/10 Severe 6 d/yr ≥111°F today · 18 d/yr by 30 yrs out
- Wind 9/10 Extreme 99% chance of damaging wind over 30 yrs
- Air quality 2/10 Low 1 unhealthy d/yr today · 1 by 30 yrs out
Nearby sold comps map
Loading sold comps map…
Walkable amenities ~0.75 mi
Loading nearby amenities…
Taxation est. · year 1
- Rental income
- $35,543
- − Mortgage interest
- −$17,085
- − Property taxes
- −$11,469
- − Insurance
- −$1,525
- − Repairs & maintenance
- −$2,843
- − Management
- −$2,843
- − HOA
- −$1,356
- − Depreciation
- −$8,873
- Taxable loss
- −$10,451
- Est. tax savings @ 24.0%
- +$2,508
- After-tax cash flow
- $-2,956/yr
For passive investors: Depreciation is non-cash, so a rental often shows a tax loss while cash-flowing — sheltering income. Rental losses are passive: they offset passive income freely, and up to $25,000/yr can offset ordinary (W-2) income if you actively participate and your MAGI is under $100k (phasing out to $0 by $150k); unused losses carry forward. On sale, claimed depreciation is recaptured at up to 25%, and gains may owe capital-gains tax (a 1031 exchange can defer both). Figures are a year-1 estimate at your 24.0% rate — not tax advice; consult a CPA.
Condition & rehab AI · 12 photos
This beautiful 4-bedroom home features premium upgrades and is in excellent condition, ready for immediate occupancy.
Value-add opportunities
- Both Landscaping and patio area — Enhances curb appeal and outdoor living space.
- Both Smart home integration — Improves convenience and energy efficiency.
- Both Smart security system — Enhances safety and peace of mind for potential buyers/renters.
Renovation cost estimate screening
Value-add ROI direction
- Both Landscaping and patio area — Enhances curb appeal and outdoor living space. ↑
- Both Smart home integration — Improves convenience and energy efficiency. ↑
- Both Smart security system — Enhances safety and peace of mind for potential buyers/renters. ↑
ⓘ Cost ranges are severity-bucket heuristics (US national rule-of-thumb). Get contractor quotes + a written scope before underwriting a rehab budget.
Schools (NCES district)
- District
- Katy ISD
- NCES district ID
- 4825170
- Math proficiency
- 61% ▼ -7.00%
- Reading proficiency
- 63% ▼ -3.00%
- Median HH income
- $90,312
- Composite
- 56.59/100
- National rank
- #1146
- State rank
- #29 of 826 in TX
Livability — Katy
- Score
- 76/100
- State rank
- #111
- US rank
- #3613
Category grades
Schools grade is shown separately in the Schools card above.
Census & demographics
- County
- Harris County · 4,702,590 people
- City population
- 3,226,434
- Metro
- Houston-The Woodlands-Sugar Land, TX
- Population (ZIP)
- 71,484
- Household income
- $118,464
- Rent vs Own
- Severe rent burden
- 913.0
Population outlook (Waller County) Hauer SSP2
- Today (2025)
- 60,772 people
- By 2030
- 67,616 · +11.3%
- By 2040
- 82,283 · +35.4%
- By 2050
- 98,276 · +61.7%
- By 2075
- 142,860 · +135.1%
- By 2100
- 175,596 · +188.9%
Race, ethnicity, and origin ACS 2023
- Neighborhood character
- Highly diverse neighborhood (Simpson 0.73)
- Race & ethnicity
- White 36% Hispanic / Latino 33% Two or more races 16% Black 15% Asian 12%
- Hispanic origin (detail)
- Mexican 20%
- Common ancestry
- Lithuanian 2% Slovak 1% Italian 1%
- Foreign-born
- 21% · Canada, Vietnam, Jamaica
- Languages at home
- 64% English-only · Spanish 22% Vietnamese 5% French/Haitian/Cajun 4%
Political lean MEDSL · Waller
- 2024 margin
- Strong R (+25.0) · D 37.0% · R 62.0% · Other 1.0%
- 2008→2024 swing
- -17.9pp toward R · 2008: -7.2pp · 2024: -25.0pp
- All cycles
- 2024: R+25.0 2020: R+26.7 2016: R+28.6 2012: R+17.6 2008: R+7.2
Not yet ingested
- Civics
- —
Market trends
- HPI YoY
- ▼ -140.65%
- Current HPI
- 233.1683
- Rent YoY
- ▼ -0.80%
- Metro
- Houston-The Woodlands-Sugar Land, TX
- State GDP YoY
- ▲ 3.95%
- F500 in state
- 110
Industry mix (Fortune 500 HQ in TX)
| Industry | F500 HQs | Revenue |
|---|---|---|
| Energy | 16 | $1,198B |
|
||
| Technology | 5 | $198B |
|
||
| Engineering / Construction | 4 | $72B |
|
||
| Energy Services | 3 | $60B |
|
||
| Utilities | 3 | $41B |
|
||
| Healthcare | 2 | $330B |
|
||
Price history
-12.9% since first listed5 events — show timeline
- 2026-05-21 Listed $305,000 HARMLS
- 2026-05-20 Listing Removed — HARMLS
- 2026-05-14 Price Changed $305,000 HARMLS
- 2026-04-27 Price Changed $329,000 HARMLS
- 2026-01-30 Listed $350,000 HARMLS
Property tax history
+97.6%/yrLatest (2025): $11,469 · -0.6% YoY. Source: county tax records.
Cash-flow waterfall
monthlySold comps — $/sqft
last 12 mo · ≤1 miLoading sold comps…