502 W Main St · Agency, IA
Flood risk 1/10 · Minimal
- FEMA flood zone
- X (unshaded)
- Chance of flooding over 30 yrs
- 0.0%
- Est. flood insurance / yr
- $473 – $860
Fire risk 4/10 · Minor
- Est. fire insurance / yr
- $902 – $1,676
Heat risk 3/10 · Minor
- Hot days now (above 106°F)
- 7 days/yr
- Hot days in 30 yrs
- 15 days/yr
Wind risk 2/10 · Minimal
- Chance of severe wind over 30 yrs
- —
Air-quality risk 2/10 · Minimal
- Unhealthy air days now
- 1 days/yr
- Unhealthy air days in 30 yrs
- 2 days/yr
Risk factors via First Street. Map © Google.
Why this score? — see what drove the B- grade
The composite is a weighted blend of 9 inputs, each scored 0–100. Each bar is that input's sub-score; the figure is the points it added to the 100-point composite (weight × sub-score).
- Cash flow +20.7/30.0
- ARV discount +15.0/15.0
- Appreciation +8.0/10.0
- DSCR +6.6/10.0
- 1% rule +5.7/10.0
- Schools +4.7/10.0
- Livability +3.4/5.0
- Rent growth +2.5/5.0
- Condition / age +2.5/5.0
$119,000
🖨 Deal sheet 📄 Offer letter ✓ Due diligence
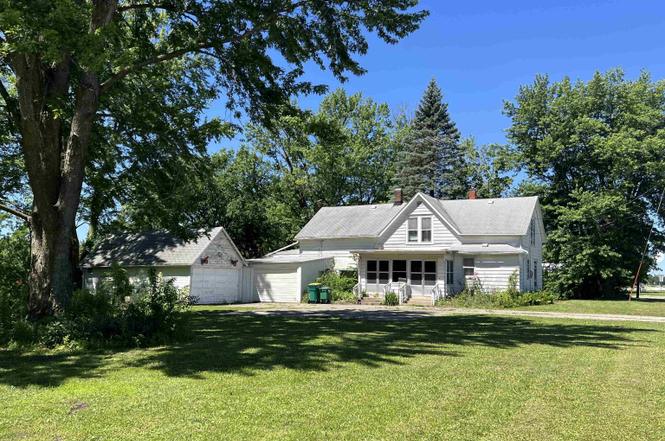
Listing remarks
Five bedroom on two acres in Agency. Large rooms throughout the home. Large dining room with a pass-through buffet from the dining room to kitchen area. Nice woodwork throughout the home in addition to some nice built-ins as well. Large main floor bathroom with enough room for a washer and dryer. Two of the bedrooms are located on the main floor with three nice sized bedrooms upstairs. There is an "open area" on the second floor that could be a space for a second bathroom. Plenty of parking and even an "outdoor kitchen/brick oven" around back. The home is being sold "as-is", but could be a great opportunity for someone willing to put in the work and effort into
Key facts
- Brick oven
- Pass-through buffet
- Two acres
Tags
Property features AI
Finance
- Financial info: Annual tax amount reported
Exterior
- Parking: Detached garage (1 car); Concrete and paved parking
- Utilities: Public water service; Public sewer service
- Home design: Two-level residential property; Unimproved land designation
- Construction: Metal siding construction
- Exterior features: 2.22-acre lot; Public water; Public sewer
Interior
- Bathrooms: One full bathroom
- Heating & cooling: Forced air heating; Central air conditioning
- Interior features: Basement present
Neighborhood map
What this means for you Summary
Snapshot
- This is a 3-bed/1.0-bath single-family listed at $119k.
Deal economics
- At list price, monthly cash flow is $161 ($2k/yr) — positive.
- The deal already cash-flows at list — no discount required.
- Meets the 1% rule at list price ($1k rent vs $119k).
Location & tenants
- Location reads 68/100 on livability (#439 in IA) — a middle-class / working-renter tenant base. Strengths: cost of living A+, housing A+; Watch: health & safety C-, employment D+, schools F.
- Cardinal Community School District (rural): math 54% / reading 58% proficiency, ranked #262 of 289 in IA (top 91%) — acceptable for families but not a draw, mixed tenant base, ~2y average lease.
- Market conditions: 4 active listings in the ZIP; 44 units permitted in Wapello County in 2024 (0 in 5+ unit buildings).
Forward outlook
- In year one you build about $8k of equity ($823 loan paydown + $7k appreciation (6.0% local appreciation)).
- Wapello County population projected at +5% by 2050 — modest demand growth; plan on rents tracking national, not racing it.
- At projected returns (6.0% appreciation + 3.0% rent growth), your $33k cash investment doubles in ~4 years — after that, you're playing with house money.
- By year 5, paydown + projected appreciation supports a ~$35k cash-out refi (75% LTV) — recoverable capital for the next deal without selling this one.
Negotiation context
- Only 3 days on market — expect competitive offers; lowballing is unlikely to land.
Risks & watch-outs
- Watch-outs: built in 1888 — expect roof / HVAC / electrical / plumbing capex.
Questions for the listing agent
- Built in 1888 — when were the roof, HVAC, electrical panel, plumbing, and water heater last replaced?
- Is there a deadline driving the sale (1031 exchange, divorce, estate, relocation)? That informs how much negotiation room exists.
- Schools are F-rated, which usually means shorter tenancies and higher turnover. Who's the typical renter profile here, and what's been the actual vacancy rate?
- What's the average days-on-market for RENTAL listings here right now (not sales)? A rising rental-DOM trend means longer vacancies and softer asking-rent achievability than the comps imply.
- What's the recent tenant-quality profile in this submarket — average credit score on applications, eviction rate, late-payment / NSF rate, and stable-employment percentage? A property-management company in the area should have these aggregated.
- How much new for-sale + rental construction is in the pipeline within 1–3 miles? Heavy new supply typically softens prices + rents 12–24 months out; constrained supply supports both.
Investment metrics
- 1% rule
- 1.07% ✓
- Cap rate
- 7.92%
- Cash-on-cash
- 5.80%
- DSCR
- 1.26
- GRM
- 7.8
CMA / ARV
- ARV (on-the-fly)
- $167,110
- Comps found
- 3
Show comp detail 3 sales within ~0.75 mi
| Address | Dist | Beds/Ba | Sqft | Sold | Price | $/sf | Match |
|---|---|---|---|---|---|---|---|
| 551 N Hazel St | 0.51mi | 3/2.0 | 1,701 (-14%) | 3mo | $195,000 | $115 | 48 |
| 339 Mahaska St | 0.65mi | 4/2.0 (+1) | 2,036 (+4%) | 9mo | $140,000 | $69 | 47 |
| 301 E Main St | 0.56mi | 4/1.5 (+1) | 2,209 (+12%) | 13mo | $187,526 | $85 | 35 |
Match score weights: distance 35% · size 25% · config 20% · recency 20%. Top-matched comps best support the ARV.
Projected returns pro-forma
5.95% appreciation · 3.0% rent growth · sell at horizon
- IRR
- 20.0%
- Equity multiple
- 2.33×
- Total profit
- $44,260
- Equity at exit
- $74,397
- IRR
- 19.3%
- Equity multiple
- 4.67×
- Total profit
- $122,319
- Equity at exit
- $134,561
Cash invested: $33,320 (down + closing). Projections, not guarantees.
Landlord ↔ Tenant lean methodology
- Overall (STATE)
- 83 Strongly Landlord-Friendly
- State Iowa
- 83 Strongly Landlord-Friendly · R+6
- County
- — inherits STATE
- City
- — inherits STATE
ZIP-level market 52530
- Home prices YoY
- 3.7%
- Active inventory
- 4
- Price-to-rent
- 7.8×
Monthly cashflow live
- Estimated rent
- $1,270 medium interval (Pro) →
- Mortgage (P&I)
- −$624
- Tax from tax record
- −$168 /mo · $2,022/yr
- Insurance
- −$50
- HOA
- −$0
- Vacancy / Maint / Mgmt
- −$267
- Net cashflow
- $161
Break-even live
UW: 25.0% down · 7.5% · 30yr · 1.5% tax · 5.0% vac · 8.0% maint · 8.0% mgmt
Financing live
Cash to close
- Down payment
- $29,750
- Closing costs
- $3,570
- Reserves months
- —
- Total cash needed
- —
Loan-product check · same deal, 3 products live
Conventional
25% down · 7.5% · 30yr
- Down + closing
- —
- Monthly P&I
- —
- Monthly cashflow
- —
- DSCR
- —
- Eligible?
- —
Personal DTI + credit; lowest rate.
DSCR
20% down · 8.5% · 30yr
- Down + closing
- —
- Monthly P&I
- —
- Monthly cashflow
- —
- DSCR
- —
- Eligible?
- —
No personal income docs; deal must DSCR.
Hard money
10% down · 12.0% · 12mo
- Down + closing
- —
- Monthly P&I
- —
- Monthly cashflow
- —
- DSCR
- —
- Eligible?
- —
Short-term bridge; refi at stabilization.
Listing history 4 events
-
2026-06-18days on market $119,000 Active 3 DOM
-
2026-06-17days on market $119,000 Active 2 DOM
-
2026-06-16remarks 669-char remark
-
2026-06-16$119,000 Active 1 DOM
ⓘ Source: listings_history table (triggers on properties + properties_extension) + one-shot
backfill from property_details.listing_events for pre-trigger history.
Tax reassessment forecast IA · Partial reset (capped growth)
- Current annual tax
- $2,022 · $168/mo
- Projected year-2 tax
- $2,022 · $168/mo
- Expected delta
- $0/yr ($0/mo · 0.0%)
ⓘ Screening estimate from a state-policy table — verify with the county assessor before closing.
Climate risk First Street
- Flood 1/10 Low FEMA zone X (unshaded) · 0% chance over 30 yrs
- Wildfire 4/10 Moderate
- Heat 3/10 Moderate 7 d/yr ≥106°F today · 15 d/yr by 30 yrs out
- Wind 2/10 Low
- Air quality 2/10 Low 1 unhealthy d/yr today · 2 by 30 yrs out
Nearby sold comps map
Loading sold comps map…
Walkable amenities ~0.75 mi
Loading nearby amenities…
Taxation est. · year 1
- Rental income
- $15,238
- − Mortgage interest
- −$6,666
- − Property taxes
- −$2,022
- − Insurance
- −$595
- − Repairs & maintenance
- −$1,219
- − Management
- −$1,219
- − Depreciation
- −$3,462
- Taxable income
- $55
- Est. tax owed @ 24.0%
- −$13
- After-tax cash flow
- $1,919/yr
For passive investors: Depreciation is non-cash, so a rental often shows a tax loss while cash-flowing — sheltering income. Rental losses are passive: they offset passive income freely, and up to $25,000/yr can offset ordinary (W-2) income if you actively participate and your MAGI is under $100k (phasing out to $0 by $150k); unused losses carry forward. On sale, claimed depreciation is recaptured at up to 25%, and gains may owe capital-gains tax (a 1031 exchange can defer both). Figures are a year-1 estimate at your 24.0% rate — not tax advice; consult a CPA.
Schools (NCES district)
- District
- Cardinal Community School District
- NCES district ID
- 1906240
- Math proficiency
- 54% ▼ -2.00%
- Reading proficiency
- 58% ▼ -3.00%
- Median HH income
- $45,438
- Composite
- 47.32/100
- National rank
- #2298
- State rank
- #262 of 289 in IA
Livability — Agency
- Score
- 68/100
- State rank
- #439
- US rank
- #9620
Category grades
Schools grade is shown separately in the Schools card above.
Census & demographics
- Census place
- Agency, IA
- Population (ZIP)
- 939
Population outlook (Wapello County) Hauer SSP2
- Today (2025)
- 35,472 people
- By 2030
- 35,563 · +0.3%
- By 2040
- 36,083 · +1.7%
- By 2050
- 37,287 · +5.1%
- By 2075
- 43,898 · +23.8%
- By 2100
- 52,973 · +49.3%
Race, ethnicity, and origin ACS 2023
- Neighborhood character
- Predominantly White (97%)
- Race & ethnicity
- White 97% Two or more races 2%
- Common ancestry
- English 14% Italian 4% Lithuanian 2%
- Foreign-born
- 0%
- Languages at home
- 99% English-only · Spanish 1%
Political lean MEDSL · Wapello
- 2024 margin
- Solid R (+31.4) · D 33.6% · R 65.0% · Other 1.4%
- 2008→2024 swing
- -45.0pp toward R · 2008: 13.5pp · 2024: -31.4pp
- All cycles
- 2024: R+31.4 2020: R+23.6 2016: R+20.8 2012: D+11.8 2008: D+13.5
Not yet ingested
- Civics
- —
Market trends
- HPI YoY
- ▲ 5.95%
- Current HPI
- 164.8727
- Rent YoY
- —
- Metro
- —
- State GDP YoY
- ▲ 2.48%
- F500 in state
- 4
Industry mix (Fortune 500 HQ in IA)
| Industry | F500 HQs | Revenue |
|---|---|---|
| Financial Services | 1 | $16B |
|
||
| Retail / Convenience | 1 | $15B |
|
||
Price history
1 event — show timeline
- 2026-06-15 Listed $119,000 IAR
Property tax history
+14.5%/yrLatest (2025): $2,022 · +5.9% YoY. Source: county tax records.
Cash-flow waterfall
monthlySold comps — $/sqft
last 12 mo · ≤1 miLoading sold comps…