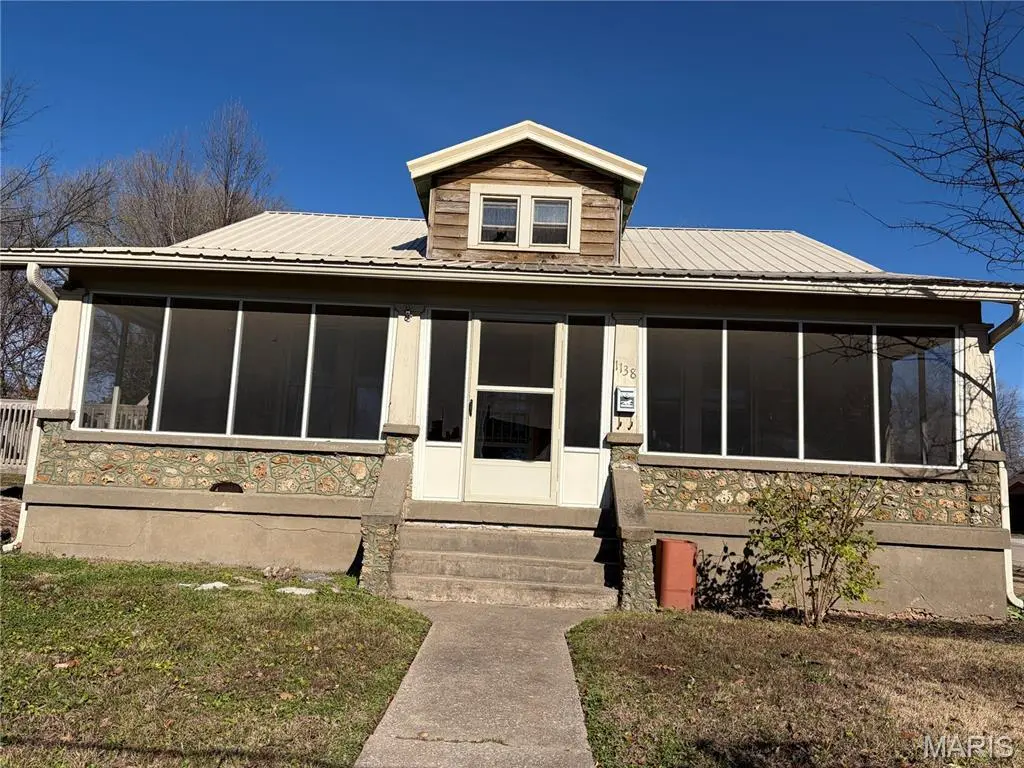
1138 Woodland Dr · Jackson, MO
Flood risk 1/10 · Minimal
- FEMA flood zone
- X (unshaded)
- Chance of flooding over 30 yrs
- 0.0%
- Est. flood insurance / yr
- $473 – $860
Fire risk 3/10 · Minor
- Est. fire insurance / yr
- $1,054 – $1,958
Heat risk 5/10 · Moderate
- Hot days now (above 109°F)
- 7 days/yr
- Hot days in 30 yrs
- 21 days/yr
Wind risk 2/10 · Minimal
- Chance of severe wind over 30 yrs
- 3.0%
Air-quality risk 2/10 · Minimal
- Unhealthy air days now
- 0 days/yr
- Unhealthy air days in 30 yrs
- 1 days/yr
Risk factors via First Street. Map © Google.
Why this score? — see what drove the B+ grade
The composite is a weighted blend of 9 inputs, each scored 0–100. Each bar is that input's sub-score; the figure is the points it added to the 100-point composite (weight × sub-score).
- Cash flow +30.0/30.0
- ARV discount +15.0/15.0
- DSCR +10.0/10.0
- 1% rule +8.6/10.0
- Schools +4.0/10.0
- Rent growth +3.6/5.0
- Livability +3.5/5.0
- Condition / age +2.5/5.0
- Appreciation +0.0/10.0
$120,000
🖨 Deal sheet (PDF) 📄 Offer letter ✓ Due diligence
Listing remarks MLS
Fixer-upper alert with HUGE potential! This older home sits on an oversized lot and offers a full basement, garage, and tons of room to transform. Finish the work that’s been started and create the home you’ve been dreaming of, or capitalize on a fantastic investment opportunity. The layout, the lot size, and the location make this a rare find for anyone ready to roll up their sleeves and add value.
Key facts
- Garage
- Full basement
- Oversized lot
Tags
Neighborhood map
What this means for you Summary
Snapshot
- This is a 4-bed/1.0-bath single-family listed at $120k.
Deal economics
- At list price, monthly cash flow is $539 ($6k/yr) — positive.
- The deal already cash-flows at list — no discount required.
- Meets the 1% rule at list price ($2k rent vs $120k).
- Recommended offer: $106k (12.0% below list) — sets the bar for market timing.
- Cap rate 11.7% vs local median 3.4% in Jackson — top-decile yield for the area; either an underpriced asset or a hidden risk that comps aren't pricing in. Stress-test before assuming the spread holds.
Location & tenants
- Location reads 69/100 on livability (#160 in MO) — a middle-class / working-renter tenant base. Strengths: crime A+, cost of living A+, housing A+; Watch: amenities F, commute F, health & safety F.
- Jackson R-II (suburban): math 41% / reading 51% proficiency, ranked #73 of 324 in MO (top 22%) — families likely to look elsewhere, expect single-tenant / working-renter base with shorter leases.
- Zoned schools: Jackson Sr. High (math 45% / reading 62%, grade C-, #83 of 521 statewide, top 16%, 1,764 students, 30% FRL) — zoned schools at 30% FRL track the district average.
- Market conditions: Rents rising fast (+4.5%/yr); 177 active listings in the ZIP; solid renter incomes; 81 units permitted in Cape Girardeau County in 2024 (0 in 5+ unit buildings).
Forward outlook
- Local home prices are declining (-3.0%/yr); year-one equity from $830 of loan paydown is wiped out by about $4k of value loss. Plan a longer hold.
- Cape Girardeau County population projected at +17% by 2050 — long-run rental-demand tailwind backs the buy-and-hold thesis.
- At projected returns (-3.0% appreciation + 4.5% rent growth), your $34k cash investment doubles in ~6 years — after that, you're playing with house money.
Negotiation context
- It's been on market 178 days — a 12% lower offer ($106k) is reasonable based on typical stale-listing flexibility.
- 3 sale attempts since 2y ago; this cycle's ask has dropped $10k (8%) from the opening price — seller is motivated, your offer sets the floor, not the list.
Risks & watch-outs
- Watch-outs: built in 1935 — expect roof / HVAC / electrical / plumbing capex.
- Climate carrying-cost: extreme-heat days projected 7→21/yr by 2055 (HVAC capex compounding) — expect insurance premiums to compound above CPI over the hold.
Questions for the listing agent
- It's been on market 178 days. Have you received any prior offers? Is the seller open to a 12% concession, seller financing, or rate buy-down credit?
- Built in 1935 — when were the roof, HVAC, electrical panel, plumbing, and water heater last replaced?
- Why hasn't it sold? Are there any deal-killer items the seller is aware of (foundation, flood, title, zoning, code violations)?
- Is there a deadline driving the sale (1031 exchange, divorce, estate, relocation)? That informs how much negotiation room exists.
- What's the average days-on-market for RENTAL listings here right now (not sales)? A rising rental-DOM trend means longer vacancies and softer asking-rent achievability than the comps imply.
- What's the recent tenant-quality profile in this submarket — average credit score on applications, eviction rate, late-payment / NSF rate, and stable-employment percentage? A property-management company in the area should have these aggregated.
- How much new for-sale + rental construction is in the pipeline within 1–3 miles? Heavy new supply typically softens prices + rents 12–24 months out; constrained supply supports both.
Investment metrics
- 1% rule
- 1.36% ✓
- Cap rate
- 11.69%
- Cash-on-cash
- 19.27%
- DSCR
- 1.86
- GRM
- 6.1
CMA / ARV
- ARV (median comp)
- $186,063
- List price
- $120,000
- Delta
- -35.51%
- Verdict
- UNDERPRICED
- Comps
- 20 within 1.0 mi
Show comp detail 12 sales within ~0.75 mi
| Address | Dist | Beds/Ba | Sqft | Sold | Price | $/sf | Match |
|---|---|---|---|---|---|---|---|
| 111 Tracy St | 0.20mi | 3/1.0 (-1) | 1,296 (-0%) | 4mo | $189,900 | $147 | 82 |
| 1412 Woodland Dr | 0.17mi | 3/2.0 (-1) | 1,213 (-7%) | 9mo | $194,900 | $161 | 64 |
| 308 N Ohio St | 0.57mi | 3/2.0 (-1) | 1,300 (+0%) | 0mo | $219,000 | $168 | 64 |
| 1016 E Adams St | 0.18mi | 3/1.0 (-1) | 1,428 (+10%) | 8mo | $173,500 | $121 | 64 |
| 503 Nellie St | 0.46mi | 4/1.5 | 1,226 (-6%) | 15mo | $164,900 | $135 | 55 |
| 915 Greensferry Rd | 0.71mi | 3/2.0 (-1) | 1,309 (+1%) | 11mo | $272,900 | $208 | 47 |
| 550 Sara St | 0.73mi | 3/2.0 (-1) | 1,204 (-7%) | 1mo | $242,000 | $201 | 44 |
| 303 E Washington St | 0.57mi | 3/2.0 (-1) | 1,400 (+8%) | 12mo | $264,000 | $189 | 42 |
| 1072 Hannah St | 0.66mi | 3/2.0 (-1) | 1,232 (-5%) | 12mo | $230,000 | $187 | 41 |
| 780 Abbie Ct | 0.49mi | 3/2.0 (-1) | 1,137 (-12%) | 13mo | $224,900 | $198 | 37 |
| 911 Highland Dr | 0.72mi | 3/1.5 (-1) | 1,438 (+11%) | 14mo | $179,900 | $125 | 30 |
| 413 Byrd Ct | 0.75mi | 3/2.0 (-1) | 1,450 (+12%) | 8mo | $324,900 | $224 | 30 |
Match score weights: distance 35% · size 25% · config 20% · recency 20%. Top-matched comps best support the ARV.
Projected returns pro-forma
-3.0% appreciation · 4.49% rent growth · sell at horizon
- IRR
- 12.8%
- Equity multiple
- 1.52×
- Total profit
- $17,368
- Equity at exit
- $17,892
- IRR
- 22.7%
- Equity multiple
- 3.08×
- Total profit
- $69,747
- Equity at exit
- $10,375
Cash invested: $33,600 (down + closing). Projections, not guarantees.
Landlord ↔ Tenant lean methodology
- Overall (STATE)
- 81 Strongly Landlord-Friendly
- State Missouri
- 81 Strongly Landlord-Friendly · R+10
- County
- — inherits STATE
- City
- — inherits STATE
ZIP-level market 63755
- Rents YoY
- 4.5%
- Active inventory
- 177
- Price-to-rent
- 6.1×
Monthly cashflow live
- Estimated rent
- $1,629 medium interval (Pro) →
- Mortgage (P&I)
- −$629
- Tax from tax record
- −$68 /mo · $817/yr
- Insurance
- −$50
- HOA
- −$0
- Vacancy / Maint / Mgmt
- −$342
- Net cashflow
- $539
Break-even live
Sensitivity live
| Price | -10% $607 | -5% $573 | +0% $539 | +5% $506 | +10% $472 |
|---|---|---|---|---|---|
| Rent | -10% $411 | -5% $475 | +0% $539 | +5% $604 | +10% $668 |
| Rate | -1.0pp $600 | -0.5pp $570 | base $539 | +0.5pp $508 | +1.0pp $477 |
UW: 25.0% down · 7.5% · 30yr · 1.5% tax · 5.0% vac · 8.0% maint · 8.0% mgmt
Financing live
Cash to close
- Down payment
- $30,000
- Closing costs
- $3,600
- Reserves months
- —
- Total cash needed
- —
Loan-product check · same deal, 3 products live
Conventional
25% down · 7.5% · 30yr
- Down + closing
- —
- Monthly P&I
- —
- Monthly cashflow
- —
- DSCR
- —
- Eligible?
- —
Personal DTI + credit; lowest rate.
DSCR
20% down · 8.5% · 30yr
- Down + closing
- —
- Monthly P&I
- —
- Monthly cashflow
- —
- DSCR
- —
- Eligible?
- —
No personal income docs; deal must DSCR.
Hard money
10% down · 12.0% · 12mo
- Down + closing
- —
- Monthly P&I
- —
- Monthly cashflow
- —
- DSCR
- —
- Eligible?
- —
Short-term bridge; refi at stabilization.
Listing history 10 events
-
2026-05-31days on market $120,000 Active 178 DOM
-
2026-05-30days on market $120,000 Active 177 DOM
-
2026-01-09price $120,000 414-char remark
Show marketing remark (414 chars)
Fixer-upper alert with HUGE potential! This older home sits on an oversized lot and offers a full basement, garage, and tons of room to transform. Finish the work that’s been started and create the home you’ve been dreaming of, or capitalize on a fantastic investment opportunity. The layout, the lot size, and the location make this a rare find for anyone ready to roll up their sleeves and add value.
-
2025-12-04$130,000 Active 414-char remark
Show marketing remark (414 chars)
Fixer-upper alert with HUGE potential! This older home sits on an oversized lot and offers a full basement, garage, and tons of room to transform. Finish the work that’s been started and create the home you’ve been dreaming of, or capitalize on a fantastic investment opportunity. The layout, the lot size, and the location make this a rare find for anyone ready to roll up their sleeves and add value.
-
2024-09-21historical
-
2024-09-06status Active
-
2024-09-06price $99,000
-
2024-07-23status Pending
-
2024-07-15price $110,000
-
2024-06-24$120,000 Active
ⓘ Source: listings_history table (triggers on properties + properties_extension) + one-shot
backfill from property_details.listing_events for pre-trigger history.
Tax reassessment forecast MO · Resets to sale price
- Current annual tax
- $817 · $68/mo
- Projected year-2 tax
- $1,164 · $97/mo
- Expected delta
- +$347/yr (+$29/mo · 42.5%)
ⓘ Screening estimate from a state-policy table — verify with the county assessor before closing.
Climate risk First Street
- Flood 1/10 Low FEMA zone X (unshaded) · 0% chance over 30 yrs
- Wildfire 3/10 Moderate
- Heat 5/10 Major 7 d/yr ≥109°F today · 21 d/yr by 30 yrs out
- Wind 2/10 Low 3% chance of damaging wind over 30 yrs
- Air quality 2/10 Low 0 unhealthy d/yr today · 1 by 30 yrs out
Nearby sold comps map
Loading sold comps map…
Walkable amenities ~0.75 mi
Loading nearby amenities…
Taxation est. · year 1
- Rental income
- $19,547
- − Mortgage interest
- −$6,722
- − Property taxes
- −$817
- − Insurance
- −$600
- − Repairs & maintenance
- −$1,564
- − Management
- −$1,564
- − Depreciation
- −$3,491
- Taxable income
- $4,790
- Est. tax owed @ 24.0%
- −$1,150
- After-tax cash flow
- $5,324/yr
For passive investors: Depreciation is non-cash, so a rental often shows a tax loss while cash-flowing — sheltering income. Rental losses are passive: they offset passive income freely, and up to $25,000/yr can offset ordinary (W-2) income if you actively participate and your MAGI is under $100k (phasing out to $0 by $150k); unused losses carry forward. On sale, claimed depreciation is recaptured at up to 25%, and gains may owe capital-gains tax (a 1031 exchange can defer both). Figures are a year-1 estimate at your 24.0% rate — not tax advice; consult a CPA.
Schools (NCES district)
- District
- Jackson R-II
- NCES district ID
- 2915600
- Math proficiency
- 41% ▼ -6.00%
- Reading proficiency
- 51% ▬ 0.00%
- Median HH income
- $52,935
- Composite
- 39.72/100
- National rank
- #3898
- State rank
- #73 of 324 in MO
Livability — Jackson
- Score
- 69/100
- State rank
- #160
- US rank
- #8843
Category grades
Schools grade is shown separately in the Schools card above.
Census & demographics
- Census place
- Jackson, MO
- County
- Cape Girardeau County · 75,175 people
- City population
- 27,629
- Metro
- Cape Girardeau, MO-IL
- Population (ZIP)
- 27,629
- Household income
- $78,750
- Rent vs Own
- Severe rent burden
- 354.0
Population outlook (Cape Girardeau County) Hauer SSP2
- Today (2025)
- 84,807 people
- By 2030
- 88,016 · +3.8%
- By 2040
- 93,914 · +10.7%
- By 2050
- 99,541 · +17.4%
- By 2075
- 114,527 · +35.0%
- By 2100
- 121,718 · +43.5%
Race, ethnicity, and origin ACS 2023
- Neighborhood character
- Predominantly White (92%)
- Race & ethnicity
- White 92% Two or more races 4% Hispanic / Latino 3% Black 2%
- Common ancestry
- Slovak 2% Italian 2% Lithuanian 1%
- Foreign-born
- 1% · Canada
- Languages at home
- 98% English-only · Spanish 1%
Political lean MEDSL · Cape Girardeau
- 2024 margin
- Solid R (+46.5) · D 26.2% · R 72.7% · Other 1.1%
- 2008→2024 swing
- -12.9pp toward R · 2008: -33.6pp · 2024: -46.5pp
- All cycles
- 2024: R+46.5 2020: R+45.0 2016: R+50.1 2012: R+43.8 2008: R+33.6
Not yet ingested
- Civics
- —
Market trends
- HPI YoY
- ▼ -120.83%
- Current HPI
- 179.1136
- Rent YoY
- ▲ 4.49%
- Metro
- Cape Girardeau, MO-IL
- State GDP YoY
- ▲ 1.84%
- F500 in state
- 20
Industry mix (Fortune 500 HQ in MO)
| Industry | F500 HQs | Revenue |
|---|---|---|
| Healthcare | 1 | $163B |
|
||
| Insurance | 1 | $21B |
|
||
| Industrial Technology | 1 | $17B |
|
||
| Retail | 1 | $16B |
|
||
| Industrial Distribution | 1 | $10B |
|
||
| Utilities | 1 | $9B |
|
||
Price history
+0.0% since first listed8 events — show timeline
- 2026-01-09 Price Changed $120,000 MARIS as Distributed by MLS Grid
- 2025-12-04 Listed $130,000 MARIS as Distributed by MLS Grid
- 2024-09-21 Delisted — MARIS as Distributed by MLS Grid
- 2024-09-06 Relisted — MARIS as Distributed by MLS Grid
- 2024-09-06 Price Changed $99,000 MARIS as Distributed by MLS Grid
- 2024-07-23 Pending — MARIS as Distributed by MLS Grid
- 2024-07-15 Price Changed $110,000 MARIS as Distributed by MLS Grid
- 2024-06-24 Listed $120,000 MARIS as Distributed by MLS Grid
Property tax history
+1.2%/yrLatest (2025): $817 · +5.1% YoY. Source: county tax records.
Cash-flow waterfall
monthlySold comps — $/sqft
last 12 mo · ≤1 miLoading sold comps…