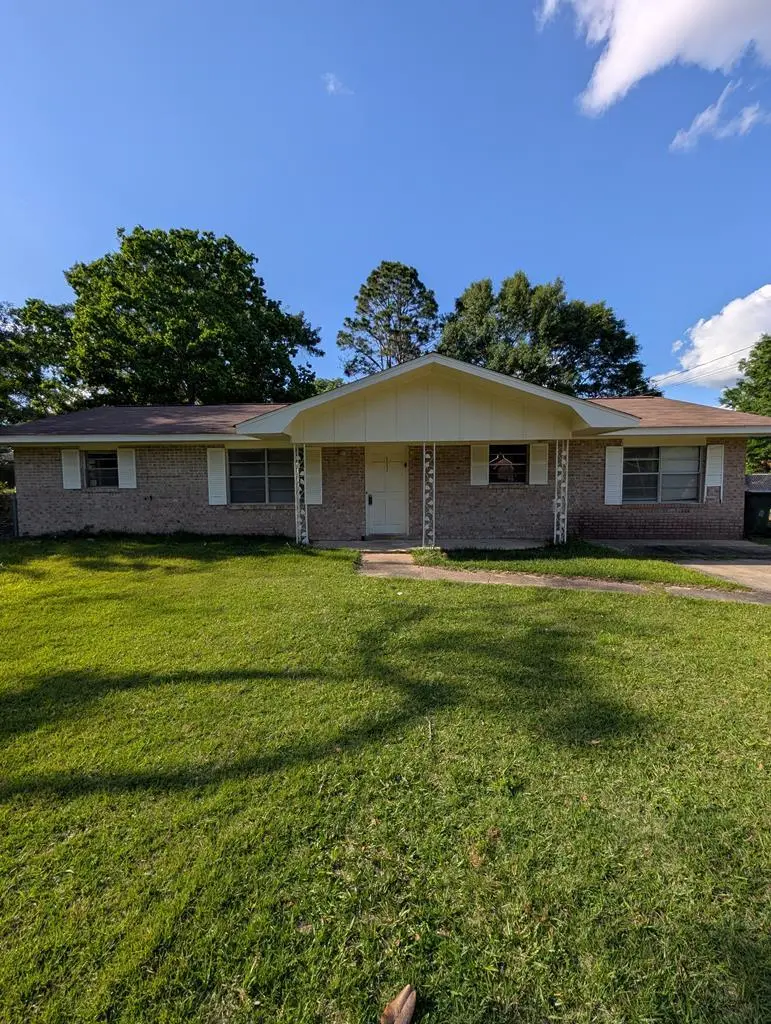
603 Falcon Dr · Dothan, AL
Flood risk 1/10 · Minimal
- FEMA flood zone
- X (unshaded)
- Chance of flooding over 30 yrs
- 0.0%
- Est. flood insurance / yr
- $507 – $1,088
Fire risk 3/10 · Minor
- Est. fire insurance / yr
- $916 – $1,700
Heat risk 8/10 · Major
- Hot days now (above 107°F)
- 7 days/yr
- Hot days in 30 yrs
- 19 days/yr
Wind risk 8/10 · Major
- Chance of severe wind over 30 yrs
- 99.0%
Air-quality risk 4/10 · Minor
- Unhealthy air days now
- 5 days/yr
- Unhealthy air days in 30 yrs
- 6 days/yr
Risk factors via First Street. Map © Google.
Why this score? — see what drove the C- grade
The composite is a weighted blend of 9 inputs, each scored 0–100. Each bar is that input's sub-score; the figure is the points it added to the 100-point composite (weight × sub-score).
- Cash flow +20.0/30.0
- ARV discount +11.9/15.0
- DSCR +6.3/10.0
- 1% rule +5.3/10.0
- Livability +3.2/5.0
- Rent growth +2.5/5.0
- Schools +2.5/10.0
- Condition / age +2.2/5.0
- Appreciation +0.0/10.0
$115,000
🖨 Deal sheet (PDF) 📄 Offer letter ✓ Due diligence
Listing remarks
Come take a look at this quaint full brick home conveniently located just blocks away from Southeast Health and ACOM. . Spacious yard fully fenced in the back with a great covered patio to enjoy your morning coffee!! Breakfast bar in the kitchen overlooking into the spacious dining room. This home is just waiting for you and your perfect touch. . The ROOF and HVAC have recently been updated .
Key facts
- Spacious yard
- Covered patio
- Updated roof
Tags
Property features AI
Exterior
- Parking: No garage
- Utilities: Public water; Public sewer
- Home design: Single family residence; One level
- Construction: Brick construction
- Exterior features: Covered patio/porch; Storage structure; Waterfront property
Interior
- Kitchen: Range; Range hood; Refrigerator
- Flooring: Carpet; Tile; Laminate
- Bathrooms: 1 full bathroom
- Interior features: Eat-in kitchen; Aluminum frame windows
- Laundry & utility: Laundry located inside; Electric water heater
Neighborhood map
What this means for you Summary
Snapshot
- This is a 3-bed/1.0-bath single-family listed at $115k. Condition is rated fair.
Deal economics
- At list price, monthly cash flow is $141 ($2k/yr) — positive.
- The deal already cash-flows at list — no discount required.
- Meets the 1% rule at list price ($1k rent vs $115k).
- Recommended offer: $113k (1.5% below list) — sets the bar for market timing.
- Cap rate 7.8% vs local median 4.4% in Dothan — top-decile yield for the area; either an underpriced asset or a hidden risk that comps aren't pricing in. Stress-test before assuming the spread holds.
Location & tenants
- Location reads 64/100 on livability (#146 in AL) — a middle-class / working-renter tenant base. Strengths: cost of living A+, housing A+, health & safety A+; Watch: schools D+, employment D, crime F.
- Dothan City (urban): math 19% / reading 39% proficiency, ranked #73 of 129 in AL (top 57%) — low school quality limits family demand, transient renter base, plan for 1-2y turnover.
- Market conditions: 410 active listings in the ZIP; 10 comparable units currently listed for rent nearby; rentals lingering (median 45d on market — plan ~5-8 weeks vacancy on turnover, expect pricing pressure); 100% of comp listings sitting > 30 days — soft ceiling on asking rent; 463 units permitted in Houston County in 2024 (96 in 5+ unit buildings).
Forward outlook
- Local home prices are declining (-3.0%/yr); year-one equity from $795 of loan paydown is wiped out by about $3k of value loss. Plan a longer hold.
- Houston County population projected at +7% by 2050 — modest demand growth; plan on rents tracking national, not racing it.
Negotiation context
- It's been on market 21 days — a 2% lower offer ($113k) is reasonable based on typical stale-listing flexibility.
- 2 sale attempts with the ask held roughly flat each time — persistent listings suggest the price (not the market) is what's stuck; bring a comps-based counter.
Risks & watch-outs
- Climate carrying-cost: severe wind risk, 99% chance of damaging wind over 30y; extreme-heat days projected 7→19/yr by 2055 (HVAC capex compounding) — expect insurance premiums to compound above CPI over the hold.
Questions for the listing agent
- Have any recent inspections been done? Can we get a copy of the seller's disclosures and any deferred-maintenance estimates?
- Built in 1970 — when were the roof, HVAC, electrical panel, plumbing, and water heater last replaced?
- Is there a deadline driving the sale (1031 exchange, divorce, estate, relocation)? That informs how much negotiation room exists.
- Schools are D-rated, which usually means shorter tenancies and higher turnover. Who's the typical renter profile here, and what's been the actual vacancy rate?
- Crime grade is F in this area — have there been break-ins, vandalism, or insurance claims at this property in the last 3 years? What carrier currently insures it and at what premium?
- What's the average days-on-market for RENTAL listings here right now (not sales)? A rising rental-DOM trend means longer vacancies and softer asking-rent achievability than the comps imply.
- What's the recent tenant-quality profile in this submarket — average credit score on applications, eviction rate, late-payment / NSF rate, and stable-employment percentage? A property-management company in the area should have these aggregated.
- How much new for-sale + rental construction is in the pipeline within 1–3 miles? Heavy new supply typically softens prices + rents 12–24 months out; constrained supply supports both.
Investment metrics
- 1% rule
- 1.03% ✓
- Cap rate
- 7.76%
- Cash-on-cash
- 5.25%
- DSCR
- 1.23
- GRM
- 8.1
CMA / ARV
- ARV (median comp)
- $127,518
- List price
- $115,000
- Delta
- -9.82%
- Verdict
- FAIR
- Comps
- 20 within 1.0 mi
Show comp detail 12 sales within ~0.75 mi
| Address | Dist | Beds/Ba | Sqft | Sold | Price | $/sf | Match |
|---|---|---|---|---|---|---|---|
| 1003 Torino Dr | 0.10mi | 3/2.0 | 1,420 (-0%) | 8mo | $127,000 | $89 | 85 |
| 610 Pinto Dr | 0.30mi | 3/2.0 | 1,381 (-3%) | 2mo | $143,000 | $104 | 75 |
| 903 Dixie Dr | 0.50mi | 3/2.0 | 1,418 (-0%) | 4mo | $195,000 | $138 | 69 |
| 1603 Squire Ct | 0.07mi | 4/2.0 (+1) | 1,566 (+10%) | 3mo | $170,000 | $109 | 68 |
| 305 Cyclone Cir | 0.52mi | 3/2.0 | 1,404 (-1%) | 2mo | $154,500 | $110 | 68 |
| 209 Pearl St | 0.63mi | 3/2.0 | 1,432 (+1%) | 0mo | $500,000 | $349 | 65 |
| 509 Lagrand Dr | 0.14mi | 3/2.0 | 1,215 (-15%) | 10mo | $110,000 | $91 | 57 |
| 138 Radford Cir | 0.45mi | 3/2.0 | 1,621 (+14%) | 3mo | $179,000 | $110 | 49 |
| 166 Radford Cir | 0.49mi | 3/2.0 | 1,240 (-13%) | 4mo | $145,000 | $117 | 49 |
| 332 Darlington Cir | 0.54mi | 3/2.0 | 1,227 (-14%) | 1mo | $170,000 | $139 | 47 |
| 142 Tree Crest Dr | 0.70mi | 3/2.0 | 1,261 (-11%) | 1mo | $179,000 | $142 | 44 |
| 1204 Judson St | 0.64mi | 3/2.0 | 1,216 (-14%) | 5mo | $132,000 | $109 | 37 |
Match score weights: distance 35% · size 25% · config 20% · recency 20%. Top-matched comps best support the ARV.
Projected returns pro-forma
-3.0% appreciation · 3.0% rent growth · sell at horizon
- IRR
- -8.1%
- Equity multiple
- 0.70×
- Total profit
- $-9,645
- Equity at exit
- $17,147
- IRR
- 1.4%
- Equity multiple
- 1.10×
- Total profit
- $3,226
- Equity at exit
- $9,943
Cash invested: $32,200 (down + closing). Projections, not guarantees.
Landlord ↔ Tenant lean methodology
- Overall (STATE)
- 90 Strongly Landlord-Friendly
- State Alabama
- 90 Strongly Landlord-Friendly · R+15
- County
- — inherits STATE
- City
- — inherits STATE
ZIP-level market 36301
- Home prices YoY
- -24.9%
- Active inventory
- 410
- Price-to-rent
- 8.1×
Monthly cashflow live
- Estimated rent
- $1,184 high interval (Pro) →
- Mortgage (P&I)
- −$603
- Tax est. 1.5%
- −$144 /mo · $1,725/yr
- Insurance
- −$48
- HOA
- −$0
- Vacancy / Maint / Mgmt
- −$249
- Net cashflow
- $141
Break-even live
Sensitivity live
| Price | -10% $220 | -5% $181 | +0% $141 | +5% $101 | +10% $61 |
|---|---|---|---|---|---|
| Rent | -10% $47 | -5% $94 | +0% $141 | +5% $188 | +10% $234 |
| Rate | -1.0pp $199 | -0.5pp $170 | base $141 | +0.5pp $111 | +1.0pp $81 |
UW: 25.0% down · 7.5% · 30yr · 1.5% tax · 5.0% vac · 8.0% maint · 8.0% mgmt
Financing live
Cash to close
- Down payment
- $28,750
- Closing costs
- $3,450
- Reserves months
- —
- Total cash needed
- —
Loan-product check · same deal, 3 products live
Conventional
25% down · 7.5% · 30yr
- Down + closing
- —
- Monthly P&I
- —
- Monthly cashflow
- —
- DSCR
- —
- Eligible?
- —
Personal DTI + credit; lowest rate.
DSCR
20% down · 8.5% · 30yr
- Down + closing
- —
- Monthly P&I
- —
- Monthly cashflow
- —
- DSCR
- —
- Eligible?
- —
No personal income docs; deal must DSCR.
Hard money
10% down · 12.0% · 12mo
- Down + closing
- —
- Monthly P&I
- —
- Monthly cashflow
- —
- DSCR
- —
- Eligible?
- —
Short-term bridge; refi at stabilization.
Rent comps 10 comps
| Address | Beds | Baths | Sqft | Rent | $/sqft | DOM | Units | Dist |
|---|---|---|---|---|---|---|---|---|
| 306 Mustang Dr Dothan, AL | 3.0 | 1.0 | 1301 | $1,050 | $0.81 | 44d | 1 | 0.21mi |
| 1581 E Selma St Aurora, AL | 3.0 | 1.5 | 1426 | $1,149 | $0.81 | 44d | 1 | 0.23mi |
| 1009 Jonathan St Dothan, AL | 3.0 | 1.5 | 1318 | $1,300 | $0.99 | 44d | 1 | 0.32mi |
| 1301 Alexander Dr Dothan, AL | 1.0–2.0 | 1.0–1.5 | 833 | $795 | $0.95 | 44d | 1 | 0.33mi |
| 1000 Fairlane Dr Dothan, AL | 3.0 | 2.0 | 1500 | $1,200 | $0.80 | 44d | 1 | 0.42mi |
| 131 Hedstrom Dr Greenwood, AL | 3.0 | 2.0 | 1526 | $1,400 | $0.92 | 44d | 1 | 0.43mi |
| 151 Radford Cir Dothan, AL | 2.0 | 1.5 | 1171 | $1,400 | $1.20 | 44d | 1 | 0.51mi |
| 806 S Ussery St Dothan, AL | 3.0 | 1.0 | 934 | $895 | $0.96 | 44d | 1 | 1.17mi |
| 105 St Lawrence Dr Dothan, AL | 2.0 | 2.0 | 1580 | $1,500 | $0.95 | 44d | 1 | 1.24mi |
| 2211 Shannondoah Dr Dothan, AL | 3.0 | 2.0 | 1409 | $1,450 | $1.03 | 44d | 1 | 1.49mi |
Listing history 7 events
-
2026-06-03days on market $115,000 Active 21 DOM
-
2026-06-02days on market $115,000 Active 20 DOM
-
2026-06-01days on market $115,000 Active 19 DOM
-
2026-05-31days on market $115,000 Active 18 DOM
-
2026-05-30days on market $115,000 Active 17 DOM
-
2026-05-14$115,000 Active 396-char remark
-
2026-05-13$115,000 Active 370-char remark
ⓘ Source: listings_history table (triggers on properties + properties_extension) + one-shot
backfill from property_details.listing_events for pre-trigger history.
Climate risk First Street
- Flood 1/10 Low FEMA zone X (unshaded) · 0% chance over 30 yrs
- Wildfire 3/10 Moderate
- Heat 8/10 Severe 7 d/yr ≥107°F today · 19 d/yr by 30 yrs out
- Wind 8/10 Severe 99% chance of damaging wind over 30 yrs
- Air quality 4/10 Moderate 5 unhealthy d/yr today · 6 by 30 yrs out
Nearby sold comps map
Loading sold comps map…
Walkable amenities ~0.75 mi
Loading nearby amenities…
Taxation est. · year 1
- Rental income
- $14,212
- − Mortgage interest
- −$6,442
- − Property taxes
- −$1,725
- − Insurance
- −$575
- − Repairs & maintenance
- −$1,137
- − Management
- −$1,137
- − Depreciation
- −$3,345
- Taxable loss
- −$149
- Est. tax savings @ 24.0%
- +$36
- After-tax cash flow
- $1,726/yr
For passive investors: Depreciation is non-cash, so a rental often shows a tax loss while cash-flowing — sheltering income. Rental losses are passive: they offset passive income freely, and up to $25,000/yr can offset ordinary (W-2) income if you actively participate and your MAGI is under $100k (phasing out to $0 by $150k); unused losses carry forward. On sale, claimed depreciation is recaptured at up to 25%, and gains may owe capital-gains tax (a 1031 exchange can defer both). Figures are a year-1 estimate at your 24.0% rate — not tax advice; consult a CPA.
Condition & rehab AI · 30 photos
This home is in fair condition with moderate repairs needed, particularly in the kitchen and bathrooms. Upgrading these areas will significantly increase its resale and rental value.
Repairs flagged
- Moderate kitchen cabinets — dated and in need of replacement
- Moderate kitchen countertops — dated and in need of replacement
- Moderate kitchen flooring — dated and in need of replacement
- Minor bathroom fixtures — basic and in need of updating
- Minor exterior paint — some discoloration
Value-add opportunities
- Resale update kitchen cabinets and countertops — modernizing the kitchen will attract more buyers
- Resale update bathroom fixtures — modernizing the bathroom will attract more buyers
- Resale paint interior walls — fresh paint will make the home more appealing
- Resale replace carpeted floors — new flooring will make the home more appealing
- Both trim and maintain landscaping — a well-maintained yard will increase curb appeal and attract more renters
Renovation cost estimate screening
| Repair item | Severity | Est. cost |
|---|---|---|
| kitchen cabinets · dated and in need of replacement | Moderate | $3,000–15,000 |
| kitchen countertops · dated and in need of replacement | Moderate | $3,000–15,000 |
| kitchen flooring · dated and in need of replacement | Moderate | $3,000–15,000 |
| bathroom fixtures · basic and in need of updating | Minor | $500–3,000 |
| exterior paint · some discoloration | Minor | $500–3,000 |
| Total estimated repair cost · 5 items | $10,000–51,000 |
Value-add ROI direction
- Resale update kitchen cabinets and countertops — modernizing the kitchen will attract more buyers ↑
- Resale update bathroom fixtures — modernizing the bathroom will attract more buyers ↑
- Resale paint interior walls — fresh paint will make the home more appealing ↑
- Resale replace carpeted floors — new flooring will make the home more appealing ↑
- Both trim and maintain landscaping — a well-maintained yard will increase curb appeal and attract more renters ↑
ⓘ Cost ranges are severity-bucket heuristics (US national rule-of-thumb). Get contractor quotes + a written scope before underwriting a rehab budget.
Schools (NCES district)
- District
- Dothan City
- NCES district ID
- 0101230
- Math proficiency
- 19% ▼ -23.00%
- Reading proficiency
- 39% ▼ -3.00%
- Median HH income
- $42,279
- Composite
- 24.56/100
- National rank
- #7640
- State rank
- #73 of 129 in AL
Livability — Dothan
- Score
- 64/100
- State rank
- #146
- US rank
- #13662
Category grades
Schools grade is shown separately in the Schools card above.
Census & demographics
- Census place
- Dothan, AL
- City population
- 47,783
- Population (ZIP)
- 38,627
Population outlook (Houston County) Hauer SSP2
- Today (2025)
- 110,280 people
- By 2030
- 112,668 · +2.2%
- By 2040
- 116,149 · +5.3%
- By 2050
- 117,805 · +6.8%
- By 2075
- 118,577 · +7.5%
- By 2100
- 110,940 · +0.6%
Race, ethnicity, and origin ACS 2023
- Neighborhood character
- Diverse neighborhood (Simpson 0.55)
- Race & ethnicity
- White 59% Black 31% Hispanic / Latino 5% Two or more races 5%
- Hispanic origin (detail)
- Mexican 3%
- Common ancestry
- Slovak 1% Italian 1% Lithuanian 1%
- Foreign-born
- 3% · Canada
- Languages at home
- 95% English-only · Spanish 4%
Political lean MEDSL · Houston
- 2024 margin
- Solid R (+47.8) · D 25.7% · R 73.5%
- 2008→2024 swing
- -7.0pp toward R · 2008: -40.8pp · 2024: -47.8pp
- All cycles
- 2024: R+47.8 2020: R+42.7 2016: R+47.6 2012: R+40.3 2008: R+40.8
Not yet ingested
- Civics
- —
Market trends
- HPI YoY
- ▼ -53.46%
- Current HPI
- 161.1212
- Rent YoY
- —
- Metro
- —
- State GDP YoY
- ▲ 2.94%
- F500 in state
- 4
Industry mix (Fortune 500 HQ in AL)
| Industry | F500 HQs | Revenue |
|---|---|---|
| Financial Services | 1 | $8B |
|
||
| Healthcare | 1 | $5B |
|
||
Price history
+0.0% since first listed2 events — show timeline
- 2026-05-14 Listed $115,000 SAMLS
- 2026-05-13 Listed $115,000 WBR
Cash-flow waterfall
monthlySold comps — $/sqft
last 12 mo · ≤1 miLoading sold comps…