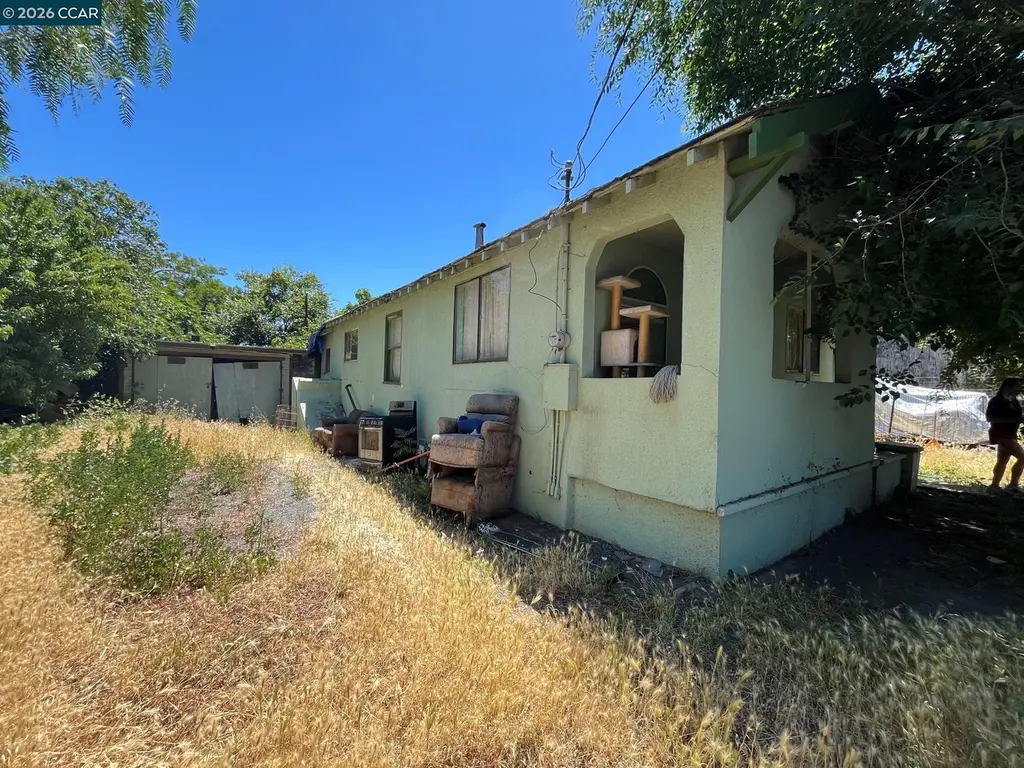
196 N Bella Monte Ave · Bay Point, CA
Flood risk 1/10 · Minimal
- FEMA flood zone
- X (unshaded)
- Chance of flooding over 30 yrs
- 0.0%
- Est. flood insurance / yr
- $507 – $1,088
Fire risk 6/10 · Moderate
- Est. fire insurance / yr
- $659 – $1,223
Heat risk 5/10 · Moderate
- Hot days now (above 98°F)
- 7 days/yr
- Hot days in 30 yrs
- 15 days/yr
Wind risk 1/10 · Minimal
- Chance of severe wind over 30 yrs
- —
Air-quality risk 8/10 · Major
- Unhealthy air days now
- 14 days/yr
- Unhealthy air days in 30 yrs
- 14 days/yr
Risk factors via First Street. Map © Google.
Why this score? — see what drove the C- grade
The composite is a weighted blend of 9 inputs, each scored 0–100. Each bar is that input's sub-score; the figure is the points it added to the 100-point composite (weight × sub-score).
- Cash flow +17.1/30.0
- ARV discount +15.0/15.0
- DSCR +5.3/10.0
- Schools +3.8/10.0
- 1% rule +3.4/10.0
- Livability +2.9/5.0
- Rent growth +2.8/5.0
- Condition / age +2.5/5.0
- Appreciation +0.0/10.0
$295,000
🖨 Deal sheet 📄 Offer letter ✓ Due diligence
Listing remarks
Attention Investors & Visionary Buyers: The Ultimate Sweat-Equity Opportunity Awaits: Unlock massive potential in one of Bay Point’s most rapidly developing pockets! Sitting on a generous sized lot, this diamond-in-the-rough is the blank canvas you have been searching for. Whether you are looking to execute a high-yield flip, build a profitable rental property, or design your own custom home from the studs up, this property is brimming with possibilities in a rising market. Commuter’s Dream: Located just minutes from Highway 4 and the Pittsburg/Bay Point BART Station, providing seamless transit access across the entire East Bay and into San Francisco. Steps to Recreation:
Key facts
- Open green spaces
- Home expansion
- Generous sized lot
Tags
Property features AI
Exterior
- Utilities: Public water; Public sewer
- Home design: Single family residence; Residential property; Built in 1931; Corner lot
- Construction: Stucco construction
- Exterior features: Back yard; Front yard; Side yard; Storage; Entry gate
Interior
- Kitchen: Gas range/cooktop; Microwave; Refrigerator
- Bedrooms: 2 bedrooms
- Flooring: Linoleum; Carpet
- Bathrooms: 1 full bathroom
- Interior features: Dining area; Living room
- Laundry & utility: Washer and dryer; Gas water heater
Neighborhood map
What this means for you Summary
Snapshot
- This is a 3-bed/1.0-bath single-family listed at $295k.
Deal economics
- At list price, monthly cash flow is $205 ($2k/yr) — positive.
- The deal already cash-flows at list — no discount required.
- To meet the 1% rule (rent ≥ 1% of price), the offer needs to be $249k (15.6% below list).
- Recommended offer: $249k (15.6% below list) — sets the bar for 1% rule.
- Cap rate 7.1% vs local median 3.7% in Bay Point — top-decile yield for the area; either an underpriced asset or a hidden risk that comps aren't pricing in. Stress-test before assuming the spread holds.
Location & tenants
- Location reads 57/100 on livability (#736 in CA) — a working-class tenant base; expect higher turnover. Strengths: housing A+, employment B+, health & safety B+; Watch: schools F, crime F, amenities F.
- Mt. Diablo Unified (suburban): math 36% / reading 45% proficiency, ranked #202 of 517 in CA (top 39%) — families likely to look elsewhere, expect single-tenant / working-renter base with shorter leases.
- Market conditions: Rents rising (+1.1%/yr); 265 active listings in the ZIP; 8 comparable units currently listed for rent nearby; rentals leasing fast (median 5d on market — plan ~1-2 weeks tenant-placement turnaround); solid renter incomes; 2,169 units permitted in Contra Costa County in 2024 (896 in 5+ unit buildings).
- This rent runs 31% of the median local income ($96k/yr) — at the standard rent-burdened threshold; future hikes will face affordability resistance.
Forward outlook
- Local home prices are declining (-3.0%/yr); year-one equity from $2k of loan paydown is wiped out by about $9k of value loss. Plan a longer hold.
- Contra Costa County population projected at +26% by 2050 — long-run rental-demand tailwind backs the buy-and-hold thesis.
Negotiation context
- Only 8 days on market — expect competitive offers; lowballing is unlikely to land.
- Current owner paid $15k; list at $295k implies a 1867% gain — meaningful room to come down on a strong offer.
Risks & watch-outs
- Watch-outs: built in 1931 — expect roof / HVAC / electrical / plumbing capex.
- Climate carrying-cost: major wildfire risk; extreme-heat days projected 7→15/yr by 2055 (HVAC capex compounding) — expect insurance premiums to compound above CPI over the hold.
Questions for the listing agent
- Built in 1931 — when were the roof, HVAC, electrical panel, plumbing, and water heater last replaced?
- Is there a deadline driving the sale (1031 exchange, divorce, estate, relocation)? That informs how much negotiation room exists.
- Schools are F-rated, which usually means shorter tenancies and higher turnover. Who's the typical renter profile here, and what's been the actual vacancy rate?
- Crime grade is F in this area — have there been break-ins, vandalism, or insurance claims at this property in the last 3 years? What carrier currently insures it and at what premium?
- What's the average days-on-market for RENTAL listings here right now (not sales)? A rising rental-DOM trend means longer vacancies and softer asking-rent achievability than the comps imply.
- What's the recent tenant-quality profile in this submarket — average credit score on applications, eviction rate, late-payment / NSF rate, and stable-employment percentage? A property-management company in the area should have these aggregated.
- How much new for-sale + rental construction is in the pipeline within 1–3 miles? Heavy new supply typically softens prices + rents 12–24 months out; constrained supply supports both.
Investment metrics
- 1% rule
- 0.84% ✗
- Cap rate
- 7.13%
- Cash-on-cash
- 2.98%
- DSCR
- 1.13
- GRM
- 9.9
CMA / ARV
- ARV (on-the-fly)
- $443,584
- Comps found
- 12
Show comp detail 12 sales within ~0.75 mi
| Address | Dist | Beds/Ba | Sqft | Sold | Price | $/sf | Match |
|---|---|---|---|---|---|---|---|
| 44 Montecello St | 0.47mi | 3/1.0 | 927 (-0%) | 9mo | $520,000 | $561 | 70 |
| 252 Madison Ave | 0.42mi | 2/1.0 (-1) | 894 (-4%) | 0mo | $455,000 | $509 | 69 |
| 284 Cleveland Ave | 0.51mi | 2/1.0 (-1) | 911 (-2%) | 9mo | $420,000 | $461 | 61 |
| 215 Madison Ave | 0.37mi | 2/1.0 (-1) | 884 (-5%) | 11mo | $245,000 | $277 | 61 |
| 118 Poinsettia Ave | 0.16mi | 2/1.0 (-1) | 816 (-12%) | 8mo | $410,000 | $502 | 61 |
| 88 S Bella Monte Ave | 0.28mi | 2/1.0 (-1) | 879 (-5%) | 16mo | $420,000 | $478 | 60 |
| 96 Sapone Ln | 0.28mi | 3/1.0 | 832 (-10%) | 14mo | $410,000 | $493 | 58 |
| 35 W Rose Ave | 0.23mi | 3/1.5 | 1,044 (+12%) | 10mo | $475,000 | $455 | 58 |
| 383 Cleveland Ave | 0.61mi | 2/1.0 (-1) | 874 (-6%) | 6mo | $395,000 | $452 | 52 |
| 205 Cleveland Ave | 0.34mi | 2/1.0 (-1) | 1,014 (+9%) | 14mo | $470,000 | $464 | 52 |
| 91 Mountain View Ave | 0.48mi | 2/2.0 (-1) | 828 (-11%) | 10mo | $480,000 | $580 | 42 |
| 2054 Mendocino Dr | 0.47mi | 2/2.0 (-1) | 1,059 (+14%) | 5mo | $460,000 | $434 | 41 |
Match score weights: distance 35% · size 25% · config 20% · recency 20%. Top-matched comps best support the ARV.
Projected returns pro-forma
-3.0% appreciation · 1.11% rent growth · sell at horizon
- IRR
- -13.5%
- Equity multiple
- 0.52×
- Total profit
- $-39,506
- Equity at exit
- $43,985
- IRR
- -7.6%
- Equity multiple
- 0.56×
- Total profit
- $-36,457
- Equity at exit
- $25,506
Cash invested: $82,600 (down + closing). Projections, not guarantees.
Landlord ↔ Tenant lean methodology
- Overall (STATE)
- 18 Strongly Tenant-Friendly
- State California
- 18 Strongly Tenant-Friendly · D+13
- County
- — inherits STATE
- City
- — inherits STATE
ZIP-level market 94565
- Rents YoY
- 1.1%
- Active inventory
- 265
- Price-to-rent
- 9.9×
Monthly cashflow live
- Estimated rent
- $2,489 high interval (Pro) →
- Mortgage (P&I)
- −$1,547
- Tax from tax record
- −$91 /mo · $1,091/yr
- Insurance
- −$123
- HOA
- −$0
- Vacancy / Maint / Mgmt
- −$523
- Net cashflow
- $205
Break-even live
UW: 25.0% down · 7.5% · 30yr · 1.5% tax · 5.0% vac · 8.0% maint · 8.0% mgmt
Financing live
Cash to close
- Down payment
- $73,750
- Closing costs
- $8,850
- Reserves months
- —
- Total cash needed
- —
Loan-product check · same deal, 3 products live
Conventional
25% down · 7.5% · 30yr
- Down + closing
- —
- Monthly P&I
- —
- Monthly cashflow
- —
- DSCR
- —
- Eligible?
- —
Personal DTI + credit; lowest rate.
DSCR
20% down · 8.5% · 30yr
- Down + closing
- —
- Monthly P&I
- —
- Monthly cashflow
- —
- DSCR
- —
- Eligible?
- —
No personal income docs; deal must DSCR.
Hard money
10% down · 12.0% · 12mo
- Down + closing
- —
- Monthly P&I
- —
- Monthly cashflow
- —
- DSCR
- —
- Eligible?
- —
Short-term bridge; refi at stabilization.
Rent comps 8 comps
| Address | Beds | Baths | Sqft | Rent | $/sqft | DOM | Units | Dist |
|---|---|---|---|---|---|---|---|---|
| 35 Roberts St Unit b Bay Point, CA | 2.0 | 1.0 | 800 | $1,795 | $2.24 | 2d | 1 | 0.41mi |
| 2901 Mary Ann Ln Bay Point, CA | 1.0–2.0 | 1.0–2.0 | 745 | $2,038 | $2.74 | 5d | 8 | 0.51mi |
| 1023 Chadwick Cir Bay Point, CA | 2.0 | 2.0 | 940 | $2,350 | $2.50 | 4d | 1 | 0.68mi |
| 515 Lancaster Ln #138 Bay Point, CA | 2.0 | 2.0 | 884 | $2,600 | $2.94 | 24d | 1 | 0.74mi |
| 138 Tammy Cir Bay Point, CA | 2.0 | 1.0 | 842 | $2,300 | $2.73 | 3d | 1 | 0.82mi |
| 2201 Oak Hills Cir Pittsburg, CA | 1.0–2.0 | 1.0–2.0 | 815 | $2,660 | $3.26 | 2d | 3 | 1.07mi |
| 1123 Shoreview Ct Bay Point, CA | 1.0–3.0 | 1.0–2.0 | 824 | $2,704 | $3.28 | 3d | 9 | 1.09mi |
| 60 Pacifica Ave Bay Point, CA | 2.0 | 1.5 | 864 | $1,775 | $2.05 | 24d | 1 | 1.46mi |
Listing history 7 events
-
2026-06-18days on market $295,000 Active 8 DOM
-
2026-06-17days on market $295,000 Active 7 DOM
-
2026-06-16days on market $295,000 Active 6 DOM
-
2026-06-15days on market $295,000 Active 5 DOM
-
2026-06-13days on market $295,000 Active 3 DOM
-
2026-06-13remarks 683-char remark
-
2026-06-13$295,000 Active 2 DOM
ⓘ Source: listings_history table (triggers on properties + properties_extension) + one-shot
backfill from property_details.listing_events for pre-trigger history.
Tax reassessment forecast CA · Resets to sale price
- Current annual tax
- $1,091 · $91/mo
- Projected year-2 tax
- $2,242 · $187/mo
- Expected delta
- +$1,151/yr (+$96/mo · 105.6%)
ⓘ Screening estimate from a state-policy table — verify with the county assessor before closing.
Climate risk First Street
- Flood 1/10 Low FEMA zone X (unshaded) · 0% chance over 30 yrs
- Wildfire 6/10 Major
- Heat 5/10 Major 7 d/yr ≥98°F today · 15 d/yr by 30 yrs out
- Wind 1/10 Low
- Air quality 8/10 Severe 14 unhealthy d/yr today · 14 by 30 yrs out
Nearby sold comps map
Loading sold comps map…
Walkable amenities ~0.75 mi
Loading nearby amenities…
Taxation est. · year 1
- Rental income
- $29,865
- − Mortgage interest
- −$16,525
- − Property taxes
- −$1,091
- − Insurance
- −$1,475
- − Repairs & maintenance
- −$2,389
- − Management
- −$2,389
- − Depreciation
- −$8,582
- Taxable loss
- −$2,585
- Est. tax savings @ 24.0%
- +$621
- After-tax cash flow
- $3,084/yr
For passive investors: Depreciation is non-cash, so a rental often shows a tax loss while cash-flowing — sheltering income. Rental losses are passive: they offset passive income freely, and up to $25,000/yr can offset ordinary (W-2) income if you actively participate and your MAGI is under $100k (phasing out to $0 by $150k); unused losses carry forward. On sale, claimed depreciation is recaptured at up to 25%, and gains may owe capital-gains tax (a 1031 exchange can defer both). Figures are a year-1 estimate at your 24.0% rate — not tax advice; consult a CPA.
Schools (NCES district)
- District
- Mt. Diablo Unified
- NCES district ID
- 0626370
- Math proficiency
- 36% ▼ -2.00%
- Reading proficiency
- 45% ▼ -5.00%
- Median HH income
- $77,494
- Composite
- 37.5/100
- National rank
- #4401
- State rank
- #202 of 517 in CA
Livability — Bay Point
- Score
- 57/100
- State rank
- #736
- US rank
- #21661
Category grades
Schools grade is shown separately in the Schools card above.
Census & demographics
- Census place
- Bay Point, CA
- County
- Contra Costa County · 1,059,880 people
- Metro
- San Francisco-Oakland-Berkeley, CA
- Population (ZIP)
- 100,488
- Household income
- $95,556
- Rent vs Own
- Severe rent burden
- 3942.0
Population outlook (Contra Costa County) Hauer SSP2
- Today (2025)
- 1,287,720 people
- By 2030
- 1,364,937 · +6.0%
- By 2040
- 1,506,209 · +17.0%
- By 2050
- 1,624,373 · +26.1%
- By 2075
- 1,853,193 · +43.9%
- By 2100
- 1,901,231 · +47.6%
Race, ethnicity, and origin ACS 2023
- Neighborhood character
- Diverse neighborhood (Simpson 0.70)
- Race & ethnicity
- Hispanic / Latino 48% Two or more races 19% Asian 17% White 16% Black 13% Pacific Islander 1% Native American 1%
- Hispanic origin (detail)
- Mexican 38% Puerto Rican 1%
- Common ancestry
- Italian 1% Russian 1% Lithuanian 1%
- Foreign-born
- 34% · Canada, China, Vietnam
- Languages at home
- 47% English-only · Spanish 37% Tagalog/Filipino 6% Other Indo-European 4%
Political lean MEDSL · Contra Costa
- 2024 margin
- Solid D (+38.0) · D 67.3% · R 29.4% · Other 3.3%
- 2008→2024 swing
- +0.2pp no change · 2008: 37.8pp · 2024: 38.0pp
- All cycles
- 2024: D+38.0 2020: D+45.3 2016: D+43.5 2012: D+33.7 2008: D+37.8
Not yet ingested
- Civics
- —
Market trends
- HPI YoY
- ▼ -478.40%
- Current HPI
- 376.2576
- Rent YoY
- ▲ 1.11%
- Metro
- San Francisco-Oakland-Berkeley, CA
- State GDP YoY
- ▲ 3.21%
- F500 in state
- 116
Industry mix (Fortune 500 HQ in CA)
| Industry | F500 HQs | Revenue |
|---|---|---|
| Technology | 27 | $1,492B |
|
||
| Financial Services | 3 | $174B |
|
||
| Retail | 3 | $44B |
|
||
| Insurance | 3 | $26B |
|
||
| Media / Entertainment | 2 | $115B |
|
||
| Pharmaceuticals / Biotech | 2 | $62B |
|
||
Price history
+1866.7% since first listed2 events — show timeline
- 2026-06-10 Listed $295,000 bridgeMLS, Bay East AOR, or Contra Costa AOR
- 1972-04-17 Sold (Public Records) $15,000 Public Records
Property tax history
+3.5%/yrLatest (2025): $1,091 · +6.2% YoY. Source: county tax records.
Cash-flow waterfall
monthlySold comps — $/sqft
last 12 mo · ≤1 miLoading sold comps…