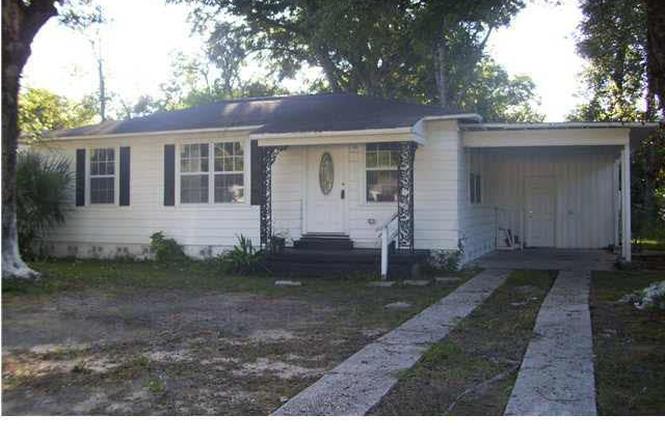
3007 Torres Ave · Pensacola, FL
Flood risk 1/10 · Minimal
- FEMA flood zone
- X (unshaded)
- Chance of flooding over 30 yrs
- 0.0%
- Est. flood insurance / yr
- $507 – $1,088
Fire risk 1/10 · Minimal
- Est. fire insurance / yr
- $947 – $1,759
Heat risk 10/10 · Severe
- Hot days now (above 105°F)
- 7 days/yr
- Hot days in 30 yrs
- 22 days/yr
Wind risk 9/10 · Severe
- Chance of severe wind over 30 yrs
- 99.0%
Air-quality risk 2/10 · Minimal
- Unhealthy air days now
- 0 days/yr
- Unhealthy air days in 30 yrs
- 1 days/yr
Risk factors via First Street. Map © Google.
Why this score? — see what drove the B grade
The composite is a weighted blend of 9 inputs, each scored 0–100. Each bar is that input's sub-score; the figure is the points it added to the 100-point composite (weight × sub-score).
- Cash flow +30.0/30.0
- 1% rule +10.0/10.0
- DSCR +10.0/10.0
- ARV discount +7.5/15.0
- Livability +4.2/5.0
- Schools +3.6/10.0
- Rent growth +3.3/5.0
- Condition / age +2.5/5.0
- Appreciation +0.0/10.0
$85,000
🖨 Deal sheet (PDF) 📄 Offer letter ✓ Due diligence
Listing remarks MLS
Seller says "make me an offer"! This home features a convenient location close to some of Pensacola's best shopping and dining venues, downtown, hospitals, the beach etc! This home has been restored and ready for move in! Upgrades include new windows, exterior doors, new paint inside and out and new carpet, kitchen has been updated with new stove, new refrigerator, new flooring and new countertops. Perfect home for the price!!
Key facts
- 7,840 sq ft lot
- Parking
- Built 1954
Property features AI
Finance
- Other: Homestead exempt; Public maintained road
- HOA & community: No homeowners association
Exterior
- Parking: Carport (1 covered space, total 1 parking space)
- Utilities: Public water; Public sewer; Electric with circuit breakers
- Home design: One-story frame home; Resale property; Not attached to another property; Slab foundation
- Construction: Frame construction; Composition roof; Slab foundation; One level
- Exterior features: Interior lot
Interior
- Kitchen: Gas water heater; Kitchen on the first floor (approximately 12' x 10')
- Bedrooms: Master bedroom on the first floor (approximately 12' x 12')
- Flooring: Hardwood; Tile
- Bathrooms: 1 full bathroom
- Heating & cooling: Central air; Ceiling fans; Natural gas heating
- Interior features: Hardwood and tile flooring; Eat-in kitchen and formal dining room
- Laundry & utility: Public maintained road access
Neighborhood map
What this means for you Summary
Snapshot
- This is a 6-bed/1.0-bath single-family listed at $85k.
Deal economics
- At list price, monthly cash flow is $1k ($13k/yr) — positive.
- The deal already cash-flows at list — no discount required.
- Meets the 1% rule at list price ($2k rent vs $85k).
- Recommended offer: $80k (6.0% below list) — sets the bar for market timing.
Location & tenants
- Location reads 83/100 on livability (#53 in FL, #924 nationally) — a professional / high-income tenant draw. Strengths: commute A+, cost of living A+, housing A+.
- Escambia (suburban): math 40% / reading 45% proficiency, ranked #56 of 73 in FL (top 77%) — families likely to look elsewhere, expect single-tenant / working-renter base with shorter leases.
- Zoned schools: O. J. Semmes Elementary School (math 22% / reading 17%, grade F, #2,105 of 2,144 statewide, top 98%, 302 students, 91% FRL); J. H. Workman Middle School (math 20% / reading 27%, grade F, #536 of 571 statewide, top 95%, 705 students, 72% FRL); Washington Senior High School (math 25% / reading 40%, grade F, #411 of 667 statewide, top 62%, 1,733 students, 51% FRL).
- Zoned-school proficiency averages 25% at this address vs 42% district-wide (-17 pts) — the specific schools serving this property underperform the Escambia average; the district grade overstates school quality for this exact location.
- Market conditions: Rents rising (+3.4%/yr); 240 active listings in the ZIP; 1 comparable units currently listed for rent nearby; 1,479 units permitted in Escambia County in 2024 (0 in 5+ unit buildings).
Forward outlook
- Local home prices are declining (-3.0%/yr); year-one equity from $588 of loan paydown is wiped out by about $3k of value loss. Plan a longer hold.
- Escambia County population projected at +13% by 2050 — modest demand growth; plan on rents tracking national, not racing it.
- At projected returns (-3.0% appreciation + 3.4% rent growth), your $24k cash investment doubles in ~3 years — after that, you're playing with house money.
Negotiation context
- It's been on market 72 days — a 6% lower offer ($80k) is reasonable based on typical stale-listing flexibility.
- 5 sale attempts since 16y ago; this cycle's ask has dropped $45k (35%) from the opening price — seller is motivated, your offer sets the floor, not the list.
- Current owner paid $32k; list at $85k implies a 166% gain — meaningful room to come down on a strong offer.
Risks & watch-outs
- Watch-outs: built in 1954 — expect roof / HVAC / electrical / plumbing capex.
- Climate carrying-cost: severe wind risk, 99% chance of damaging wind over 30y; extreme-heat days projected 7→22/yr by 2055 (HVAC capex compounding) — expect insurance premiums to compound above CPI over the hold.
Questions for the listing agent
- It's been on market 72 days. Have you received any prior offers? Is the seller open to a 6% concession, seller financing, or rate buy-down credit?
- Built in 1954 — when were the roof, HVAC, electrical panel, plumbing, and water heater last replaced?
- Why hasn't it sold? Are there any deal-killer items the seller is aware of (foundation, flood, title, zoning, code violations)?
- Is there a deadline driving the sale (1031 exchange, divorce, estate, relocation)? That informs how much negotiation room exists.
- What's the average days-on-market for RENTAL listings here right now (not sales)? A rising rental-DOM trend means longer vacancies and softer asking-rent achievability than the comps imply.
- What's the recent tenant-quality profile in this submarket — average credit score on applications, eviction rate, late-payment / NSF rate, and stable-employment percentage? A property-management company in the area should have these aggregated.
- How much new for-sale + rental construction is in the pipeline within 1–3 miles? Heavy new supply typically softens prices + rents 12–24 months out; constrained supply supports both.
Investment metrics
- 1% rule
- 2.57% ✓
- Cap rate
- 21.76%
- Cash-on-cash
- 55.25%
- DSCR
- 3.46
- GRM
- 3.2
CMA / ARV
No comps found within radius.
Projected returns pro-forma
-3.0% appreciation · 3.39% rent growth · sell at horizon
- IRR
- 54.0%
- Equity multiple
- 3.39×
- Total profit
- $56,938
- Equity at exit
- $12,674
- IRR
- 59.3%
- Equity multiple
- 7.02×
- Total profit
- $143,246
- Equity at exit
- $7,349
Cash invested: $23,800 (down + closing). Projections, not guarantees.
Landlord ↔ Tenant lean methodology
- Overall (STATE)
- 87 Strongly Landlord-Friendly
- State Florida
- 87 Strongly Landlord-Friendly · R+3
- County
- — inherits STATE
- City
- — inherits STATE
ZIP-level market 32503
- Rents YoY
- 3.4%
- Active inventory
- 240
- Price-to-rent
- 3.2×
Monthly cashflow live
- Estimated rent
- $2,184 medium interval (Pro) →
- Mortgage (P&I)
- −$446
- Tax from tax record
- −$148 /mo · $1,779/yr
- Insurance
- −$35
- HOA
- −$0
- Vacancy / Maint / Mgmt
- −$459
- Net cashflow
- $1,096
Break-even live
Sensitivity live
| Price | -10% $1,144 | -5% $1,120 | +0% $1,096 | +5% $1,072 | +10% $1,048 |
|---|---|---|---|---|---|
| Rent | -10% $923 | -5% $1,010 | +0% $1,096 | +5% $1,182 | +10% $1,268 |
| Rate | -1.0pp $1,139 | -0.5pp $1,117 | base $1,096 | +0.5pp $1,074 | +1.0pp $1,051 |
UW: 25.0% down · 7.5% · 30yr · 1.5% tax · 5.0% vac · 8.0% maint · 8.0% mgmt
Financing live
Cash to close
- Down payment
- $21,250
- Closing costs
- $2,550
- Reserves months
- —
- Total cash needed
- —
Loan-product check · same deal, 3 products live
Conventional
25% down · 7.5% · 30yr
- Down + closing
- —
- Monthly P&I
- —
- Monthly cashflow
- —
- DSCR
- —
- Eligible?
- —
Personal DTI + credit; lowest rate.
DSCR
20% down · 8.5% · 30yr
- Down + closing
- —
- Monthly P&I
- —
- Monthly cashflow
- —
- DSCR
- —
- Eligible?
- —
No personal income docs; deal must DSCR.
Hard money
10% down · 12.0% · 12mo
- Down + closing
- —
- Monthly P&I
- —
- Monthly cashflow
- —
- DSCR
- —
- Eligible?
- —
Short-term bridge; refi at stabilization.
Rent comps 1 comps
| Address | Beds | Baths | Sqft | Rent | $/sqft | DOM | Units | Dist |
|---|---|---|---|---|---|---|---|---|
| 1901 N Davis Hwy Pensacola, FL | 6.0 | 2.0 | 1200 | $2,150 | $1.79 | 15d | 1 | 0.83mi |
Listing history 12 events
-
2026-05-12status Pending
-
2026-05-06price $85,000
-
2026-04-17status Active
-
2026-04-08status Pending
-
2026-04-02status Active
-
2026-03-06historical Contingent
-
2026-02-19$130,000 Active
-
2011-04-11soldstatus $32,000 440-char remark
Show marketing remark (440 chars)
Seller says "make me an offer"! This home features a convenient location close to some of Pensacola's best shopping and dining venues, downtown, hospitals, the beach etc! This home has been restored and ready for move in! Upgrades include new windows, exterior doors, new paint inside and out and new carpet, kitchen has been updated with new stove, new refrigerator, new flooring and new countertops. Perfect home for the price!!
-
2010-10-12$42,000 440-char remark
Show marketing remark (440 chars)
Seller says "make me an offer"! This home features a convenient location close to some of Pensacola's best shopping and dining venues, downtown, hospitals, the beach etc! This home has been restored and ready for move in! Upgrades include new windows, exterior doors, new paint inside and out and new carpet, kitchen has been updated with new stove, new refrigerator, new flooring and new countertops. Perfect home for the price!!
-
2010-09-28historical
-
2010-01-06$55,000
-
1968-01-01soldstatus $12,500
ⓘ Source: listings_history table (triggers on properties + properties_extension) + one-shot
backfill from property_details.listing_events for pre-trigger history.
Tax reassessment forecast FL · Resets to sale price
- Current annual tax
- $1,779 · $148/mo
- Projected year-2 tax
- $1,779 · $148/mo
- Expected delta
- $0/yr ($0/mo · 0.0%)
ⓘ Screening estimate from a state-policy table — verify with the county assessor before closing.
Climate risk First Street
- Flood 1/10 Low FEMA zone X (unshaded) · 0% chance over 30 yrs
- Wildfire 1/10 Low
- Heat 10/10 Extreme 7 d/yr ≥105°F today · 22 d/yr by 30 yrs out
- Wind 9/10 Extreme 99% chance of damaging wind over 30 yrs
- Air quality 2/10 Low 0 unhealthy d/yr today · 1 by 30 yrs out
Nearby sold comps map
Loading sold comps map…
Walkable amenities ~0.75 mi
Loading nearby amenities…
Taxation est. · year 1
- Rental income
- $26,206
- − Mortgage interest
- −$4,761
- − Property taxes
- −$1,779
- − Insurance
- −$425
- − Repairs & maintenance
- −$2,096
- − Management
- −$2,096
- − Depreciation
- −$2,473
- Taxable income
- $12,575
- Est. tax owed @ 24.0%
- −$3,018
- After-tax cash flow
- $10,132/yr
For passive investors: Depreciation is non-cash, so a rental often shows a tax loss while cash-flowing — sheltering income. Rental losses are passive: they offset passive income freely, and up to $25,000/yr can offset ordinary (W-2) income if you actively participate and your MAGI is under $100k (phasing out to $0 by $150k); unused losses carry forward. On sale, claimed depreciation is recaptured at up to 25%, and gains may owe capital-gains tax (a 1031 exchange can defer both). Figures are a year-1 estimate at your 24.0% rate — not tax advice; consult a CPA.
Schools (NCES district)
- District
- Escambia
- NCES district ID
- 1200510
- Math proficiency
- 40% ▼ -9.00%
- Reading proficiency
- 45% ▼ -4.00%
- Median HH income
- $44,649
- Composite
- 36.04/100
- National rank
- #4773
- State rank
- #56 of 73 in FL
Livability — Pensacola
- Score
- 83/100
- State rank
- #53
- US rank
- #924
Category grades
Schools grade is shown separately in the Schools card above.
Census & demographics
- Census place
- Pensacola, FL
- County
- Escambia County · 301,722 people
- City population
- 237,636
- Metro
- Pensacola-Ferry Pass-Brent, FL
- Population (ZIP)
- 33,559
- Household income
- $71,411
- Rent vs Own
- Severe rent burden
- 948.0
Population outlook (Escambia County) Hauer SSP2
- Today (2025)
- 334,637 people
- By 2030
- 345,779 · +3.3%
- By 2040
- 364,828 · +9.0%
- By 2050
- 378,514 · +13.1%
- By 2075
- 403,220 · +20.5%
- By 2100
- 386,125 · +15.4%
Race, ethnicity, and origin ACS 2023
- Neighborhood character
- Predominantly White (68%)
- Race & ethnicity
- White 68% Black 20% Two or more races 6% Hispanic / Latino 5% Asian 2%
- Common ancestry
- Lithuanian 3% Italian 2% Romanian 2%
- Foreign-born
- 5% · Canada, China
- Languages at home
- 93% English-only · Spanish 3% Arabic 1% Tagalog/Filipino 1%
Political lean MEDSL · Escambia
- 2024 margin
- R (+19.5) · D 39.7% · R 59.2% · Other 1.1%
- 2008→2024 swing
- -0.2pp no change · 2008: -19.3pp · 2024: -19.5pp
- All cycles
- 2024: R+19.5 2020: R+15.1 2016: R+20.6 2012: R+20.6 2008: R+19.3
Not yet ingested
- Civics
- —
Market trends
- HPI YoY
- ▼ -300.02%
- Current HPI
- 294.4873
- Rent YoY
- ▲ 3.39%
- Metro
- Pensacola-Ferry Pass-Brent, FL
- State GDP YoY
- ▲ 3.28%
- F500 in state
- 36
Industry mix (Fortune 500 HQ in FL)
| Industry | F500 HQs | Revenue |
|---|---|---|
| Industrial Technology | 2 | $29B |
|
||
| Insurance | 2 | $17B |
|
||
| Retail | 1 | $60B |
|
||
| Technology Distribution | 1 | $58B |
|
||
| Homebuilding | 1 | $35B |
|
||
| Technology Manufacturing | 1 | $35B |
|
||
Price history
+580.0% since first listed12 events — show timeline
- 2026-05-12 Pending — PARMLS
- 2026-05-06 Price Changed $85,000 PARMLS
- 2026-04-17 Relisted — PARMLS
- 2026-04-08 Pending — PARMLS
- 2026-04-02 Relisted — PARMLS
- 2026-03-06 Contingent — PARMLS
- 2026-02-19 Listed $130,000 PARMLS
- 2011-04-11 Sold (MLS) $32,000 PARMLS
- 2010-10-12 Listed $42,000 PARMLS
- 2010-09-28 Listing Removed — PARMLS
- 2010-01-06 Listed $55,000 PARMLS
- 1968-01-01 Sold (Public Records) $12,500 Public Records
Property tax history
+6.2%/yrLatest (2025): $1,779 · +9.7% YoY. Source: county tax records.
Cash-flow waterfall
monthlySold comps — $/sqft
last 12 mo · ≤1 miLoading sold comps…