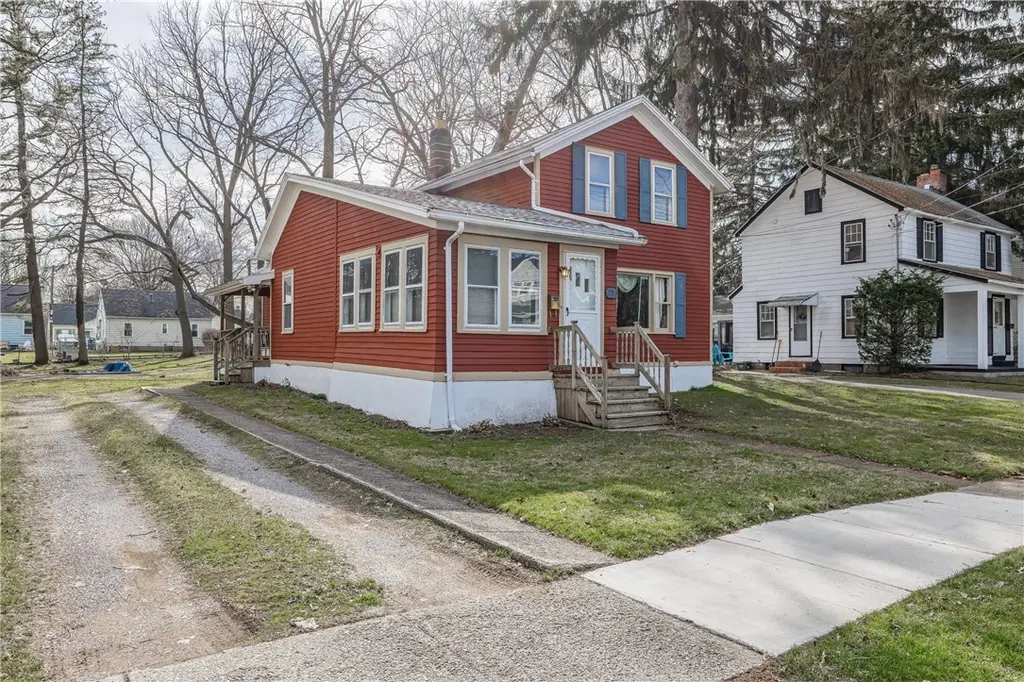
73 Pollard Ave · Rochester, NY
Flood risk 1/10 · Minimal
- FEMA flood zone
- X (unshaded)
- Chance of flooding over 30 yrs
- 0.0%
- Est. flood insurance / yr
- $473 – $860
Fire risk 2/10 · Minimal
- Est. fire insurance / yr
- $691 – $1,283
Heat risk 2/10 · Minimal
- Hot days now (above 95°F)
- 7 days/yr
- Hot days in 30 yrs
- 16 days/yr
Wind risk 1/10 · Minimal
- Chance of severe wind over 30 yrs
- —
Air-quality risk 2/10 · Minimal
- Unhealthy air days now
- 1 days/yr
- Unhealthy air days in 30 yrs
- 2 days/yr
Risk factors via First Street. Map © Google.
Why this score? — see what drove the B- grade
The composite is a weighted blend of 9 inputs, each scored 0–100. Each bar is that input's sub-score; the figure is the points it added to the 100-point composite (weight × sub-score).
- Cash flow +30.0/30.0
- 1% rule +10.0/10.0
- DSCR +10.0/10.0
- ARV discount +7.5/15.0
- Rent growth +3.8/5.0
- Livability +3.8/5.0
- Condition / age +2.5/5.0
- Schools +1.9/10.0
- Appreciation +0.0/10.0
$99,900
🖨 Deal sheet (PDF) 📄 Offer letter ✓ Due diligence
Listing remarks
Welcome to 73 Pollard Ave in Charlotte near the Lake * * Cute well-maintained 6 room Cape with charming features and 1,374 Square Feet * * Big yard & mature trees. .. feels like the Country!! * * Very Nice Lot with Southern Exposure * * Open side porch. .. leads to eat-in kitchen. .. big formal dining room. .. big living room. .. 1st floor bedroom. .. 1st floor full bathroom. .. 2 more bedrooms upstairs with a 2nd full bathroom upstairs * * Freshly painted and move-in ready * * Front Main Section of Roof was a recent tear-off * * Delayed Negotiations until April 7th at 1:00pm * * Good Luck!
Key facts
- Big yard
- Southern exposure
- Eat-in kitchen
Tags
Neighborhood map
What this means for you Summary
Snapshot
- This is a 2-bed/1.0-bath single-family listed at $100k.
Deal economics
- At list price, monthly cash flow is $895 ($11k/yr) — positive.
- The deal already cash-flows at list — no discount required.
- Meets the 1% rule at list price ($2k rent vs $100k).
- Cap rate 17.0% vs local median 9.3% in Rochester — top-decile yield for the area; either an underpriced asset or a hidden risk that comps aren't pricing in. Stress-test before assuming the spread holds.
Location & tenants
- Location reads 76/100 on livability (#222 in NY, #3,482 nationally) — a middle-class / working-renter tenant base. Strengths: commute A+, cost of living A+, housing A+; Watch: schools D+, crime F, employment F.
- Rochester City School District (urban): math 21% / reading 26% proficiency, ranked #589 of 590 in NY (top 100%) — low school quality limits family demand, transient renter base, plan for 1-2y turnover; 82% free/reduced lunch — lower-income household profile, screen leases tightly.
- Market conditions: Rents rising fast (+5.4%/yr); 129 active listings in the ZIP; 12 comparable units currently listed for rent nearby; rentals leasing fast (median 4d on market — plan ~1-2 weeks tenant-placement turnaround); solid renter incomes; 1,169 units permitted in Monroe County in 2024 (591 in 5+ unit buildings).
Forward outlook
- Local home prices are declining (-3.0%/yr); year-one equity from $691 of loan paydown is wiped out by about $3k of value loss. Plan a longer hold.
- Monroe County population projected to shrink 6% by 2050 — rents likely to lag national; underwrite the cash flow, not the appreciation.
- At projected returns (-3.0% appreciation + 5.4% rent growth), your $28k cash investment doubles in ~3 years — after that, you're playing with house money.
Negotiation context
- Only 10 days on market — expect competitive offers; lowballing is unlikely to land.
- Current owner paid $45k; list at $100k implies a 122% gain — meaningful room to come down on a strong offer.
Risks & watch-outs
- Watch-outs: built in 1900 — expect roof / HVAC / electrical / plumbing capex.
Questions for the listing agent
- Built in 1900 — when were the roof, HVAC, electrical panel, plumbing, and water heater last replaced?
- Is there a deadline driving the sale (1031 exchange, divorce, estate, relocation)? That informs how much negotiation room exists.
- Schools are D-rated, which usually means shorter tenancies and higher turnover. Who's the typical renter profile here, and what's been the actual vacancy rate?
- Crime grade is F in this area — have there been break-ins, vandalism, or insurance claims at this property in the last 3 years? What carrier currently insures it and at what premium?
- What's the average days-on-market for RENTAL listings here right now (not sales)? A rising rental-DOM trend means longer vacancies and softer asking-rent achievability than the comps imply.
- What's the recent tenant-quality profile in this submarket — average credit score on applications, eviction rate, late-payment / NSF rate, and stable-employment percentage? A property-management company in the area should have these aggregated.
- How much new for-sale + rental construction is in the pipeline within 1–3 miles? Heavy new supply typically softens prices + rents 12–24 months out; constrained supply supports both.
Investment metrics
- 1% rule
- 1.95% ✓
- Cap rate
- 17.05%
- Cash-on-cash
- 38.41%
- DSCR
- 2.71
- GRM
- 4.3
CMA / ARV
- ARV (on-the-fly)
- $230,832
- Comps found
- 12
Show comp detail 12 sales within ~0.75 mi
| Address | Dist | Beds/Ba | Sqft | Sold | Price | $/sf | Match |
|---|---|---|---|---|---|---|---|
| 158 Stutson St | 0.19mi | 2/2.0 | 1,169 (-15%) | 5mo | $185,000 | $158 | 58 |
| 173 Eaton Rd | 0.67mi | 3/1.5 (+1) | 1,332 (-3%) | 1mo | $302,000 | $227 | 56 |
| 522 Latta Rd | 0.44mi | 2/2.0 | 1,515 (+10%) | 4mo | $250,000 | $165 | 55 |
| 497 Hampton Blvd | 0.55mi | 3/1.0 (+1) | 1,296 (-6%) | 7mo | $224,000 | $173 | 54 |
| 65 Camden St | 0.75mi | 3/1.0 (+1) | 1,322 (-4%) | 1mo | $282,000 | $213 | 53 |
| 197 Eaton Rd | 0.71mi | 3/1.0 (+1) | 1,348 (-2%) | 7mo | $220,000 | $163 | 53 |
| 20 Afton St | 0.54mi | 3/1.0 (+1) | 1,255 (-9%) | 7mo | $53,000 | $42 | 50 |
| 25 Lakeland Ave | 0.57mi | 3/1.5 (+1) | 1,459 (+6%) | 8mo | $165,000 | $113 | 49 |
| 231 Hampton Blvd | 0.55mi | 2/2.5 | 1,548 (+13%) | 0mo | $260,000 | $168 | 47 |
| 238 Belmont Rd | 0.48mi | 3/1.0 (+1) | 1,200 (-13%) | 8mo | $230,000 | $192 | 45 |
| 82 Lakeland Ave | 0.58mi | 3/1.5 (+1) | 1,500 (+9%) | 7mo | $180,000 | $120 | 45 |
| 83 Dohrcrest Dr | 0.72mi | 3/2.0 (+1) | 1,284 (-7%) | 8mo | $225,000 | $175 | 40 |
Match score weights: distance 35% · size 25% · config 20% · recency 20%. Top-matched comps best support the ARV.
Projected returns pro-forma
-3.0% appreciation · 5.37% rent growth · sell at horizon
- IRR
- 37.1%
- Equity multiple
- 2.63×
- Total profit
- $45,595
- Equity at exit
- $14,895
- IRR
- 44.9%
- Equity multiple
- 5.78×
- Total profit
- $133,619
- Equity at exit
- $8,638
Cash invested: $27,972 (down + closing). Projections, not guarantees.
Landlord ↔ Tenant lean methodology
- Overall (STATE)
- 15 Strongly Tenant-Friendly
- State New York
- 15 Strongly Tenant-Friendly · D+10
- County
- — inherits STATE
- City
- — inherits STATE
ZIP-level market 14612
- Home prices YoY
- -33.0%
- Rents YoY
- 5.4%
- Active inventory
- 129
- Price-to-rent
- 4.3×
Monthly cashflow live
- Estimated rent
- $1,948 high interval (Pro) →
- Mortgage (P&I)
- −$524
- Tax from tax record
- −$78 /mo · $935/yr
- Insurance
- −$42
- HOA
- −$0
- Vacancy / Maint / Mgmt
- −$409
- Net cashflow
- $895
Break-even live
Sensitivity live
| Price | -10% $952 | -5% $924 | +0% $895 | +5% $867 | +10% $839 |
|---|---|---|---|---|---|
| Rent | -10% $741 | -5% $818 | +0% $895 | +5% $972 | +10% $1,049 |
| Rate | -1.0pp $946 | -0.5pp $921 | base $895 | +0.5pp $869 | +1.0pp $843 |
UW: 25.0% down · 7.5% · 30yr · 1.5% tax · 5.0% vac · 8.0% maint · 8.0% mgmt
Financing live
Cash to close
- Down payment
- $24,975
- Closing costs
- $2,997
- Reserves months
- —
- Total cash needed
- —
Loan-product check · same deal, 3 products live
Conventional
25% down · 7.5% · 30yr
- Down + closing
- —
- Monthly P&I
- —
- Monthly cashflow
- —
- DSCR
- —
- Eligible?
- —
Personal DTI + credit; lowest rate.
DSCR
20% down · 8.5% · 30yr
- Down + closing
- —
- Monthly P&I
- —
- Monthly cashflow
- —
- DSCR
- —
- Eligible?
- —
No personal income docs; deal must DSCR.
Hard money
10% down · 12.0% · 12mo
- Down + closing
- —
- Monthly P&I
- —
- Monthly cashflow
- —
- DSCR
- —
- Eligible?
- —
Short-term bridge; refi at stabilization.
Rent comps 12 comps
| Address | Beds | Baths | Sqft | Rent | $/sqft | DOM | Units | Dist |
|---|---|---|---|---|---|---|---|---|
| 4302 Lake Ave Unit 1 Rochester, NY | 3.0 | 1.5 | 1600 | $3,000 | $1.88 | 45d | 1 | 0.16mi |
| 123 Spanish Trl Rochester, NY | 1.0–2.0 | 1.0–1.5 | 945 | $1,775 | $1.88 | 4d | 1 | 0.39mi |
| 500 Greenleaf Rd Rochester, NY | 1.0–2.0 | 1.0 | 1176 | $1,650 | $1.40 | 4d | 1 | 0.41mi |
| 125 Windsor Rd Rochester, NY | 2.0 | 1.0 | 1142 | $1,700 | $1.49 | 4d | 1 | 0.70mi |
| 44 Windsor Rd Rochester, NY | 3.0 | 1.0 | 882 | $1,795 | $2.04 | 4d | 1 | 0.80mi |
| 534-582 Denise Rd Unit 562 Rochester, NY | 2.0 | 1.0 | 1000 | $1,575 | $1.57 | 4d | 1 | 0.82mi |
| 3677 Lake Ave Rochester, NY | 2.0 | 1.0 | 1088 | $1,200 | $1.10 | 45d | 1 | 0.83mi |
| 360 Britton Rd Rochester, NY | 1.0–2.0 | 1.0 | 837 | $1,479 | $1.77 | 4d | 2 | 1.19mi |
| 419 Britton Rd Rochester, NY | 2.0 | 1.5 | 1025 | $1,595 | $1.56 | 4d | 1 | 1.28mi |
| 108 Glenbrook Rd Rochester, NY | 3.0 | 1.0 | 1088 | $1,850 | $1.70 | 24d | 1 | 1.31mi |
| 1255 Latta Rd Greece, NY | 1.0–2.0 | 1.0 | 705 | $1,570 | $2.23 | 4d | 5 | 1.38mi |
| 304 Bakerdale Rd Rochester, NY | 3.0 | 1.0 | 1256 | $1,650 | $1.31 | 45d | 1 | 1.39mi |
Listing history 3 events
-
2026-04-10status Pending
-
2026-03-31$99,900 Active
-
2001-07-31soldstatus $45,000
ⓘ Source: listings_history table (triggers on properties + properties_extension) + one-shot
backfill from property_details.listing_events for pre-trigger history.
Tax reassessment forecast NY · Partial reset (capped growth)
- Current annual tax
- $935 · $78/mo
- Projected year-2 tax
- $1,312 · $109/mo
- Expected delta
- +$376/yr (+$31/mo · 40.2%)
ⓘ Screening estimate from a state-policy table — verify with the county assessor before closing.
Climate risk First Street
- Flood 1/10 Low FEMA zone X (unshaded) · 0% chance over 30 yrs
- Wildfire 2/10 Low
- Heat 2/10 Low 7 d/yr ≥95°F today · 16 d/yr by 30 yrs out
- Wind 1/10 Low
- Air quality 2/10 Low 1 unhealthy d/yr today · 2 by 30 yrs out
Nearby sold comps map
Loading sold comps map…
Walkable amenities ~0.75 mi
Loading nearby amenities…
Taxation est. · year 1
- Rental income
- $23,375
- − Mortgage interest
- −$5,596
- − Property taxes
- −$935
- − Insurance
- −$500
- − Repairs & maintenance
- −$1,870
- − Management
- −$1,870
- − Depreciation
- −$2,906
- Taxable income
- $9,698
- Est. tax owed @ 24.0%
- −$2,327
- After-tax cash flow
- $8,417/yr
For passive investors: Depreciation is non-cash, so a rental often shows a tax loss while cash-flowing — sheltering income. Rental losses are passive: they offset passive income freely, and up to $25,000/yr can offset ordinary (W-2) income if you actively participate and your MAGI is under $100k (phasing out to $0 by $150k); unused losses carry forward. On sale, claimed depreciation is recaptured at up to 25%, and gains may owe capital-gains tax (a 1031 exchange can defer both). Figures are a year-1 estimate at your 24.0% rate — not tax advice; consult a CPA.
Schools (NCES district)
- District
- Rochester City School District
- NCES district ID
- 3624750
- Math proficiency
- 21% ▬ 0.00%
- Reading proficiency
- 26% ▲ 4.00%
- Median HH income
- $30,923
- Composite
- 18.98/100
- National rank
- #8850
- State rank
- #589 of 590 in NY
Livability — Rochester
- Score
- 76/100
- State rank
- #222
- US rank
- #3482
Category grades
Schools grade is shown separately in the Schools card above.
Census & demographics
- Census place
- Rochester, NY
- County
- Monroe County · 674,131 people
- City population
- 432,803
- Metro
- Rochester, NY
- Population (ZIP)
- 35,152
- Household income
- $82,800
- Rent vs Own
- Severe rent burden
- 1063.0
Population outlook (Monroe County) Hauer SSP2
- Today (2025)
- 759,460 people
- By 2030
- 757,154 · -0.3%
- By 2040
- 740,644 · -2.5%
- By 2050
- 714,443 · -5.9%
- By 2075
- 645,883 · -15.0%
- By 2100
- 547,084 · -28.0%
Race, ethnicity, and origin ACS 2023
- Neighborhood character
- Predominantly White (78%)
- Race & ethnicity
- White 78% Black 9% Hispanic / Latino 7% Two or more races 6%
- Hispanic origin (detail)
- Puerto Rican 5%
- Common ancestry
- Romanian 4% Lithuanian 3% Slovak 2%
- Foreign-born
- 5% · Canada
- Languages at home
- 93% English-only · Spanish 4% Other Indo-European 1% Russian/Polish/Slavic 1%
Political lean MEDSL · Monroe
- 2024 margin
- D (+19.1) · D 59.5% · R 40.5%
- 2008→2024 swing
- +1.4pp toward D · 2008: 17.7pp · 2024: 19.1pp
- All cycles
- 2024: D+19.1 2020: D+21.0 2016: D+14.1 2012: D+17.4 2008: D+17.7
Not yet ingested
- Civics
- —
Market trends
- HPI YoY
- ▼ -124.89%
- Current HPI
- 254.157
- Rent YoY
- ▲ 5.37%
- Metro
- Rochester, NY
- State GDP YoY
- ▲ 2.60%
- F500 in state
- 92
Industry mix (Fortune 500 HQ in NY)
| Industry | F500 HQs | Revenue |
|---|---|---|
| Financial Services | 10 | $950B |
|
||
| Consumer Goods | 9 | $162B |
|
||
| Insurance | 4 | $225B |
|
||
| Telecommunications | 2 | $144B |
|
||
| Pharmaceuticals | 2 | $112B |
|
||
| Media / Entertainment | 2 | $69B |
|
||
Price history
+122.0% since first listed3 events — show timeline
- 2026-04-10 Pending — UNYREIS
- 2026-03-31 Listed $99,900 UNYREIS
- 2001-07-31 Sold (Public Records) $45,000 Public Records
Property tax history
+0.4%/yrLatest (2025): $935 · +0.0% YoY. Source: county tax records.
Cash-flow waterfall
monthlySold comps — $/sqft
last 12 mo · ≤1 miLoading sold comps…