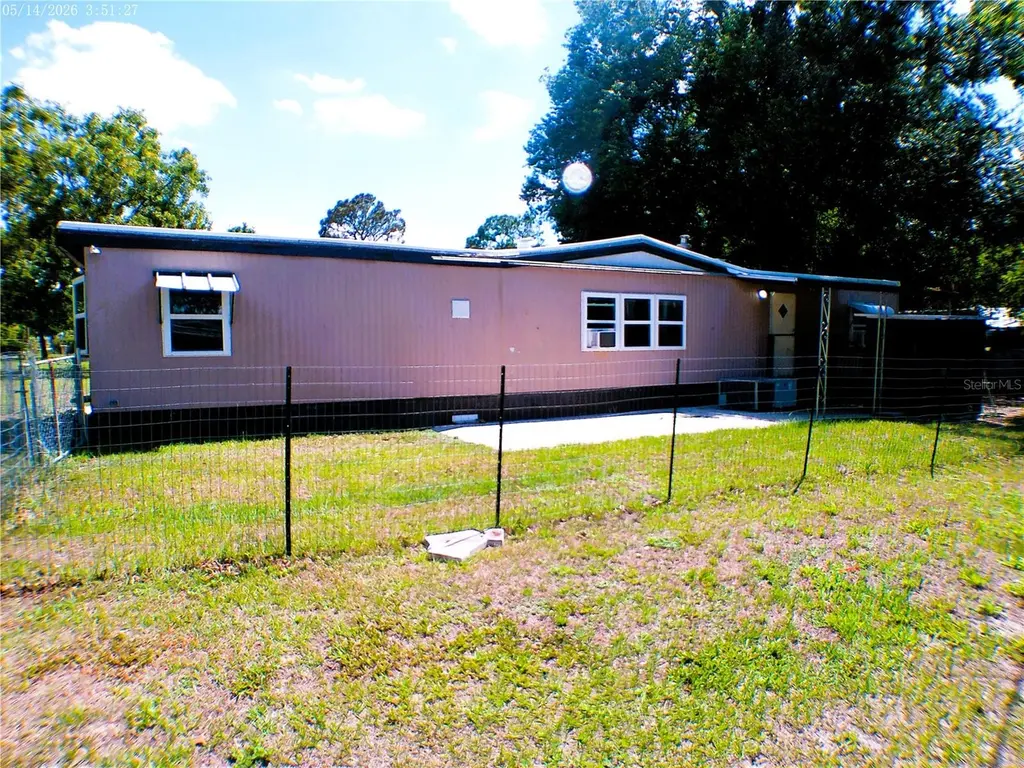
11838 SE 99th Ct · Silver Springs Shores, FL
Flood risk 1/10 · Minimal
- FEMA flood zone
- X (unshaded)
- Chance of flooding over 30 yrs
- 0.0%
- Est. flood insurance / yr
- $507 – $1,088
Fire risk 5/10 · Moderate
- Est. fire insurance / yr
- $947 – $1,759
Heat risk 8/10 · Major
- Hot days now (above 109°F)
- 7 days/yr
- Hot days in 30 yrs
- 21 days/yr
Wind risk 9/10 · Severe
- Chance of severe wind over 30 yrs
- 99.0%
Air-quality risk 3/10 · Minor
- Unhealthy air days now
- 3 days/yr
- Unhealthy air days in 30 yrs
- 4 days/yr
Risk factors via First Street. Map © Google.
Why this score? — see what drove the C+ grade
The composite is a weighted blend of 9 inputs, each scored 0–100. Each bar is that input's sub-score; the figure is the points it added to the 100-point composite (weight × sub-score).
- Cash flow +25.9/30.0
- DSCR +8.7/10.0
- ARV discount +7.5/15.0
- 1% rule +6.4/10.0
- Schools +3.6/10.0
- Livability +3.4/5.0
- Rent growth +2.5/5.0
- Condition / age +2.5/5.0
- Appreciation +0.0/10.0
$105,000
🖨 Deal sheet (PDF) 📄 Offer letter ✓ Due diligence
Listing remarks MLS
Priced to sell! Great Investment property and a great chance to get a deal on a home that extends the opportunity of your TLC. PLEASE DO NOT DISTURB OCCUPANT OF THIS PROPERTY. This is an assignment of contract.
Key facts
- Modern cabinetry
- New flooring
- Granite countertops
Tags
Property features AI
Finance
- Other: Zoned R4; Lot approximately 0.17 acre (75 x 100); One well and one septic on property
- HOA & community: No association indicated
Exterior
- Parking: Paved driveway access
- Utilities: Well water; Septic tank; Cable available; Electricity connected
- Home design: Residential mobile home (single wide); One story; North-facing
- Construction: Metal siding; Other roof; Built as completed (mobile home); Crawlspace foundation
- Exterior features: Covered screened patio; Patio; Shed(s); Workshop; Cleared lot; Paved road
Interior
- Kitchen: Microwave; Refrigerator; Electric water heater
- Bedrooms: 2 bedrooms
- Flooring: Laminate; Crawlspace foundation (interior access noted)
- Bathrooms: 1 full bathroom; 1 half bathroom
- Heating & cooling: Central heating; Ductless heating; Central air conditioning; Wall/window unit(s)
- Interior features: Ceiling fans; Eat-in kitchen; Split bedroom layout; Thermostat; Window treatments; Storm windows; Electric fireplace
- Laundry & utility: Washer; Dryer; Laundry in unit (other)
Neighborhood map
What this means for you Summary
Snapshot
- This is a 2-bed/2.5-bath manufactured listed at $105k.
Deal economics
- At list price, monthly cash flow is $258 ($3k/yr) — positive.
- The deal already cash-flows at list — no discount required.
- Meets the 1% rule at list price ($1k rent vs $105k).
- Recommended offer: $102k (3.0% below list) — sets the bar for market timing.
- Cap rate 9.2% vs local median 4.7% in Silver Springs Shores — top-decile yield for the area; either an underpriced asset or a hidden risk that comps aren't pricing in. Stress-test before assuming the spread holds.
Location & tenants
- Location reads 68/100 on livability (#527 in FL) — a middle-class / working-renter tenant base. Strengths: cost of living A+, housing A+, health & safety A-; Watch: crime C-, employment D, amenities F.
- Marion (rural): math 42% / reading 43% proficiency, ranked #61 of 73 in FL (top 84%) — families likely to look elsewhere, expect single-tenant / working-renter base with shorter leases; 61% free/reduced lunch — lower-income household profile, screen leases tightly.
- Zoned schools: Emerald Shores Elementary School (math 30% / reading 34%, grade F, #1,797 of 2,144 statewide, top 86%, 666 students, 74% FRL); Lake Weir High School (math 23% / reading 34%, grade F, #458 of 667 statewide, top 69%, 1,483 students, 68% FRL).
- Zoned-school proficiency averages 30% at this address vs 42% district-wide (-12 pts) — the specific schools serving this property underperform the Marion average; the district grade overstates school quality for this exact location.
- Market conditions: 357 active listings in the ZIP; 1 comparable units currently listed for rent nearby; 7,071 units permitted in Marion County in 2024 (534 in 5+ unit buildings).
Forward outlook
- Local home prices are declining (-3.0%/yr); year-one equity from $726 of loan paydown is wiped out by about $3k of value loss. Plan a longer hold.
- Marion County population projected at +13% by 2050 — modest demand growth; plan on rents tracking national, not racing it.
Negotiation context
- It's been on market 34 days — a 3% lower offer ($102k) is reasonable based on typical stale-listing flexibility.
- 2 sale attempts since 2y ago with the ask held roughly flat each time — persistent listings suggest the price (not the market) is what's stuck; bring a comps-based counter.
- Current owner paid $54k; list at $105k implies a 96% gain — meaningful room to come down on a strong offer.
Risks & watch-outs
- Climate carrying-cost: severe wind risk, 99% chance of damaging wind over 30y; moderate wildfire risk; extreme-heat days projected 7→21/yr by 2055 (HVAC capex compounding) — expect insurance premiums to compound above CPI over the hold.
Questions for the listing agent
- It's been on market 34 days. Have you received any prior offers? Is the seller open to a 3% concession, seller financing, or rate buy-down credit?
- Built in 1973 — when were the roof, HVAC, electrical panel, plumbing, and water heater last replaced?
- Is there a deadline driving the sale (1031 exchange, divorce, estate, relocation)? That informs how much negotiation room exists.
- Schools are F-rated, which usually means shorter tenancies and higher turnover. Who's the typical renter profile here, and what's been the actual vacancy rate?
- What's the average days-on-market for RENTAL listings here right now (not sales)? A rising rental-DOM trend means longer vacancies and softer asking-rent achievability than the comps imply.
- What's the recent tenant-quality profile in this submarket — average credit score on applications, eviction rate, late-payment / NSF rate, and stable-employment percentage? A property-management company in the area should have these aggregated.
- How much new for-sale + rental construction is in the pipeline within 1–3 miles? Heavy new supply typically softens prices + rents 12–24 months out; constrained supply supports both.
Investment metrics
- 1% rule
- 1.14% ✓
- Cap rate
- 9.24%
- Cash-on-cash
- 10.52%
- DSCR
- 1.47
- GRM
- 7.3
CMA / ARV
- ARV (median comp)
- $50,000
- List price
- $105,000
- Delta
- 110.00%
- Verdict
- OVERPRICED
- Comps
- 3 within 2.0 mi
Projected returns pro-forma
-3.0% appreciation · 3.0% rent growth · sell at horizon
- IRR
- -0.5%
- Equity multiple
- 0.98×
- Total profit
- $-605
- Equity at exit
- $15,656
- IRR
- 9.1%
- Equity multiple
- 1.70×
- Total profit
- $20,586
- Equity at exit
- $9,078
Cash invested: $29,400 (down + closing). Projections, not guarantees.
Landlord ↔ Tenant lean methodology
- Overall (STATE)
- 87 Strongly Landlord-Friendly
- State Florida
- 87 Strongly Landlord-Friendly · R+3
- County
- — inherits STATE
- City
- — inherits STATE
ZIP-level market 34420
- Home prices YoY
- -32.8%
- Active inventory
- 357
- Price-to-rent
- 7.3×
Monthly cashflow live
- Estimated rent
- $1,195 medium interval (Pro) →
- Mortgage (P&I)
- −$551
- Tax from tax record
- −$92 /mo · $1,103/yr
- Insurance
- −$44
- HOA
- −$0
- Vacancy / Maint / Mgmt
- −$251
- Net cashflow
- $258
Break-even live
Sensitivity live
| Price | -10% $317 | -5% $287 | +0% $258 | +5% $228 | +10% $198 |
|---|---|---|---|---|---|
| Rent | -10% $163 | -5% $211 | +0% $258 | +5% $305 | +10% $352 |
| Rate | -1.0pp $311 | -0.5pp $284 | base $258 | +0.5pp $231 | +1.0pp $203 |
UW: 25.0% down · 7.5% · 30yr · 1.5% tax · 5.0% vac · 8.0% maint · 8.0% mgmt
Financing live
Cash to close
- Down payment
- $26,250
- Closing costs
- $3,150
- Reserves months
- —
- Total cash needed
- —
Loan-product check · same deal, 3 products live
Conventional
25% down · 7.5% · 30yr
- Down + closing
- —
- Monthly P&I
- —
- Monthly cashflow
- —
- DSCR
- —
- Eligible?
- —
Personal DTI + credit; lowest rate.
DSCR
20% down · 8.5% · 30yr
- Down + closing
- —
- Monthly P&I
- —
- Monthly cashflow
- —
- DSCR
- —
- Eligible?
- —
No personal income docs; deal must DSCR.
Hard money
10% down · 12.0% · 12mo
- Down + closing
- —
- Monthly P&I
- —
- Monthly cashflow
- —
- DSCR
- —
- Eligible?
- —
Short-term bridge; refi at stabilization.
Rent comps 1 comps
| Address | Beds | Baths | Sqft | Rent | $/sqft | DOM | Units | Dist |
|---|---|---|---|---|---|---|---|---|
| 11709 SE 99th Ct Belleview, FL | 2.0 | 1.0 | 720 | $1,195 | $1.66 | 14d | 1 | 0.15mi |
Listing history 21 events
-
2026-06-18days on market $105,000 Active 34 DOM
-
2026-06-17days on market $105,000 Active 33 DOM
-
2026-06-16days on market $105,000 Active 32 DOM
-
2026-06-15days on market $105,000 Active 31 DOM
-
2026-06-14days on market $105,000 Active 29 DOM
-
2026-06-13days on market $105,000 Active 28 DOM
-
2026-06-10days on market $105,000 Active 26 DOM
-
2026-06-09days on market $105,000 Active 25 DOM
-
2026-06-08days on market $105,000 Active 24 DOM
-
2026-06-07days on market $105,000 Active 23 DOM
-
2026-06-03days on market $105,000 Active 19 DOM
-
2026-06-02days on market $105,000 Active 18 DOM
-
2026-06-01days on market $105,000 Active 17 DOM
-
2026-05-31days on market $105,000 Active 16 DOM
-
2026-05-30days on market $105,000 Active 15 DOM
-
2026-05-15$105,000 Active 852-char remark
-
2024-06-28soldstatus $53,500 Closed 210-char remark
Show marketing remark (210 chars)
Priced to sell! Great Investment property and a great chance to get a deal on a home that extends the opportunity of your TLC. PLEASE DO NOT DISTURB OCCUPANT OF THIS PROPERTY. This is an assignment of contract.
-
2024-05-15status Pending 210-char remark
Show marketing remark (210 chars)
Priced to sell! Great Investment property and a great chance to get a deal on a home that extends the opportunity of your TLC. PLEASE DO NOT DISTURB OCCUPANT OF THIS PROPERTY. This is an assignment of contract.
-
2024-05-07price $53,500 210-char remark
Show marketing remark (210 chars)
Priced to sell! Great Investment property and a great chance to get a deal on a home that extends the opportunity of your TLC. PLEASE DO NOT DISTURB OCCUPANT OF THIS PROPERTY. This is an assignment of contract.
-
2024-05-03$59,000 Active 210-char remark
Show marketing remark (210 chars)
Priced to sell! Great Investment property and a great chance to get a deal on a home that extends the opportunity of your TLC. PLEASE DO NOT DISTURB OCCUPANT OF THIS PROPERTY. This is an assignment of contract.
-
1984-05-01soldstatus $17,000
ⓘ Source: listings_history table (triggers on properties + properties_extension) + one-shot
backfill from property_details.listing_events for pre-trigger history.
Tax reassessment forecast FL · Resets to sale price
- Current annual tax
- $1,103 · $92/mo
- Projected year-2 tax
- $1,103 · $92/mo
- Expected delta
- $0/yr ($0/mo · 0.0%)
ⓘ Screening estimate from a state-policy table — verify with the county assessor before closing.
Climate risk First Street
- Flood 1/10 Low FEMA zone X (unshaded) · 0% chance over 30 yrs
- Wildfire 5/10 Major
- Heat 8/10 Severe 7 d/yr ≥109°F today · 21 d/yr by 30 yrs out
- Wind 9/10 Extreme 99% chance of damaging wind over 30 yrs
- Air quality 3/10 Moderate 3 unhealthy d/yr today · 4 by 30 yrs out
Nearby sold comps map
Loading sold comps map…
Walkable amenities ~0.75 mi
Loading nearby amenities…
Taxation est. · year 1
- Rental income
- $14,340
- − Mortgage interest
- −$5,882
- − Property taxes
- −$1,103
- − Insurance
- −$525
- − Repairs & maintenance
- −$1,147
- − Management
- −$1,147
- − Depreciation
- −$3,055
- Taxable income
- $1,481
- Est. tax owed @ 24.0%
- −$356
- After-tax cash flow
- $2,737/yr
For passive investors: Depreciation is non-cash, so a rental often shows a tax loss while cash-flowing — sheltering income. Rental losses are passive: they offset passive income freely, and up to $25,000/yr can offset ordinary (W-2) income if you actively participate and your MAGI is under $100k (phasing out to $0 by $150k); unused losses carry forward. On sale, claimed depreciation is recaptured at up to 25%, and gains may owe capital-gains tax (a 1031 exchange can defer both). Figures are a year-1 estimate at your 24.0% rate — not tax advice; consult a CPA.
Schools (NCES district)
- District
- Marion
- NCES district ID
- 1201260
- Math proficiency
- 42% ▼ -7.00%
- Reading proficiency
- 43% ▼ -4.00%
- Median HH income
- $40,015
- Composite
- 35.61/100
- National rank
- #4890
- State rank
- #61 of 73 in FL
Livability — Silver Springs Shores
- Score
- 68/100
- State rank
- #527
- US rank
- #9854
Category grades
Schools grade is shown separately in the Schools card above.
Census & demographics
- City population
- 34,665
- Population (ZIP)
- 19,167
Population outlook (Marion County) Hauer SSP2
- Today (2025)
- 365,905 people
- By 2030
- 376,768 · +3.0%
- By 2040
- 396,555 · +8.4%
- By 2050
- 412,723 · +12.8%
- By 2075
- 446,090 · +21.9%
- By 2100
- 436,193 · +19.2%
Race, ethnicity, and origin ACS 2023
- Neighborhood character
- Predominantly White (81%)
- Race & ethnicity
- White 81% Hispanic / Latino 12% Two or more races 10% Black 1%
- Hispanic origin (detail)
- Puerto Rican 7% Cuban 2%
- Common ancestry
- Lithuanian 4% Iranian 2% Romanian 2%
- Foreign-born
- 5% · Canada, Jamaica
- Languages at home
- 89% English-only · Spanish 7% Other Indo-European 2% German/W. Germanic 1%
Political lean MEDSL · Marion
- 2024 margin
- Solid R (+31.6) · D 33.8% · R 65.5%
- 2008→2024 swing
- -20.0pp toward R · 2008: -11.6pp · 2024: -31.6pp
- All cycles
- 2024: R+31.6 2020: R+25.9 2016: R+26.2 2012: R+16.2 2008: R+11.6
Not yet ingested
- Civics
- —
Market trends
- HPI YoY
- ▼ -120.90%
- Current HPI
- 247.3176
- Rent YoY
- —
- Metro
- —
- State GDP YoY
- ▲ 3.28%
- F500 in state
- 36
Industry mix (Fortune 500 HQ in FL)
| Industry | F500 HQs | Revenue |
|---|---|---|
| Industrial Technology | 2 | $29B |
|
||
| Insurance | 2 | $17B |
|
||
| Retail | 1 | $60B |
|
||
| Technology Distribution | 1 | $58B |
|
||
| Homebuilding | 1 | $35B |
|
||
| Technology Manufacturing | 1 | $35B |
|
||
Price history
+517.6% since first listed6 events — show timeline
- 2026-05-15 Listed $105,000 Stellar MLS as Distributed by MLS Grid
- 2024-06-28 Sold (MLS) $53,500 Stellar MLS as Distributed by MLS Grid
- 2024-05-15 Pending — Stellar MLS as Distributed by MLS Grid
- 2024-05-07 Price Changed $53,500 Stellar MLS as Distributed by MLS Grid
- 2024-05-03 Listed $59,000 Stellar MLS as Distributed by MLS Grid
- 1984-05-01 Sold (Public Records) $17,000 Public Records
Property tax history
+13.8%/yrLatest (2025): $1,103 · +265.4% YoY. Source: county tax records.
Cash-flow waterfall
monthlySold comps — $/sqft
last 12 mo · ≤1 miLoading sold comps…