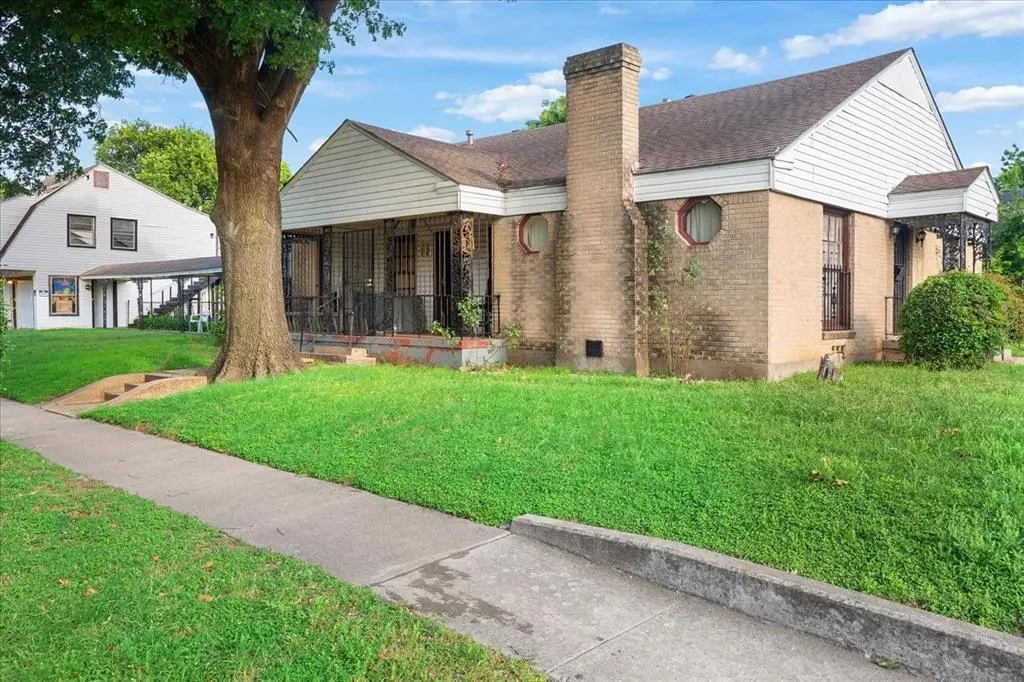
1718 S Marsalis Ave · Dallas, TX
Flood risk 1/10 · Minimal
- FEMA flood zone
- X (unshaded)
- Chance of flooding over 30 yrs
- 0.0%
- Est. flood insurance / yr
- $507 – $1,088
Fire risk 1/10 · Minimal
- Est. fire insurance / yr
- $1,222 – $2,270
Heat risk 7/10 · Major
- Hot days now (above 110°F)
- 7 days/yr
- Hot days in 30 yrs
- 24 days/yr
Wind risk 6/10 · Moderate
- Chance of severe wind over 30 yrs
- 27.0%
Air-quality risk 2/10 · Minimal
- Unhealthy air days now
- 1 days/yr
- Unhealthy air days in 30 yrs
- 2 days/yr
Risk factors via First Street. Map © Google.
Why this score? — see what drove the B- grade
The composite is a weighted blend of 9 inputs, each scored 0–100. Each bar is that input's sub-score; the figure is the points it added to the 100-point composite (weight × sub-score).
- Cash flow +26.6/30.0
- 1% rule +10.0/10.0
- DSCR +9.1/10.0
- ARV discount +7.5/15.0
- Livability +4.0/5.0
- Rent growth +3.6/5.0
- Schools +2.8/10.0
- Condition / age +2.5/5.0
- Appreciation +0.0/10.0
$165,000
🖨 Deal sheet 📄 Offer letter ✓ Due diligence
Listing remarks
Just minutes from Bishop Arts District, This investor special has SO much potential. Previously used as a boarding house, this property features an attached unit with a total of 6 bedrooms and 4 bathrooms and no HOA. Whether you’re looking for a rental opportunity, rooming house setup, AIRBNB, or your next value-add project… this one has options written all over it. Deals like this do not last long. Investors know it’s all about buying the right opportunity and adding the vision later. Move fast before its gone.
Key facts
- Value-add project
- Attached unit
- Rental opportunity
Tags
Property features AI
Finance
- Financial info: Accepts cash and conventional financing
- HOA & community: No association
Exterior
- Parking: Driveway (no garage, no carport, no covered spaces listed)
- Security: Burglar alarm/security
- Utilities: City water; City sewer; Not in a municipal utility district
- Home design: Single family residence; Residential property; Two levels; Accessible approach with ramp; Property is attached
- Construction: Brick construction; Shingle roof; Slab foundation; Built in 1939 (preowned)
- Exterior features: Covered patio/porch; Built-in barbecue; Chain link fencing; Corner lot
Interior
- Kitchen: Dishwasher; Eat-in kitchen
- Bedrooms: 6 bedrooms (primary bedroom on level 1; additional bedrooms on levels 1 and 2)
- Flooring: Laminate floors
- Bathrooms: 3 full bathrooms; 1 half bathroom
- Heating & cooling: Central heating (electric); Central air (electric)
- Interior features: Eat-in kitchen; 3 living areas; 15 total rooms
- Laundry & utility: Utility room
Neighborhood map
What this means for you Summary
Snapshot
- This is a 3-bed/1.0-bath single-family listed at $165k.
Deal economics
- At list price, monthly cash flow is $441 ($5k/yr) — positive.
- The deal already cash-flows at list — no discount required.
- Meets the 1% rule at list price ($3k rent vs $165k).
- Cap rate 9.5% vs local median 2.3% in Dallas — top-decile yield for the area; either an underpriced asset or a hidden risk that comps aren't pricing in. Stress-test before assuming the spread holds.
Location & tenants
- Location reads 81/100 on livability (#24 in TX, #1,380 nationally) — a professional / high-income tenant draw. Strengths: amenities A+, commute A+, housing A+; Watch: crime F.
- Dallas ISD (urban): math 31% / reading 36% proficiency, ranked #559 of 826 in TX (top 68%) — families likely to look elsewhere, expect single-tenant / working-renter base with shorter leases; 83% free/reduced lunch — lower-income household profile, screen leases tightly.
- Zoned schools: Cedar Crest El (math 52% / reading 37%, grade F, #1,155 of 4,322 statewide, top 29%, 321 students, 100% FRL) — zoned schools average 100% FRL vs 83% district-wide (16 pts higher); higher-poverty schools than district average — tighter screening recommended.
- Market conditions: Rents rising fast (+4.2%/yr); 249 active listings in the ZIP; 26 comparable units currently listed for rent nearby; rentals lingering (median 44d on market — plan ~5-8 weeks vacancy on turnover, expect pricing pressure); 58% of comp listings sitting > 30 days — soft ceiling on asking rent; lower-income renter base — watch delinquency; 12,577 units permitted in Dallas County in 2024 (6,829 in 5+ unit buildings).
- At $2,543/mo this rent would consume 74% of the median local household income ($41k/yr) (locally 2465% of renters already pay >50% of income on rent) — very limited rent-growth headroom before tenants either downsize or default.
Forward outlook
- Local home prices are declining (-3.0%/yr); year-one equity from $1k of loan paydown is wiped out by about $5k of value loss. Plan a longer hold.
- Dallas County population projected at +35% by 2050 — long-run rental-demand tailwind backs the buy-and-hold thesis.
- At projected returns (-3.0% appreciation + 4.2% rent growth), your $46k cash investment doubles in ~9 years — after that, you're playing with house money.
Negotiation context
- Only 2 days on market — expect competitive offers; lowballing is unlikely to land.
- Current owner paid $95k; list at $165k implies a 74% gain — meaningful room to come down on a strong offer.
Risks & watch-outs
- Watch-outs: property tax is 4.6% of price; built in 1939 — expect roof / HVAC / electrical / plumbing capex.
- Climate carrying-cost: major wind risk, 27% chance of damaging wind over 30y; extreme-heat days projected 7→24/yr by 2055 (HVAC capex compounding) — expect insurance premiums to compound above CPI over the hold.
Questions for the listing agent
- Built in 1939 — when were the roof, HVAC, electrical panel, plumbing, and water heater last replaced?
- Property tax is high relative to price — has the assessment been appealed recently, and will the sale trigger a re-assessment?
- Is there a deadline driving the sale (1031 exchange, divorce, estate, relocation)? That informs how much negotiation room exists.
- Crime grade is F in this area — have there been break-ins, vandalism, or insurance claims at this property in the last 3 years? What carrier currently insures it and at what premium?
- What's the average days-on-market for RENTAL listings here right now (not sales)? A rising rental-DOM trend means longer vacancies and softer asking-rent achievability than the comps imply.
- What's the recent tenant-quality profile in this submarket — average credit score on applications, eviction rate, late-payment / NSF rate, and stable-employment percentage? A property-management company in the area should have these aggregated.
- How much new for-sale + rental construction is in the pipeline within 1–3 miles? Heavy new supply typically softens prices + rents 12–24 months out; constrained supply supports both.
Investment metrics
- 1% rule
- 1.54% ✓
- Cap rate
- 9.50%
- Cash-on-cash
- 11.44%
- DSCR
- 1.51
- GRM
- 5.4
CMA / ARV
- ARV (on-the-fly)
- $431,244
- Comps found
- 12
Show comp detail 12 sales within ~0.75 mi
| Address | Dist | Beds/Ba | Sqft | Sold | Price | $/sf | Match |
|---|---|---|---|---|---|---|---|
| 509 Edgemont Ave | 0.23mi | 3/2.5 | 2,186 (+0%) | 3mo | $369,000 | $169 | 80 |
| 1801 Michigan Ave | 0.19mi | 4/2.0 (+1) | 2,262 (+4%) | 2mo | $220,000 | $97 | 74 |
| 1503 E Lakeview Dr | 0.36mi | 4/3.5 (+1) | 2,139 (-2%) | 1mo | $455,000 | $213 | 65 |
| 1505 Arizona Ave | 0.29mi | 2/2.0 (-1) | 1,921 (-12%) | 0mo | $399,500 | $208 | 58 |
| 916 E Louisiana Ave | 0.27mi | 3/3.5 | 2,417 (+11%) | 2mo | $479,000 | $198 | 57 |
| 1527 S Denley Dr | 0.50mi | 4/2.0 (+1) | 2,139 (-2%) | 10mo | $369,000 | $173 | 56 |
| 1343 Fernwood Ave | 0.42mi | 3/2.0 | 2,021 (-7%) | 10mo | $299,900 | $148 | 56 |
| 1019 E Waco Ave | 0.68mi | 4/2.0 (+1) | 2,190 (+1%) | 4mo | $369,000 | $168 | 55 |
| 1003 Forester Dr | 0.62mi | 3/3.0 | 2,152 (-1%) | 12mo | $469,000 | $218 | 51 |
| 911 18th St | 0.60mi | 4/2.0 (+1) | 1,926 (-12%) | 7mo | $399,000 | $207 | 38 |
| 1315 Renner Dr | 0.68mi | 4/2.0 (+1) | 1,954 (-10%) | 11mo | $389,500 | $199 | 33 |
| 2607 Alaska Ave | 0.73mi | 4/3.0 (+1) | 1,955 (-10%) | 9mo | $275,000 | $141 | 28 |
Match score weights: distance 35% · size 25% · config 20% · recency 20%. Top-matched comps best support the ARV.
Projected returns pro-forma
-3.0% appreciation · 4.2% rent growth · sell at horizon
- IRR
- 2.6%
- Equity multiple
- 1.10×
- Total profit
- $4,731
- Equity at exit
- $24,602
- IRR
- 13.7%
- Equity multiple
- 2.18×
- Total profit
- $54,541
- Equity at exit
- $14,266
Cash invested: $46,200 (down + closing). Projections, not guarantees.
Landlord ↔ Tenant lean methodology
- Overall (STATE)
- 87 Strongly Landlord-Friendly
- State Texas
- 87 Strongly Landlord-Friendly · R+5
- County
- — inherits STATE
- City
- — inherits STATE
ZIP-level market 75216
- Home prices YoY
- -29.7%
- Rents YoY
- 4.2%
- Active inventory
- 249
- Price-to-rent
- 5.4×
Monthly cashflow live
- Estimated rent
- $2,543 high interval (Pro) →
- Mortgage (P&I)
- −$865
- Tax from tax record
- −$634 /mo · $7,614/yr
- Insurance
- −$69
- HOA
- −$0
- Vacancy / Maint / Mgmt
- −$534
- Net cashflow
- $441
Break-even live
UW: 25.0% down · 7.5% · 30yr · 1.5% tax · 5.0% vac · 8.0% maint · 8.0% mgmt
Financing live
Cash to close
- Down payment
- $41,250
- Closing costs
- $4,950
- Reserves months
- —
- Total cash needed
- —
Loan-product check · same deal, 3 products live
Conventional
25% down · 7.5% · 30yr
- Down + closing
- —
- Monthly P&I
- —
- Monthly cashflow
- —
- DSCR
- —
- Eligible?
- —
Personal DTI + credit; lowest rate.
DSCR
20% down · 8.5% · 30yr
- Down + closing
- —
- Monthly P&I
- —
- Monthly cashflow
- —
- DSCR
- —
- Eligible?
- —
No personal income docs; deal must DSCR.
Hard money
10% down · 12.0% · 12mo
- Down + closing
- —
- Monthly P&I
- —
- Monthly cashflow
- —
- DSCR
- —
- Eligible?
- —
Short-term bridge; refi at stabilization.
Rent comps 26 comps
| Address | Beds | Baths | Sqft | Rent | $/sqft | DOM | Units | Dist |
|---|---|---|---|---|---|---|---|---|
| 1810 Ramsey Ave Dallas, TX | 3.0 | 2.0 | 1546 | $2,350 | $1.52 | 43d | 1 | 0.37mi |
| 1731 Seevers Ave Dallas, TX | 3.0 | 2.0 | 1980 | $2,480 | $1.25 | 43d | 1 | 0.46mi |
| 2126 Ramsey Ave Dallas, TX | 4.0 | 1.5 | 1416 | $2,300 | $1.62 | 43d | 1 | 0.51mi |
| 2123 Ramsey Ave Dallas, TX | 4.0 | 2.0 | 1727 | $2,999 | $1.74 | 24d | 1 | 0.53mi |
| 1131 Forester Dr Dallas, TX | 4.0 | 3.0 | 1866 | $2,600 | $1.39 | 43d | 1 | 0.65mi |
| 2611 Fernwood Ave Dallas, TX | 3.0 | 2.0 | 1528 | $2,000 | $1.31 | 24d | 1 | 0.80mi |
| 850 S Ewing Ave Dallas, TX | 1.0–2.0 | 1.0–2.5 | 1086 | $2,450 | $2.25 | 3d | 2 | 0.89mi |
| 1322 Strickland St Dallas, TX | 4.0 | 2.0 | 2053 | $3,299 | $1.61 | 7d | 1 | 0.89mi |
| 1406 Galloway Ave Dallas, TX | 4.0 | 2.0 | 1506 | $1,975 | $1.31 | 43d | 1 | 0.92mi |
| 314 W Clarendon Dr Dallas, TX | 4.0 | 2.0 | 2096 | $1,900 | $0.91 | 43d | 1 | 0.93mi |
| 217 W Yarmouth St Dallas, TX | 3.0 | 2.5 | 2155 | $3,500 | $1.62 | 43d | 1 | 0.98mi |
| 1339 Hendricks Ave Dallas, TX | 3.0 | 3.0 | 2152 | $4,000 | $1.86 | 43d | 1 | 0.98mi |
| 219 W Yarmouth St Dallas, TX | 3.0 | 2.5 | 2155 | $3,500 | $1.62 | 43d | 1 | 0.99mi |
| 2830 S Marsalis Ave Dallas, TX | 4.0 | 2.0 | 1960 | $3,000 | $1.53 | 43d | 1 | 1.03mi |
| 1835 Norfolk Ave Dallas, TX | 3.0 | 2.0 | 1666 | $2,200 | $1.32 | 24d | 1 | 1.03mi |
| 1835 Norfolk Ave Dallas, TX | 3.0 | 2.0 | 1666 | $2,200 | $1.32 | 43d | 1 | 1.03mi |
| 2842 S Marsalis Ave Dallas, TX | 3.0 | 3.5 | 1788 | $2,300 | $1.29 | 43d | 1 | 1.06mi |
| 2844 S Marsalis Ave Dallas, TX | 3.0 | 3.5 | 1788 | $2,300 | $1.29 | 43d | 1 | 1.06mi |
| 1218 Grant St Dallas, TX | 3.0 | 2.5 | 2057 | $2,699 | $1.31 | 24d | 1 | 1.06mi |
| 1218 Grant St Dallas, TX | 3.0 | 2.5 | 2057 | $2,699 | $1.31 | 21d | 1 | 1.06mi |
| 200 E 12th St Dallas, TX | 2.0 | 1.0 | 1932 | $1,500 | $0.78 | 43d | 1 | 1.14mi |
| 1422 Claude St Dallas, TX | 4.0 | 2.0 | 2016 | $2,411 | $1.20 | 43d | 1 | 1.16mi |
| 2701 Easter Ave Dallas, TX | 3.0 | 2.0 | 1632 | $2,200 | $1.35 | 4d | 1 | 1.27mi |
| 1917 S Vernon Ave Dallas, TX | 4.0 | 2.0 | 2340 | $3,199 | $1.37 | 5d | 1 | 1.35mi |
| 1525 Doyle Ave Dallas, TX | 4.0 | 2.0 | 1710 | $7,750 | $4.53 | 7d | 1 | 1.39mi |
| 441 Avenue A Unit 1019524P Dallas, TX | 4.0 | 2.0 | 1700 | $9,762 | $5.74 | 21d | 1 | 1.40mi |
Listing history 4 events
-
2026-05-20status Pending
-
2026-05-18$165,000 Active
-
2006-03-23soldstatus $95,000
-
2003-02-14soldstatus
ⓘ Source: listings_history table (triggers on properties + properties_extension) + one-shot
backfill from property_details.listing_events for pre-trigger history.
Tax reassessment forecast TX · Resets to sale price
- Current annual tax
- $7,614 · $634/mo
- Projected year-2 tax
- $7,614 · $634/mo
- Expected delta
- $0/yr ($0/mo · 0.0%)
ⓘ Screening estimate from a state-policy table — verify with the county assessor before closing.
Climate risk First Street
- Flood 1/10 Low FEMA zone X (unshaded) · 0% chance over 30 yrs
- Wildfire 1/10 Low
- Heat 7/10 Severe 7 d/yr ≥110°F today · 24 d/yr by 30 yrs out
- Wind 6/10 Major 27% chance of damaging wind over 30 yrs
- Air quality 2/10 Low 1 unhealthy d/yr today · 2 by 30 yrs out
Nearby sold comps map
Loading sold comps map…
Walkable amenities ~0.75 mi
Loading nearby amenities…
Taxation est. · year 1
- Rental income
- $30,517
- − Mortgage interest
- −$9,243
- − Property taxes
- −$7,614
- − Insurance
- −$825
- − Repairs & maintenance
- −$2,441
- − Management
- −$2,441
- − Depreciation
- −$4,800
- Taxable income
- $3,153
- Est. tax owed @ 24.0%
- −$757
- After-tax cash flow
- $4,530/yr
For passive investors: Depreciation is non-cash, so a rental often shows a tax loss while cash-flowing — sheltering income. Rental losses are passive: they offset passive income freely, and up to $25,000/yr can offset ordinary (W-2) income if you actively participate and your MAGI is under $100k (phasing out to $0 by $150k); unused losses carry forward. On sale, claimed depreciation is recaptured at up to 25%, and gains may owe capital-gains tax (a 1031 exchange can defer both). Figures are a year-1 estimate at your 24.0% rate — not tax advice; consult a CPA.
Schools (NCES district)
- District
- Dallas ISD
- NCES district ID
- 4816230
- Math proficiency
- 31% ▼ -16.00%
- Reading proficiency
- 36% ▼ -4.00%
- Median HH income
- $42,881
- Composite
- 28.41/100
- National rank
- #6763
- State rank
- #559 of 826 in TX
Livability — Dallas
- Score
- 81/100
- State rank
- #24
- US rank
- #1380
Category grades
Schools grade is shown separately in the Schools card above.
Census & demographics
- Census place
- Dallas, TX
- County
- Dallas County · 2,612,404 people
- City population
- 1,168,437
- Metro
- Dallas-Fort Worth-Arlington, TX
- Population (ZIP)
- 55,894
- Household income
- $41,386
- Rent vs Own
- Severe rent burden
- 2465.0
Population outlook (Dallas County) Hauer SSP2
- Today (2025)
- 2,979,839 people
- By 2030
- 3,191,823 · +7.1%
- By 2040
- 3,619,611 · +21.5%
- By 2050
- 4,026,915 · +35.1%
- By 2075
- 4,957,073 · +66.4%
- By 2100
- 5,508,725 · +84.9%
Race, ethnicity, and origin ACS 2023
- Neighborhood character
- Majority Black (51%)
- Race & ethnicity
- Black 51% Hispanic / Latino 44% Two or more races 14% White 3%
- Hispanic origin (detail)
- Mexican 40%
- Common ancestry
- Hispanic 1%
- Foreign-born
- 17% · Canada
- Languages at home
- 62% English-only · Spanish 37%
Political lean MEDSL · Dallas
- 2024 margin
- Strong D (+22.2) · D 60.2% · R 38.0% · Other 1.8%
- 2008→2024 swing
- +6.9pp toward D · 2008: 15.3pp · 2024: 22.2pp
- All cycles
- 2024: D+22.2 2020: D+31.6 2016: D+26.2 2012: D+15.4 2008: D+15.3
Not yet ingested
- Civics
- —
Market trends
- HPI YoY
- ▼ -126.35%
- Current HPI
- 299.1825
- Rent YoY
- ▲ 4.20%
- Metro
- Dallas-Fort Worth-Arlington, TX
- State GDP YoY
- ▲ 3.95%
- F500 in state
- 110
Industry mix (Fortune 500 HQ in TX)
| Industry | F500 HQs | Revenue |
|---|---|---|
| Energy | 16 | $1,198B |
|
||
| Technology | 5 | $198B |
|
||
| Engineering / Construction | 4 | $72B |
|
||
| Energy Services | 3 | $60B |
|
||
| Utilities | 3 | $41B |
|
||
| Healthcare | 2 | $330B |
|
||
Price history
+73.7% since first listed4 events — show timeline
- 2026-05-20 Pending — NTREIS
- 2026-05-18 Listed $165,000 NTREIS
- 2006-03-23 Sold (Public Records) $95,000 Public Records
- 2003-02-14 Sold (Public Records) — Public Records
Property tax history
+11.6%/yrLatest (2025): $7,614 · -0.4% YoY. Source: county tax records.
Cash-flow waterfall
monthlySold comps — $/sqft
last 12 mo · ≤1 miLoading sold comps…