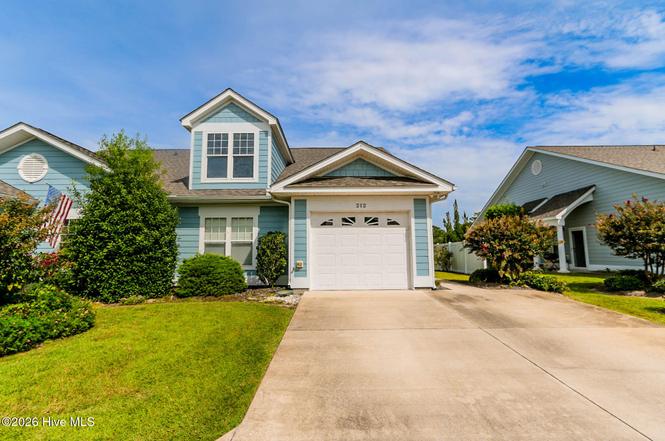
212 Diamond Cv · Newport, NC
Flood risk 8/10 · Major
- FEMA flood zone
- X (unshaded)
- Chance of flooding over 30 yrs
- 0.99%
- Est. flood insurance / yr
- $507 – $1,088
Fire risk 5/10 · Moderate
- Est. fire insurance / yr
- $906 – $1,684
Heat risk 9/10 · Severe
- Hot days now (above 103°F)
- 8 days/yr
- Hot days in 30 yrs
- 23 days/yr
Wind risk 8/10 · Major
- Chance of severe wind over 30 yrs
- 99.0%
Air-quality risk 1/10 · Minimal
- Unhealthy air days now
- 0 days/yr
- Unhealthy air days in 30 yrs
- 0 days/yr
Risk factors via First Street. Map © Google.
Why this score? — see what drove the B grade
The composite is a weighted blend of 9 inputs, each scored 0–100. Each bar is that input's sub-score; the figure is the points it added to the 100-point composite (weight × sub-score).
- Cash flow +30.0/30.0
- 1% rule +10.0/10.0
- DSCR +10.0/10.0
- ARV discount +7.5/15.0
- Schools +5.1/10.0
- Livability +3.2/5.0
- Rent growth +2.5/5.0
- Condition / age +2.5/5.0
- Appreciation +0.0/10.0
$274,900
🖨 Deal sheet 📄 Offer letter ✓ Due diligence
Listing remarks
This beautiful condominium in the highly sought-after ''The Coves at Newport'' gated community is ready for a new owner. It is a one-story home that features three bedrooms, two full bathrooms, and one car garage. This upscale neighborhood provides a community pool, clubhouse, extended (over 85 channels) cable TV, high-speed Internet, maintenance on the exterior buildings, landscaping, and pest control. This condo is an end unit located at the cul-de-sac with very little traffic and extra parking spaces. It has a great outdoor space, a private side yard, and a backyard. It features an open-concept floor plan, a large, sunny living/dining room with vaulted ceilings, and lots of natural light
Key facts
- Gated community
- Clubhouse
- Community pool
Tags
Property features AI
Finance
- Other: Pets allowed; Subdivision: The Coves at Newport; Zoning: PUD; Directions: Hwy 70 to The Coves at Newport, Right on Diamond Cove. The unit is at the end of the street on the right.
- HOA & community: Homeowners association (annual fee); Annual association fee of $6,120 (approximately $510/month); Community pool; Gated community; Maintenance of grounds and structures; Management and meeting room; Clubhouse; Picnic area; Security; Cable TV; Street lights
Exterior
- Parking: Attached garage (garage faces front); 1 total parking space; 1 garage space; Concrete, paved parking; Garage door opener; Assigned and lighted on-site parking
- Security: Fire sprinkler system; Security lights; Smoke detector(s)
- Utilities: Public water; Public sewer; Sewer connected; Water connected; Cable available
- Home design: Duplex; Condominium; One story; Entry on slab foundation
- Construction: Shingle roof; Slab foundation
- Exterior features: Patio; Storm door(s); No fencing; Shingle roof; Cul-de-sac lot; Open lot; Paved road frontage on a private road; Irrigation equipment; Has a view
Interior
- Kitchen: Refrigerator; Dishwasher; Electric range; Microwave; Pantry; Electric water heater
- Bedrooms: Master downstairs
- Flooring: Tile
- Bathrooms: 2 full bathrooms; Accessible full bath
- Heating & cooling: Heat pump heating (electric); Central air conditioning; Heat pump cooling
- Interior features: Master bedroom on the main level; Walk-in closet(s); Vaulted and high ceilings; Entrance foyer; Ceiling fan(s); Pantry; Window coverings; Insulated windows; Unfurnished
- Laundry & utility: Washer hookup; Laundry located in kitchen; Laundry closet
Neighborhood map
What this means for you Summary
Snapshot
- This is a 2-bed/2.0-bath condo listed at $275k.
Deal economics
- At list price, monthly cash flow is $6k ($68k/yr) — positive.
- The deal already cash-flows at list — no discount required.
- Meets the 1% rule at list price ($10k rent vs $275k).
- Recommended offer: $250k (9.0% below list) — sets the bar for market timing.
Location & tenants
- Location reads 63/100 on livability (#385 in NC) — a middle-class / working-renter tenant base. Strengths: cost of living A+, housing A+; Watch: employment C-, amenities F, commute F.
- Carteret County Public Schools (rural): math 59% / reading 61% proficiency, ranked #31 of 178 in NC (top 17%) — acceptable for families but not a draw, mixed tenant base, ~2y average lease.
- Zoned schools: Newport Elementary (math 48% / reading 45%, grade D-, #542 of 1,410 statewide, top 39%, 645 students, 100% FRL); Newport Middle (math 39% / reading 56%, grade C-, #140 of 475 statewide, top 30%, 378 students, 98% FRL); West Carteret High (math 82% / reading 71%, grade A-, #89 of 535 statewide, top 16%, 1,146 students, 40% FRL) — zoned schools average 79% FRL vs 39% district-wide (40 pts higher); higher-poverty schools than district average — tighter screening recommended.
- Market conditions: 216 active listings in the ZIP; 935 units permitted in Carteret County in 2024 (360 in 5+ unit buildings).
- At $10,320/mo this rent would consume 176% of the median local household income ($70k/yr) (locally 461% of renters already pay >50% of income on rent) — very limited rent-growth headroom before tenants either downsize or default.
Forward outlook
- Local home prices are declining (-3.0%/yr); year-one equity from $2k of loan paydown is wiped out by about $8k of value loss. Plan a longer hold.
- Carteret County population projected at +9% by 2050 — modest demand growth; plan on rents tracking national, not racing it.
- At projected returns (-3.0% appreciation + 3.0% rent growth), your $77k cash investment doubles in ~2 years — after that, you're playing with house money.
Negotiation context
- It's been on market 106 days — a 9% lower offer ($250k) is reasonable based on typical stale-listing flexibility.
- 7 sale attempts since 21y ago with the ask held roughly flat each time — persistent listings suggest the price (not the market) is what's stuck; bring a comps-based counter.
- Current owner paid $142k; list at $275k implies a 94% gain — meaningful room to come down on a strong offer.
Risks & watch-outs
- Watch-outs: flood insurance adds $66/mo.
- Climate carrying-cost: severe flood risk; severe wind risk, 99% chance of damaging wind over 30y; moderate wildfire risk; extreme-heat days projected 8→23/yr by 2055 (HVAC capex compounding) — expect insurance premiums to compound above CPI over the hold.
Questions for the listing agent
- It's been on market 106 days. Have you received any prior offers? Is the seller open to a 9% concession, seller financing, or rate buy-down credit?
- What's the actual annual flood-insurance premium (NFIP or private), and is the property in a SFHA with mandatory coverage?
- What does the HOA fee cover, when was the last increase, and are there any pending special assessments or reserve-fund shortfalls?
- Any open or pending special assessments — roof, HVAC, plumbing, elevator, façade? What's the per-unit balance and payoff schedule, and is the seller paying it off at close or rolling it to the buyer?
- Why hasn't it sold? Are there any deal-killer items the seller is aware of (foundation, flood, title, zoning, code violations)?
- Is there a deadline driving the sale (1031 exchange, divorce, estate, relocation)? That informs how much negotiation room exists.
- What's the average days-on-market for RENTAL listings here right now (not sales)? A rising rental-DOM trend means longer vacancies and softer asking-rent achievability than the comps imply.
- What's the recent tenant-quality profile in this submarket — average credit score on applications, eviction rate, late-payment / NSF rate, and stable-employment percentage? A property-management company in the area should have these aggregated.
- How much new apartment / multifamily construction is in the pipeline within 1–3 miles? Heavy new supply (>2% of stock underway) typically softens rents 12–24 months out; light construction supports rent growth.
Investment metrics
- 1% rule
- 3.75% ✓
- Cap rate
- 31.36%
- Cash-on-cash
- 89.54%
- DSCR
- 4.98
- GRM
- 2.2
CMA / ARV
No comps found within radius.
Projected returns pro-forma
-3.0% appreciation · 3.0% rent growth · sell at horizon
- IRR
- 89.2%
- Equity multiple
- 5.13×
- Total profit
- $317,518
- Equity at exit
- $40,988
- IRR
- 92.2%
- Equity multiple
- 10.67×
- Total profit
- $744,119
- Equity at exit
- $23,768
Cash invested: $76,972 (down + closing). Projections, not guarantees.
Landlord ↔ Tenant lean methodology
- Overall (STATE)
- 85 Strongly Landlord-Friendly
- State North Carolina
- 85 Strongly Landlord-Friendly · R+3
- County
- — inherits STATE
- City
- — inherits STATE
ZIP-level market 28570
- Home prices YoY
- -16.2%
- Active inventory
- 216
- Price-to-rent
- 2.2×
Monthly cashflow live
- Estimated rent
- $10,320 medium interval (Pro) →
- Mortgage (P&I)
- −$1,442
- Tax est. 1.5%
- −$344 /mo · $4,124/yr
- Insurance
- −$115
- Flood insurance flood zone
- −$66 /mo · $798/yr
- HOA
- −$510
- Vacancy / Maint / Mgmt
- −$2,167
- Net cashflow
- $5,677
Break-even live
UW: 25.0% down · 7.5% · 30yr · 1.5% tax · 5.0% vac · 8.0% maint · 8.0% mgmt
Financing live
Cash to close
- Down payment
- $68,725
- Closing costs
- $8,247
- Reserves months
- —
- Total cash needed
- —
Loan-product check · same deal, 3 products live
Conventional
25% down · 7.5% · 30yr
- Down + closing
- —
- Monthly P&I
- —
- Monthly cashflow
- —
- DSCR
- —
- Eligible?
- —
Personal DTI + credit; lowest rate.
DSCR
20% down · 8.5% · 30yr
- Down + closing
- —
- Monthly P&I
- —
- Monthly cashflow
- —
- DSCR
- —
- Eligible?
- —
No personal income docs; deal must DSCR.
Hard money
10% down · 12.0% · 12mo
- Down + closing
- —
- Monthly P&I
- —
- Monthly cashflow
- —
- DSCR
- —
- Eligible?
- —
Short-term bridge; refi at stabilization.
HOA detail condo
- Monthly dues
- $510 · $6,120/yr
- Likely covers
- internetcablelandscapingpoolsecurity
- Assessments
- None detected in remarks — confirm with the listing agent.
Listing history 31 events
-
2026-06-19days on market $274,900 Active 106 DOM
-
2026-06-18days on market $274,900 Active 105 DOM
-
2026-06-17days on market $274,900 Active 104 DOM
-
2026-06-17price $274,900 Active 103 DOM
-
2026-06-16days on market $279,900 Active 103 DOM
-
2026-06-15days on market $279,900 Active 102 DOM
-
2026-06-14days on market $279,900 Active 100 DOM
-
2026-06-12days on market $279,900 Active 99 DOM
-
2026-06-09days on market $279,900 Active 96 DOM
-
2026-06-08days on market $279,900 Active 95 DOM
-
2026-06-07days on market $279,900 Active 94 DOM
-
2026-06-05days on market $279,900 Active 91 DOM
-
2026-06-03days on market $279,900 Active 90 DOM
-
2026-06-02days on market $279,900 Active 89 DOM
-
2026-06-01days on market $279,900 Active 88 DOM
-
2026-05-31days on market $279,900 Active 87 DOM
-
2026-05-30days on market $279,900 Active 86 DOM
-
2026-03-26status Active
-
2026-03-26historical
-
2026-03-06status Active
-
2026-03-05$279,900 Active
-
2015-07-31soldstatus $141,500
-
2010-02-17historical
-
2009-09-02$189,900
-
2009-07-31historical
-
2009-04-21soldstatus $922,000
-
2008-09-03$189,900
-
2006-10-25historical
-
2006-07-07$199,000
-
2005-08-29historical
-
2005-07-12$169,900
ⓘ Source: listings_history table (triggers on properties + properties_extension) + one-shot
backfill from property_details.listing_events for pre-trigger history.
Climate risk First Street
- Flood 8/10 Severe FEMA zone X (unshaded) · 99% chance over 30 yrs
- Wildfire 5/10 Major
- Heat 9/10 Extreme 8 d/yr ≥103°F today · 23 d/yr by 30 yrs out
- Wind 8/10 Severe 99% chance of damaging wind over 30 yrs
- Air quality 1/10 Low 0 unhealthy d/yr today · 0 by 30 yrs out
Nearby sold comps map
Loading sold comps map…
Walkable amenities ~0.75 mi
Loading nearby amenities…
Taxation est. · year 1
- Rental income
- $123,842
- − Mortgage interest
- −$15,399
- − Property taxes
- −$4,124
- − Insurance
- −$2,172
- − Repairs & maintenance
- −$9,907
- − Management
- −$9,907
- − HOA
- −$6,120
- − Depreciation
- −$7,997
- Taxable income
- $68,216
- Est. tax owed @ 24.0%
- −$16,372
- After-tax cash flow
- $51,749/yr
For passive investors: Depreciation is non-cash, so a rental often shows a tax loss while cash-flowing — sheltering income. Rental losses are passive: they offset passive income freely, and up to $25,000/yr can offset ordinary (W-2) income if you actively participate and your MAGI is under $100k (phasing out to $0 by $150k); unused losses carry forward. On sale, claimed depreciation is recaptured at up to 25%, and gains may owe capital-gains tax (a 1031 exchange can defer both). Figures are a year-1 estimate at your 24.0% rate — not tax advice; consult a CPA.
Schools (NCES district)
- District
- Carteret County Public Schools
- NCES district ID
- 3700630
- Math proficiency
- 59% ▲ 5.00%
- Reading proficiency
- 61% ▲ 2.00%
- Median HH income
- $48,330
- Composite
- 50.92/100
- National rank
- #1786
- State rank
- #31 of 178 in NC
Livability — Newport
- Score
- 63/100
- State rank
- #385
- US rank
- #15094
Category grades
Schools grade is shown separately in the Schools card above.
Census & demographics
- Census place
- Newport, NC
- County
- Carteret County · 52,389 people
- City population
- 22,197
- Metro
- Morehead City, NC
- Population (ZIP)
- 22,197
- Household income
- $70,229
- Rent vs Own
- Severe rent burden
- 461.0
Population outlook (Carteret County) Hauer SSP2
- Today (2025)
- 73,443 people
- By 2030
- 75,344 · +2.6%
- By 2040
- 78,142 · +6.4%
- By 2050
- 80,091 · +9.1%
- By 2075
- 86,120 · +17.3%
- By 2100
- 89,408 · +21.7%
Race, ethnicity, and origin ACS 2023
- Neighborhood character
- Predominantly White (82%)
- Race & ethnicity
- White 82% Hispanic / Latino 7% Two or more races 6% Black 3% Asian 1%
- Hispanic origin (detail)
- Mexican 4%
- Common ancestry
- Slovak 3% Romanian 3% Lithuanian 2%
- Foreign-born
- 5% · Canada, Dominican Republic
- Languages at home
- 92% English-only · Spanish 6% German/W. Germanic 1%
Political lean MEDSL · Carteret
- 2024 margin
- Solid R (+43.1) · D 28.0% · R 71.1%
- 2008→2024 swing
- -8.4pp toward R · 2008: -34.7pp · 2024: -43.1pp
- All cycles
- 2024: R+43.1 2020: R+42.0 2016: R+44.5 2012: R+41.0 2008: R+34.7
Not yet ingested
- Civics
- —
Market trends
- HPI YoY
- ▼ -53.54%
- Current HPI
- 276.6589
- Rent YoY
- —
- Metro
- Morehead City, NC
- State GDP YoY
- ▲ 3.28%
- F500 in state
- 26
Industry mix (Fortune 500 HQ in NC)
| Industry | F500 HQs | Revenue |
|---|---|---|
| Financial Services | 2 | $213B |
|
||
| Retail | 2 | $95B |
|
||
| Industrial Conglomerate | 1 | $38B |
|
||
| Metals / Steel | 1 | $35B |
|
||
| Utilities | 1 | $30B |
|
||
| Industrial Machinery | 1 | $19B |
|
||
Price history
+64.7% since first listed14 events — show timeline
- 2026-03-26 Relisted — Hive MLS
- 2026-03-26 Listing Removed — Hive MLS
- 2026-03-06 Relisted — Hive MLS
- 2026-03-05 Listed $279,900 Hive MLS
- 2015-07-31 Sold (Public Records) $141,500 Public Records
- 2010-02-17 Listing Removed — Hive MLS
- 2009-09-02 Listed $189,900 Hive MLS
- 2009-07-31 Listing Removed — Hive MLS
- 2009-04-21 Sold (Public Records) $922,000 Public Records
- 2008-09-03 Listed $189,900 Hive MLS
- 2006-10-25 Listing Removed — Hive MLS
- 2006-07-07 Listed $199,000 Hive MLS
- 2005-08-29 Listing Removed — Hive MLS
- 2005-07-12 Listed $169,900 Hive MLS
Property tax history
+0.6%/yrLatest (2023): $507 · +2.9% YoY. Source: county tax records.
Cash-flow waterfall
monthlySold comps — $/sqft
last 12 mo · ≤1 miLoading sold comps…