1807 N Elgin St · Muncie, IN
Flood risk 1/10 · Minimal
- FEMA flood zone
- X (unshaded)
- Chance of flooding over 30 yrs
- 0.0%
- Est. flood insurance / yr
- $507 – $1,088
Fire risk 1/10 · Minimal
- Est. fire insurance / yr
- $717 – $1,331
Heat risk 3/10 · Minor
- Hot days now (above 100°F)
- 7 days/yr
- Hot days in 30 yrs
- 18 days/yr
Wind risk 2/10 · Minimal
- Chance of severe wind over 30 yrs
- 1.0%
Air-quality risk 3/10 · Minor
- Unhealthy air days now
- 2 days/yr
- Unhealthy air days in 30 yrs
- 3 days/yr
Risk factors via First Street. Map © Google.
Why this score? — see what drove the D- grade
The composite is a weighted blend of 9 inputs, each scored 0–100. Each bar is that input's sub-score; the figure is the points it added to the 100-point composite (weight × sub-score).
- Cash flow +14.2/30.0
- Rent growth +4.5/5.0
- DSCR +4.3/10.0
- Livability +4.0/5.0
- 1% rule +2.9/10.0
- Condition / age +2.5/5.0
- Schools +1.7/10.0
- ARV discount +1.6/15.0
- Appreciation +0.0/10.0
$145,000
🖨 Deal sheet (PDF) 📄 Offer letter ✓ Due diligence
Listing remarks MLS
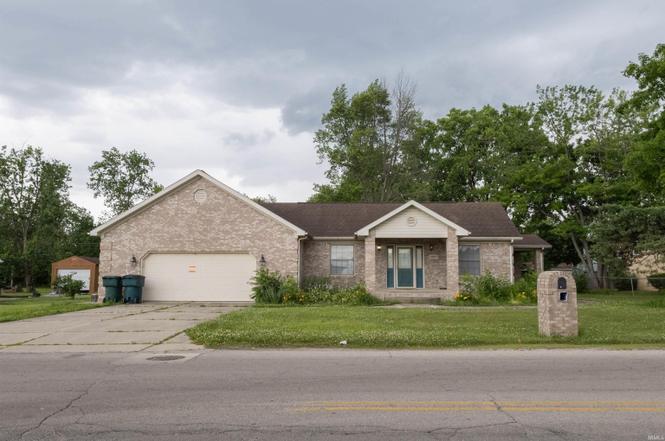
This charming 1-story 3-bedroom, 2-bath brick home on a double lot is ready for a new owner! This property features a spacious 2-car garage, a large lot with room to enjoy the outdoors, and a covered patio conveniently located just off the kitchen—perfect for relaxing or entertaining. The solid brick exterior provides timeless curb appeal, while the interior offers a functional layout ready for your personal touch. Located just off Mcgalliard, this property is near many dining options, shopping, and Ball State University. Property is being sold as-is. Sellers have limited knowledge of the home. Great opportunity for buyers looking to make a home their own or add to an investment portfolio!
Key facts
- Attached garage
- Kitchen peninsula
- Welcoming porch
Tags
Property features AI
Finance
- Other: Property sits on approximately 0.32 acre (1/4–1/2 acre)
Exterior
- Parking: Attached garage (2-car)
- Utilities: Public water; Municipal sewer connected
- Home design: Single-family residence; One level
- Construction: Brick construction; Crawl space foundation
- Exterior features: Covered patio/porch
Interior
- Kitchen: Electric oven; Range hood
- Bedrooms: Three bedrooms on the main level (all bedrooms located on main level)
- Bathrooms: Two full bathrooms (both on the main level)
- Heating & cooling: Natural gas heating; Central air conditioning
- Interior features: Vaulted and cathedral ceilings; Satellite dish
- Laundry & utility: Laundry connections available (all connections)
Neighborhood map
What this means for you Summary
Snapshot
- This is a 3-bed/2.0-bath single-family listed at $145k.
Deal economics
- At list price, monthly cash flow is $23 ($281/yr) — positive.
- The deal already cash-flows at list — no discount required.
- To meet the 1% rule (rent ≥ 1% of price), the offer needs to be $115k (21.0% below list).
- Recommended offer: $115k (21.0% below list) — sets the bar for 1% rule.
Location & tenants
- Location reads 80/100 on livability (#18 in IN, #1,654 nationally) — a professional / high-income tenant draw. Strengths: amenities A+, commute A+, cost of living A+; Watch: crime F, employment F.
- Muncie Community Schools (urban): math 18% / reading 25% proficiency, ranked #275 of 301 in IN (top 91%) — low school quality limits family demand, transient renter base, plan for 1-2y turnover; 68% free/reduced lunch — lower-income household profile, screen leases tightly.
- Zoned schools: Longfellow Elementary School (math 17% / reading 12%, grade F, #862 of 994 statewide, top 88%, 324 students, 86% FRL); Northside Middle School (math 17% / reading 36%, grade F, #236 of 330 statewide, top 72%, 583 students, 70% FRL); Muncie Central High School (math 20% / reading 39%, 1,326 students, 70% FRL).
- Market conditions: Rents rising fast (+7.8%/yr); 115 active listings in the ZIP; 8 comparable units currently listed for rent nearby; rentals lingering (median 46d on market — plan ~5-8 weeks vacancy on turnover, expect pricing pressure); 100% of comp listings sitting > 30 days — soft ceiling on asking rent; 171 units permitted in Delaware County in 2024 (57 in 5+ unit buildings).
Forward outlook
- Local home prices are declining (-3.0%/yr); year-one equity from $1k of loan paydown is wiped out by about $4k of value loss. Plan a longer hold.
- Delaware County population projected at -11% by 2050 — secular population decline; favor cash flow + early exit over multi-decade hold.
Negotiation context
- Only 3 days on market — expect competitive offers; lowballing is unlikely to land.
- 2 sale attempts with the ask held roughly flat each time — persistent listings suggest the price (not the market) is what's stuck; bring a comps-based counter.
Questions for the listing agent
- Is there a deadline driving the sale (1031 exchange, divorce, estate, relocation)? That informs how much negotiation room exists.
- Schools are D-rated, which usually means shorter tenancies and higher turnover. Who's the typical renter profile here, and what's been the actual vacancy rate?
- Crime grade is F in this area — have there been break-ins, vandalism, or insurance claims at this property in the last 3 years? What carrier currently insures it and at what premium?
- The area grade is low — what's the realistic commute time and amenity access for the typical tenant pool here? Any planned neighborhood developments (good or bad) we should know about?
- What's the average days-on-market for RENTAL listings here right now (not sales)? A rising rental-DOM trend means longer vacancies and softer asking-rent achievability than the comps imply.
- What's the recent tenant-quality profile in this submarket — average credit score on applications, eviction rate, late-payment / NSF rate, and stable-employment percentage? A property-management company in the area should have these aggregated.
- How much new for-sale + rental construction is in the pipeline within 1–3 miles? Heavy new supply typically softens prices + rents 12–24 months out; constrained supply supports both.
Investment metrics
- 1% rule
- 0.79% ✗
- Cap rate
- 6.49%
- Cash-on-cash
- 0.69%
- DSCR
- 1.03
- GRM
- 10.5
CMA / ARV
- ARV (on-the-fly)
- $128,304
- Comps found
- 5
Show comp detail 5 sales within ~0.75 mi
| Address | Dist | Beds/Ba | Sqft | Sold | Price | $/sf | Match |
|---|---|---|---|---|---|---|---|
| 2107 N Turner St | 0.16mi | 4/2.0 (+1) | 1,502 (-5%) | 21mo | $89,000 | $59 | 62 |
| 1816 E Highland Ave | 0.38mi | 3/1.0 | 1,484 (-6%) | 11mo | $29,000 | $20 | 58 |
| 1509 E Centennial Ave | 0.25mi | 3/2.0 | 1,773 (+12%) | 12mo | $197,898 | $112 | 58 |
| 1910 E Highland Ave | 0.38mi | 3/1.5 | 1,430 (-10%) | 9mo | $142,000 | $99 | 56 |
| 937 N Bellaire Ave | 0.57mi | 2/1.0 (-1) | 1,352 (-15%) | 15mo | $109,000 | $81 | 27 |
Match score weights: distance 35% · size 25% · config 20% · recency 20%. Top-matched comps best support the ARV.
Projected returns pro-forma
-3.0% appreciation · 7.8% rent growth · sell at horizon
- IRR
- -10.6%
- Equity multiple
- 0.60×
- Total profit
- $-16,262
- Equity at exit
- $21,620
- IRR
- 3.9%
- Equity multiple
- 1.34×
- Total profit
- $13,820
- Equity at exit
- $12,537
Cash invested: $40,600 (down + closing). Projections, not guarantees.
Landlord ↔ Tenant lean methodology
- Overall (STATE)
- 90 Strongly Landlord-Friendly
- State Indiana
- 90 Strongly Landlord-Friendly · R+11
- County
- — inherits STATE
- City
- — inherits STATE
ZIP-level market 47303
- Home prices YoY
- -18.0%
- Rents YoY
- 7.8%
- Active inventory
- 115
- Price-to-rent
- 10.5×
Monthly cashflow live
- Estimated rent
- $1,146 high interval (Pro) →
- Mortgage (P&I)
- −$760
- Tax from tax record
- −$61 /mo · $731/yr
- Insurance
- −$60
- HOA
- −$0
- Vacancy / Maint / Mgmt
- −$241
- Net cashflow
- $23
Break-even live
Sensitivity live
| Price | -10% $105 | -5% $64 | +0% $23 | +5% $-18 | +10% $-59 |
|---|---|---|---|---|---|
| Rent | -10% $-67 | -5% $-22 | +0% $23 | +5% $69 | +10% $114 |
| Rate | -1.0pp $96 | -0.5pp $60 | base $23 | +0.5pp $-14 | +1.0pp $-52 |
UW: 25.0% down · 7.5% · 30yr · 1.5% tax · 5.0% vac · 8.0% maint · 8.0% mgmt
Financing live
Cash to close
- Down payment
- $36,250
- Closing costs
- $4,350
- Reserves months
- —
- Total cash needed
- —
Loan-product check · same deal, 3 products live
Conventional
25% down · 7.5% · 30yr
- Down + closing
- —
- Monthly P&I
- —
- Monthly cashflow
- —
- DSCR
- —
- Eligible?
- —
Personal DTI + credit; lowest rate.
DSCR
20% down · 8.5% · 30yr
- Down + closing
- —
- Monthly P&I
- —
- Monthly cashflow
- —
- DSCR
- —
- Eligible?
- —
No personal income docs; deal must DSCR.
Hard money
10% down · 12.0% · 12mo
- Down + closing
- —
- Monthly P&I
- —
- Monthly cashflow
- —
- DSCR
- —
- Eligible?
- —
Short-term bridge; refi at stabilization.
Rent comps 8 comps
| Address | Beds | Baths | Sqft | Rent | $/sqft | DOM | Units | Dist |
|---|---|---|---|---|---|---|---|---|
| 1414 E Highland Ave Muncie, IN | 2.0 | 1.5 | 1056 | $900 | $0.85 | 45d | 1 | 0.45mi |
| 2901 N Elgin St Muncie, IN | 2.0–3.0 | 2.0 | 1045 | $1,199 | $1.15 | 45d | 4 | 0.66mi |
| 3001 N Westwood Rd Muncie, IN | 3.0 | 1.0 | 1837 | $1,200 | $0.65 | 45d | 1 | 0.96mi |
| 609 N Waldemere Ave Muncie, IN | 4.0 | 1.0 | 1664 | $1,300 | $0.78 | 45d | 1 | 1.08mi |
| 305 N Pershing Dr Muncie, IN | 3.0 | 1.0 | 1062 | $1,100 | $1.04 | 45d | 1 | 1.13mi |
| 9901 N State St Muncie, IN | 3.0 | 2.0 | 1136 | $1,110 | $0.98 | 45d | 5 | 1.31mi |
| 125 E Oldfield Ln Muncie, IN | 1.0–3.0 | 1.0–2.0 | 886 | $1,325 | $1.50 | 45d | 7 | 1.43mi |
| 1521 E Kirby Ave Muncie, IN | 2.0–4.0 | 1.0–2.0 | 972 | $1,150 | $1.18 | 45d | 2 | 1.44mi |
Listing history 4 events
-
2026-06-22statusdays on market $145,000 Pending 3 DOM
-
2026-06-19days on market $145,000 Active 2 DOM
-
2026-06-18remarks 699-char remark
-
2026-06-18$145,000 Active 1 DOM
ⓘ Source: listings_history table (triggers on properties + properties_extension) + one-shot
backfill from property_details.listing_events for pre-trigger history.
Tax reassessment forecast IN · Partial reset (capped growth)
- Current annual tax
- $731 · $61/mo
- Projected year-2 tax
- $982 · $82/mo
- Expected delta
- +$251/yr (+$21/mo · 34.3%)
ⓘ Screening estimate from a state-policy table — verify with the county assessor before closing.
Climate risk First Street
- Flood 1/10 Low FEMA zone X (unshaded) · 0% chance over 30 yrs
- Wildfire 1/10 Low
- Heat 3/10 Moderate 7 d/yr ≥100°F today · 18 d/yr by 30 yrs out
- Wind 2/10 Low 100% chance of damaging wind over 30 yrs
- Air quality 3/10 Moderate 2 unhealthy d/yr today · 3 by 30 yrs out
Nearby sold comps map
Loading sold comps map…
Walkable amenities ~0.75 mi
Loading nearby amenities…
Taxation est. · year 1
- Rental income
- $13,749
- − Mortgage interest
- −$8,122
- − Property taxes
- −$731
- − Insurance
- −$725
- − Repairs & maintenance
- −$1,100
- − Management
- −$1,100
- − Depreciation
- −$4,218
- Taxable loss
- −$2,248
- Est. tax savings @ 24.0%
- +$539
- After-tax cash flow
- $820/yr
For passive investors: Depreciation is non-cash, so a rental often shows a tax loss while cash-flowing — sheltering income. Rental losses are passive: they offset passive income freely, and up to $25,000/yr can offset ordinary (W-2) income if you actively participate and your MAGI is under $100k (phasing out to $0 by $150k); unused losses carry forward. On sale, claimed depreciation is recaptured at up to 25%, and gains may owe capital-gains tax (a 1031 exchange can defer both). Figures are a year-1 estimate at your 24.0% rate — not tax advice; consult a CPA.
Schools (NCES district)
- District
- Muncie Community Schools
- NCES district ID
- 1807320
- Math proficiency
- 18% ▼ -9.00%
- Reading proficiency
- 25% ▼ -4.00%
- Median HH income
- $30,052
- Composite
- 17.22/100
- National rank
- #9099
- State rank
- #275 of 301 in IN
Livability — Muncie
- Score
- 80/100
- State rank
- #18
- US rank
- #1654
Category grades
Schools grade is shown separately in the Schools card above.
Census & demographics
- Census place
- Muncie, IN
- County
- Delaware County · 84,658 people
- City population
- 84,658
- Metro
- Muncie, IN
- Population (ZIP)
- 24,392
- Household income
- $47,674
- Rent vs Own
- Severe rent burden
- 1434.0
Population outlook (Delaware County) Hauer SSP2
- Today (2025)
- 113,036 people
- By 2030
- 111,313 · -1.5%
- By 2040
- 106,432 · -5.8%
- By 2050
- 100,747 · -10.9%
- By 2075
- 91,000 · -19.5%
- By 2100
- 80,687 · -28.6%
Race, ethnicity, and origin ACS 2023
- Neighborhood character
- Predominantly White (82%)
- Race & ethnicity
- White 82% Black 9% Two or more races 5% Hispanic / Latino 3%
- Common ancestry
- Italian 4% Slovak 3% Lithuanian 2%
- Foreign-born
- 2% · Canada
- Languages at home
- 97% English-only · Spanish 1%
Political lean MEDSL · Delaware
- 2024 margin
- R (+15.8) · D 41.2% · R 57.0% · Other 1.8%
- 2008→2024 swing
- -30.8pp toward R · 2008: 15.0pp · 2024: -15.8pp
- All cycles
- 2024: R+15.8 2020: R+13.2 2016: R+13.7 2012: D+3.1 2008: D+15.0
Not yet ingested
- Civics
- —
Market trends
- HPI YoY
- ▼ -50.45%
- Current HPI
- 229.8654
- Rent YoY
- ▲ 7.80%
- Metro
- Muncie, IN
- State GDP YoY
- ▲ 2.90%
- F500 in state
- 18
Industry mix (Fortune 500 HQ in IN)
| Industry | F500 HQs | Revenue |
|---|---|---|
| Industrial Machinery | 2 | $37B |
|
||
| Healthcare | 1 | $177B |
|
||
| Pharmaceuticals | 1 | $45B |
|
||
| Metals / Steel | 1 | $18B |
|
||
| Agriculture | 1 | $17B |
|
||
| Packaging | 1 | $12B |
|
||
Price history
+0.0% since first listed2 events — show timeline
- 2026-06-17 Listed $145,000 IRMLS
- 2026-06-17 Listed $145,000 MIBOR as Distributed by MLS Grid
Property tax history
-3.8%/yrLatest (2024): $731 · +0.0% YoY. Source: county tax records.
Cash-flow waterfall
monthlySold comps — $/sqft
last 12 mo · ≤1 miLoading sold comps…