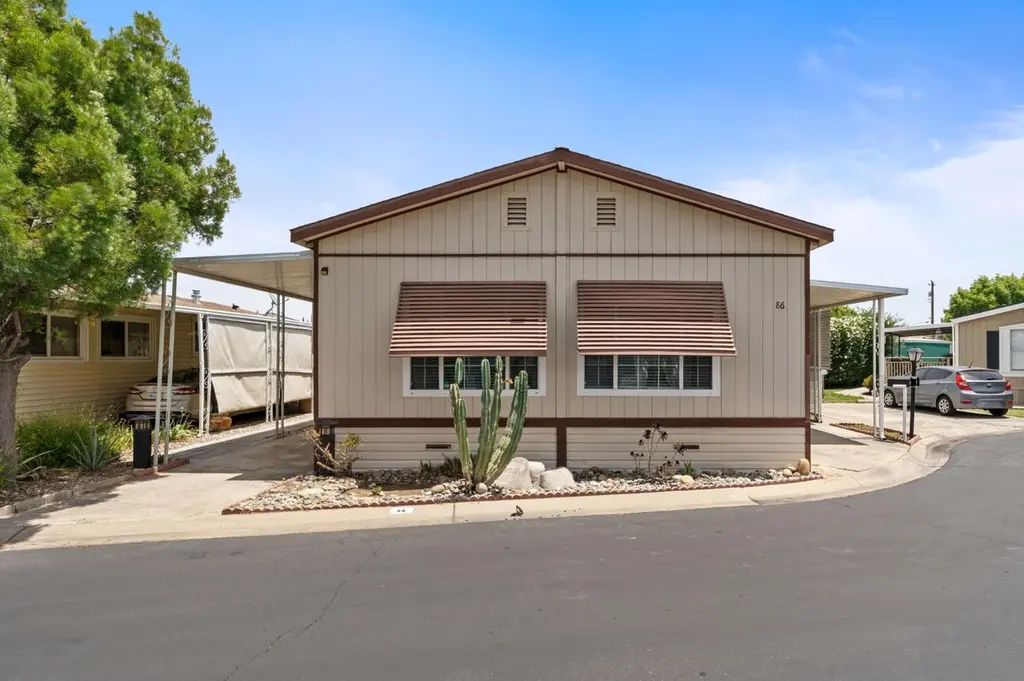
336 E Alluvial Ave #86 · Fresno, CA
Flood risk 1/10 · Minimal
- FEMA flood zone
- X (unshaded)
- Chance of flooding over 30 yrs
- 0.0%
- Est. flood insurance / yr
- $507 – $1,088
Fire risk 6/10 · Moderate
- Est. fire insurance / yr
- $659 – $1,223
Heat risk 8/10 · Major
- Hot days now (above 105°F)
- 7 days/yr
- Hot days in 30 yrs
- 17 days/yr
Wind risk 1/10 · Minimal
- Chance of severe wind over 30 yrs
- —
Air-quality risk 10/10 · Severe
- Unhealthy air days now
- 48 days/yr
- Unhealthy air days in 30 yrs
- 50 days/yr
Risk factors via First Street. Map © Google.
Why this score? — see what drove the C+ grade
The composite is a weighted blend of 9 inputs, each scored 0–100. Each bar is that input's sub-score; the figure is the points it added to the 100-point composite (weight × sub-score).
- Cash flow +30.0/30.0
- 1% rule +10.0/10.0
- DSCR +10.0/10.0
- Schools +5.9/10.0
- Livability +3.1/5.0
- Rent growth +3.0/5.0
- Condition / age +2.5/5.0
- ARV discount +0.0/15.0
- Appreciation +0.0/10.0
$137,900
🖨 Deal sheet 📄 Offer letter ✓ Due diligence
Listing remarks MLS
Updated double wide manufactured home now available in San Joaquin Mobile Home Park. Home is located in a family park across from Kaiser Hospital and walking distance to the River Park shopping center. This 3BR/2BA plus office home sits on a large lot and private cul-de-sac street. The open floor plan features a huge living room, dining room with built-in hutch, large kitchen with new stove & hood, new refrigerator, dishwasher, wood cabinetry, new paint and new flooring. The laundry room is conveniently located inside and has a ton of storage. Master bedroom suite has a huge closet, new carpet, 2 sinks and a large shower. Other features include new flooring throughout, new interior paint, dual pane windows, large deck, 2 sheds and carport for 2 cars. You must see this move-in ready home. You won't be disappointed.
Key facts
- Brand new ac unit
- Covered carport
- Covered patio
Tags
Property features AI
Exterior
- Parking: Carport (attached)
- Utilities: Electric service on; Public sewer; Public utilities
- Home design: Mobile home; Park space rented; GUERD make
- Construction: Composition roof; Wood siding; Wood subfloor foundation; Built as a mobile home
- Exterior features: One-level home; Covered patio/porch; Shed(s); Located in an urban cul-de-sac; Private pool (in-ground, community access); Community spa
Interior
- Kitchen: Range/oven (full-size); Gas appliances; Dishwasher; Garbage disposal; Refrigerator
- Flooring: Carpet; Vinyl
- Bathrooms: 1.75 bathrooms; Tub/shower and separate shower
- Heating & cooling: Central heating and air conditioning; 13+ SEER A/C
- Interior features: Office; Hand rails
- Laundry & utility: Indoor laundry in utility room
Neighborhood map
What this means for you Summary
Snapshot
- This is a 3-bed/2.0-bath manufactured listed at $138k.
Deal economics
- At list price, monthly cash flow is $891 ($11k/yr) — positive.
- The deal already cash-flows at list — no discount required.
- Meets the 1% rule at list price ($2k rent vs $138k).
- Cap rate 14.1% vs local median 3.7% in Fresno — top-decile yield for the area; either an underpriced asset or a hidden risk that comps aren't pricing in. Stress-test before assuming the spread holds.
Location & tenants
- Location reads 62/100 on livability (#469 in CA) — a middle-class / working-renter tenant base. Strengths: commute A+, housing A+; Watch: amenities D+, employment D+, crime F.
- Clovis Unified (suburban): math 58% / reading 72% proficiency, ranked #152 of 1,400 in CA (top 11%) — acceptable for families but not a draw, mixed tenant base, ~2y average lease.
- Zoned schools: Lincoln Elementary (654 students, 67% FRL); Kastner Intermediate (1,133 students, 56% FRL); Clovis West High (2,089 students, 44% FRL) — zoned schools average 56% FRL vs 32% district-wide (24 pts higher); higher-poverty schools than district average — tighter screening recommended.
- Market conditions: Rents rising (+1.9%/yr); 176 active listings in the ZIP; 17 comparable units currently listed for rent nearby; rentals at typical pace (median 16d on market — plan ~3-4 weeks tenant-placement turnaround); solid renter incomes; 2,426 units permitted in Fresno County in 2024 (296 in 5+ unit buildings).
Forward outlook
- Local home prices are declining (-3.0%/yr); year-one equity from $953 of loan paydown is wiped out by about $4k of value loss. Plan a longer hold.
- Fresno County population projected at +11% by 2050 — modest demand growth; plan on rents tracking national, not racing it.
- At projected returns (-3.0% appreciation + 1.9% rent growth), your $39k cash investment doubles in ~5 years — after that, you're playing with house money.
Negotiation context
- Only 9 days on market — expect competitive offers; lowballing is unlikely to land.
- 6 sale attempts since 12y ago with the ask held roughly flat each time — persistent listings suggest the price (not the market) is what's stuck; bring a comps-based counter.
- Current owner paid $95k; 45% above their basis — modest negotiation headroom, anchor on the comps not their cost.
Risks & watch-outs
- Climate carrying-cost: major wildfire risk; extreme-heat days projected 7→17/yr by 2055 (HVAC capex compounding) — expect insurance premiums to compound above CPI over the hold.
Questions for the listing agent
- Built in 1971 — when were the roof, HVAC, electrical panel, plumbing, and water heater last replaced?
- Is there a deadline driving the sale (1031 exchange, divorce, estate, relocation)? That informs how much negotiation room exists.
- Schools are D-rated, which usually means shorter tenancies and higher turnover. Who's the typical renter profile here, and what's been the actual vacancy rate?
- Crime grade is F in this area — have there been break-ins, vandalism, or insurance claims at this property in the last 3 years? What carrier currently insures it and at what premium?
- What's the average days-on-market for RENTAL listings here right now (not sales)? A rising rental-DOM trend means longer vacancies and softer asking-rent achievability than the comps imply.
- What's the recent tenant-quality profile in this submarket — average credit score on applications, eviction rate, late-payment / NSF rate, and stable-employment percentage? A property-management company in the area should have these aggregated.
- How much new for-sale + rental construction is in the pipeline within 1–3 miles? Heavy new supply typically softens prices + rents 12–24 months out; constrained supply supports both.
Investment metrics
- 1% rule
- 1.56% ✓
- Cap rate
- 14.05%
- Cash-on-cash
- 27.71%
- DSCR
- 2.23
- GRM
- 5.3
CMA / ARV
- ARV (on-the-fly)
- $109,032
- Comps found
- 12
Show comp detail 12 sales within ~0.75 mi
| Address | Dist | Beds/Ba | Sqft | Sold | Price | $/sf | Match |
|---|---|---|---|---|---|---|---|
| 336 E Alluvial Ave #144 | 0.05mi | 3/2.0 | 1,394 (-2%) | 4mo | $200,000 | $143 | 92 |
| 336 E Alluvial #167 | 0.05mi | 3/2.0 | 1,440 (+2%) | 4mo | $90,000 | $63 | 92 |
| 336 E Alluvial Ave Spc 4 | 0.00mi | 2/2.0 (-1) | 1,440 (+2%) | 2mo | $110,000 | $76 | 91 |
| 336 E Alluvial Ave Spc 4 | 0.00mi | 2/2.0 (-1) | 1,440 (+2%) | 2mo | $110,000 | $76 | 91 |
| 336 E Alluvial #166 | 0.07mi | 3/2.0 | 1,440 (+2%) | 4mo | $131,500 | $91 | 91 |
| 336 E Alluvial Ave #67 | 0.00mi | 3/2.0 | 1,440 (+2%) | 12mo | $128,000 | $89 | 88 |
| 336 E Alluvial Ave #126 | 0.00mi | 4/2.0 (+1) | 1,344 (-5%) | 4mo | $65,000 | $48 | 84 |
| 336 E Alluvial Ave #12 | 0.05mi | 4/2.0 (+1) | 1,514 (+7%) | 0mo | $172,000 | $114 | 81 |
| 336 E Alluvial Ave #158 | 0.00mi | 3/2.0 | 1,536 (+8%) | 8mo | $100,000 | $65 | 79 |
| 336 E Alluvial #79 #79 | 0.00mi | 4/2.0 (+1) | 1,344 (-5%) | 12mo | $103,000 | $77 | 77 |
| 336 E Alluvial #79 #79 | 0.00mi | 4/2.0 (+1) | 1,344 (-5%) | 12mo | $103,000 | $77 | 77 |
| 336 E Alluvial Ave #161 | 0.00mi | 3/2.0 | 1,248 (-12%) | 13mo | $116,000 | $93 | 69 |
Match score weights: distance 35% · size 25% · config 20% · recency 20%. Top-matched comps best support the ARV.
Projected returns pro-forma
-3.0% appreciation · 1.91% rent growth · sell at horizon
- IRR
- 20.6%
- Equity multiple
- 1.83×
- Total profit
- $32,044
- Equity at exit
- $20,561
- IRR
- 28.1%
- Equity multiple
- 3.37×
- Total profit
- $91,421
- Equity at exit
- $11,923
Cash invested: $38,612 (down + closing). Projections, not guarantees.
Landlord ↔ Tenant lean methodology
- Overall (STATE)
- 18 Strongly Tenant-Friendly
- State California
- 18 Strongly Tenant-Friendly · D+13
- County
- — inherits STATE
- City
- — inherits STATE
ZIP-level market 93720
- Rents YoY
- 1.9%
- Active inventory
- 176
- Price-to-rent
- 5.3×
Monthly cashflow live
- Estimated rent
- $2,149 high interval (Pro) →
- Mortgage (P&I)
- −$723
- Tax from tax record
- −$25 /mo · $303/yr
- Insurance
- −$57
- HOA
- −$0
- Vacancy / Maint / Mgmt
- −$451
- Net cashflow
- $891
Break-even live
UW: 25.0% down · 7.5% · 30yr · 1.5% tax · 5.0% vac · 8.0% maint · 8.0% mgmt
Financing live
Cash to close
- Down payment
- $34,475
- Closing costs
- $4,137
- Reserves months
- —
- Total cash needed
- —
Loan-product check · same deal, 3 products live
Conventional
25% down · 7.5% · 30yr
- Down + closing
- —
- Monthly P&I
- —
- Monthly cashflow
- —
- DSCR
- —
- Eligible?
- —
Personal DTI + credit; lowest rate.
DSCR
20% down · 8.5% · 30yr
- Down + closing
- —
- Monthly P&I
- —
- Monthly cashflow
- —
- DSCR
- —
- Eligible?
- —
No personal income docs; deal must DSCR.
Hard money
10% down · 12.0% · 12mo
- Down + closing
- —
- Monthly P&I
- —
- Monthly cashflow
- —
- DSCR
- —
- Eligible?
- —
Short-term bridge; refi at stabilization.
Rent comps 17 comps
| Address | Beds | Baths | Sqft | Rent | $/sqft | DOM | Units | Dist |
|---|---|---|---|---|---|---|---|---|
| 7579 N Angus St Unit 101 Fresno, CA | 2.0 | 2.0 | 1245 | $1,825 | $1.47 | 23d | 1 | 0.14mi |
| 7580 N Angus St Fresno, CA | 2.0 | 2.0 | 1350 | $1,900 | $1.41 | 43d | 1 | 0.15mi |
| 7722 N Angus St Fresno, CA | 1.0–2.0 | 1.0–2.0 | 820 | $1,575 | $1.92 | 3d | 1 | 0.30mi |
| 7511 N First St Fresno, CA | 1.0–3.0 | 1.0–2.5 | 1078 | $2,350 | $2.18 | 1d | 21 | 0.31mi |
| 7675 N First St Fresno, CA | 1.0–2.0 | 1.0–2.0 | 989 | $1,830 | $1.85 | 43d | 1 | 0.39mi |
| 875 E Cromwell Ave Fresno, CA | 3.0 | 2.0 | 1472 | $2,800 | $1.90 | 14d | 1 | 0.69mi |
| 8109 N 5th St Fresno, CA | 3.0 | 2.0 | 1750 | $2,350 | $1.34 | 3d | 1 | 0.86mi |
| 1050 E Fallbrook Ave Fresno, CA | 3.0 | 2.0 | 1457 | $2,750 | $1.89 | 23d | 1 | 0.92mi |
| 373 W Nees Ave Fresno, CA | 1.0–2.0 | 1.0–2.0 | 867 | $1,855 | $2.14 | 3d | 1 | 0.99mi |
| 6515 N Orchard St Fresno, CA | 3.0 | 2.0 | 1500 | $2,300 | $1.53 | 16d | 1 | 0.99mi |
| 445 W Nees Ave Fresno, CA | 1.0–2.0 | 1.0–2.0 | 847 | $1,820 | $2.15 | 1d | 10 | 1.12mi |
| 8476 N Del Mar Ave Fresno, CA | 4.0 | 2.0 | 1797 | $10,000 | $5.56 | 23d | 1 | 1.13mi |
| 8440 N Millbrook Ave Fresno, CA | 1.0–2.0 | 1.5–2.0 | 1002 | $2,000 | $2.00 | 43d | 1 | 1.28mi |
| 91 W Sierra Ave Fresno, CA | 3.0 | 1.5 | 1291 | $2,500 | $1.94 | 16d | 1 | 1.28mi |
| 8153 N Cedar Ave #212 Fresno, CA | 2.0 | 2.0 | 1141 | $1,750 | $1.53 | 23d | 1 | 1.40mi |
| 7350 N Cedar Ave Fresno, CA | 2.0 | 1.0 | 915 | $1,816 | $1.98 | 1d | 2 | 1.44mi |
| 135 E Stuart Ave Fresno, CA | 3.0 | 1.0 | 1120 | $1,995 | $1.78 | 3d | 1 | 1.46mi |
Listing history 8 events
-
2026-06-18days on market $137,900 Active 9 DOM
-
2026-06-17days on market $137,900 Active 8 DOM
-
2026-06-16days on market $137,900 Active 7 DOM
-
2026-06-15days on market $137,900 Active 6 DOM
-
2026-06-13days on market $137,900 Active 4 DOM
-
2026-06-13days on market $137,900 Active 3 DOM
-
2026-06-10remarks 699-char remark
-
2026-06-10$137,900 Active 1 DOM
ⓘ Source: listings_history table (triggers on properties + properties_extension) + one-shot
backfill from property_details.listing_events for pre-trigger history.
Tax reassessment forecast CA · Resets to sale price
- Current annual tax
- $303 · $25/mo
- Projected year-2 tax
- $1,048 · $87/mo
- Expected delta
- +$745/yr (+$62/mo · 245.9%)
ⓘ Screening estimate from a state-policy table — verify with the county assessor before closing.
Climate risk First Street
- Flood 1/10 Low FEMA zone X (unshaded) · 0% chance over 30 yrs
- Wildfire 6/10 Major
- Heat 8/10 Severe 7 d/yr ≥105°F today · 17 d/yr by 30 yrs out
- Wind 1/10 Low
- Air quality 10/10 Extreme 48 unhealthy d/yr today · 50 by 30 yrs out
Nearby sold comps map
Loading sold comps map…
Walkable amenities ~0.75 mi
Loading nearby amenities…
Taxation est. · year 1
- Rental income
- $25,782
- − Mortgage interest
- −$7,725
- − Property taxes
- −$303
- − Insurance
- −$690
- − Repairs & maintenance
- −$2,063
- − Management
- −$2,063
- − Depreciation
- −$4,012
- Taxable income
- $8,929
- Est. tax owed @ 24.0%
- −$2,143
- After-tax cash flow
- $8,555/yr
For passive investors: Depreciation is non-cash, so a rental often shows a tax loss while cash-flowing — sheltering income. Rental losses are passive: they offset passive income freely, and up to $25,000/yr can offset ordinary (W-2) income if you actively participate and your MAGI is under $100k (phasing out to $0 by $150k); unused losses carry forward. On sale, claimed depreciation is recaptured at up to 25%, and gains may owe capital-gains tax (a 1031 exchange can defer both). Figures are a year-1 estimate at your 24.0% rate — not tax advice; consult a CPA.
Schools (NCES district)
- District
- Clovis Unified
- NCES district ID
- 0609030
- Math proficiency
- 58% ▲ 1.00%
- Reading proficiency
- 72% ▲ 2.00%
- Median HH income
- $71,950
- Composite
- 58.7/100
- National rank
- #2003
- State rank
- #152 of 1400 in CA
Livability — Fresno
- Score
- 62/100
- State rank
- #469
- US rank
- #15907
Category grades
Schools grade is shown separately in the Schools card above.
Census & demographics
- Census place
- Fresno, CA
- County
- Fresno County · 834,801 people
- City population
- 593,114
- Metro
- Fresno, CA
- Population (ZIP)
- 50,089
- Household income
- $105,050
- Rent vs Own
- Severe rent burden
- 1796.0
Population outlook (Fresno County) Hauer SSP2
- Today (2025)
- 1,042,971 people
- By 2030
- 1,072,198 · +2.8%
- By 2040
- 1,122,408 · +7.6%
- By 2050
- 1,157,251 · +11.0%
- By 2075
- 1,182,575 · +13.4%
- By 2100
- 1,105,899 · +6.0%
Race, ethnicity, and origin ACS 2023
- Neighborhood character
- Diverse neighborhood (Simpson 0.67)
- Race & ethnicity
- White 48% Hispanic / Latino 28% Two or more races 16% Asian 16% Black 3%
- Hispanic origin (detail)
- Mexican 24%
- Common ancestry
- Russian 2% Slovak 1% Italian 1%
- Foreign-born
- 17% · Canada, China, Vietnam
- Languages at home
- 73% English-only · Spanish 10% Other Indo-European 6% Tagalog/Filipino 2%
Political lean MEDSL · Fresno
- 2024 margin
- Toss-up / Even · D 46.5% · R 50.9% · Other 2.6%
- 2008→2024 swing
- -6.5pp toward R · 2008: 2.1pp · 2024: -4.4pp
- All cycles
- 2024: R+4.4 2020: D+7.8 2016: D+3.9 2012: R+2.9 2008: D+2.1
Not yet ingested
- Civics
- —
Market trends
- HPI YoY
- ▼ -278.23%
- Current HPI
- 332.618
- Rent YoY
- ▲ 1.91%
- Metro
- Fresno, CA
- State GDP YoY
- ▲ 3.21%
- F500 in state
- 116
Industry mix (Fortune 500 HQ in CA)
| Industry | F500 HQs | Revenue |
|---|---|---|
| Technology | 27 | $1,492B |
|
||
| Financial Services | 3 | $174B |
|
||
| Retail | 3 | $44B |
|
||
| Insurance | 3 | $26B |
|
||
| Media / Entertainment | 2 | $115B |
|
||
| Pharmaceuticals / Biotech | 2 | $62B |
|
||
Price history
+607.2% since first listed14 events — show timeline
- 2026-06-05 Listed $137,900 FRESNOMLS
- 2022-07-20 Sold (MLS) $95,000 FRESNOMLS
- 2022-06-25 Pending — FRESNOMLS
- 2022-06-13 Relisted — FRESNOMLS
- 2022-05-18 Pending — FRESNOMLS
- 2022-05-07 Relisted — FRESNOMLS
- 2022-03-13 Pending — FRESNOMLS
- 2022-02-02 Relisted — FRESNOMLS
- 2022-01-18 Pending — FRESNOMLS
- 2021-12-10 Listed $99,975 FRESNOMLS
- 2014-07-11 Sold (MLS) $19,500 FRESNOMLS
- 2014-06-13 Delisted — FRESNOMLS
- 2014-06-13 Price Changed $23,000 FRESNOMLS
- 2014-05-09 Listed $19,500 FRESNOMLS
Cash-flow waterfall
monthlySold comps — $/sqft
last 12 mo · ≤1 miLoading sold comps…