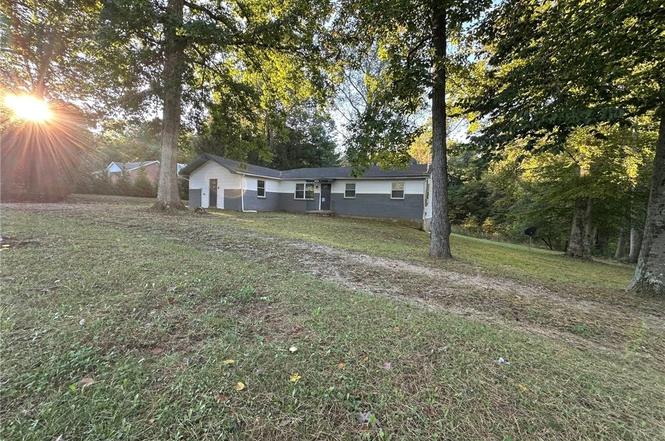
11435 Bradford Rd · Greenville, IN
Flood risk 1/10 · Minimal
- FEMA flood zone
- X (unshaded)
- Chance of flooding over 30 yrs
- 0.0%
- Est. flood insurance / yr
- $473 – $860
Fire risk 1/10 · Minimal
- Est. fire insurance / yr
- $717 – $1,331
Heat risk 4/10 · Minor
- Hot days now (above 105°F)
- 7 days/yr
- Hot days in 30 yrs
- 19 days/yr
Wind risk 2/10 · Minimal
- Chance of severe wind over 30 yrs
- 2.0%
Air-quality risk 2/10 · Minimal
- Unhealthy air days now
- 1 days/yr
- Unhealthy air days in 30 yrs
- 2 days/yr
Risk factors via First Street. Map © Google.
Why this score? — see what drove the D- grade
The composite is a weighted blend of 9 inputs, each scored 0–100. Each bar is that input's sub-score; the figure is the points it added to the 100-point composite (weight × sub-score).
- Cash flow +10.9/30.0
- ARV discount +7.5/15.0
- Schools +4.2/10.0
- Livability +3.5/5.0
- DSCR +3.2/10.0
- 1% rule +3.1/10.0
- Rent growth +2.5/5.0
- Condition / age +2.5/5.0
- Appreciation +0.0/10.0
$169,900
🖨 Deal sheet (PDF) 📄 Offer letter ✓ Due diligence
Listing remarks
Check this out! 4 (possible 5) Bedroom home! This home offers a large living room and two large family rooms, one of which could be easily be converted to a 5th Bedroom and you will still have a living room and a family room! If you need extra space, this is the one! This home offers a nice large deck for all of your entertaining needs with a beautiful, wooded view on 1.2+/- Acres with backyard privacy and there is plenty of parking space for guests!
Key facts
- Large deck
- Backyard privacy
- Large living room
Tags
Property features AI
Exterior
- Parking: No garage
- Utilities: Public water connected; Septic tank sewer
- Home design: Single-story home
- Construction: Frame construction; Crawlspace foundation
- Exterior features: Residential zoning; Lot approximately 1.21 acres
Interior
- Kitchen: Microwave; Oven; Range; Refrigerator
- Bedrooms: Three bedrooms on the first level; One additional room described as possible 5th bedroom or second family room on the first level
- Flooring: Carpet in several rooms; Laminate in living room; Linoleum in kitchen; Tile in bathroom
- Bathrooms: One full bathroom on the first level
- Heating & cooling: Forced air heating; Central air conditioning
- Interior features: Crawl space basement; Possible 5th bedroom or second family room (flex space)
- Laundry & utility: Laundry closet on the main level
Neighborhood map
What this means for you Summary
Snapshot
- This is a 3-bed/1.0-bath single-family listed at $170k.
Deal economics
- At list price, monthly cash flow is $-75 ($-901/yr) — negative.
- To cash-flow at today's rent, offer at most $157k (7.8% below list).
- To meet the 1% rule (rent ≥ 1% of price), the offer needs to be $137k (19.2% below list).
- Recommended offer: $137k (19.2% below list) — sets the bar for 1% rule.
Location & tenants
- Location reads 70/100 on livability (#172 in IN) — a middle-class / working-renter tenant base. Strengths: crime A+, employment A+, cost of living A+; Watch: amenities F, commute F, health & safety F.
- New Albany-Floyd County Consolidated Schools (suburban): math 46% / reading 50% proficiency, ranked #68 of 301 in IN (top 23%) — families likely to look elsewhere, expect single-tenant / working-renter base with shorter leases.
- Zoned schools: Georgetown Elementary School (math 67% / reading 52%, grade B-, #128 of 994 statewide, top 15%, 683 students, 28% FRL); Highland Hills Middle School (math 53% / reading 57%, grade B-, #26 of 330 statewide, top 8%, 1,652 students, 19% FRL); Floyd Central High School (math 50% / reading 80%, grade B, #31 of 369 statewide, top 9%, 1,873 students, 19% FRL) — zoned schools average 22% FRL vs 38% district-wide (16 pts lower); this property's tenant base skews higher-income than the district average.
- Market conditions: 20 active listings in the ZIP; 297 units permitted in Floyd County in 2024 (84 in 5+ unit buildings).
Forward outlook
- Local home prices are declining (-3.0%/yr); year-one equity from $1k of loan paydown is wiped out by about $5k of value loss. Plan a longer hold.
- Floyd County population projected at +10% by 2050 — modest demand growth; plan on rents tracking national, not racing it.
Negotiation context
- It's been on market 290 days — a 12% lower offer ($150k) is reasonable based on typical stale-listing flexibility.
- 2 sale attempts; this cycle's ask has dropped $100k (37%) from the opening price — seller is motivated, your offer sets the floor, not the list.
Questions for the listing agent
- What do current leases actually rent for vs. the listed asking? Can we see a recent rent roll and the last 12 months of T-12 income?
- It's been on market 290 days. Have you received any prior offers? Is the seller open to a 19% concession, seller financing, or rate buy-down credit?
- Built in 1970 — when were the roof, HVAC, electrical panel, plumbing, and water heater last replaced?
- Why hasn't it sold? Are there any deal-killer items the seller is aware of (foundation, flood, title, zoning, code violations)?
- Is there a deadline driving the sale (1031 exchange, divorce, estate, relocation)? That informs how much negotiation room exists.
- The area grade is low — what's the realistic commute time and amenity access for the typical tenant pool here? Any planned neighborhood developments (good or bad) we should know about?
- What's the average days-on-market for RENTAL listings here right now (not sales)? A rising rental-DOM trend means longer vacancies and softer asking-rent achievability than the comps imply.
- What's the recent tenant-quality profile in this submarket — average credit score on applications, eviction rate, late-payment / NSF rate, and stable-employment percentage? A property-management company in the area should have these aggregated.
- How much new for-sale + rental construction is in the pipeline within 1–3 miles? Heavy new supply typically softens prices + rents 12–24 months out; constrained supply supports both.
Investment metrics
- 1% rule
- 0.81% ✗
- Cap rate
- 5.76%
- Cash-on-cash
- -1.89%
- DSCR
- 0.92
- GRM
- 10.3
CMA / ARV
No comps found within radius.
Projected returns pro-forma
-3.0% appreciation · 3.0% rent growth · sell at horizon
- IRR
- -19.4%
- Equity multiple
- 0.32×
- Total profit
- $-32,302
- Equity at exit
- $25,333
- IRR
- -12.1%
- Equity multiple
- 0.28×
- Total profit
- $-34,238
- Equity at exit
- $14,690
Cash invested: $47,572 (down + closing). Projections, not guarantees.
Landlord ↔ Tenant lean methodology
- Overall (STATE)
- 90 Strongly Landlord-Friendly
- State Indiana
- 90 Strongly Landlord-Friendly · R+11
- County
- — inherits STATE
- City
- — inherits STATE
ZIP-level market 47124
- Home prices YoY
- -31.8%
- Active inventory
- 20
- Price-to-rent
- 10.3×
Monthly cashflow live
- Estimated rent
- $1,373 medium interval (Pro) →
- Mortgage (P&I)
- −$891
- Tax from tax record
- −$198 /mo · $2,375/yr
- Insurance
- −$71
- HOA
- −$0
- Vacancy / Maint / Mgmt
- −$288
- Net cashflow
- $-75
Break-even live
Sensitivity live
| Price | -10% $21 | -5% $-27 | +0% $-75 | +5% $-123 | +10% $-171 |
|---|---|---|---|---|---|
| Rent | -10% $-184 | -5% $-129 | +0% $-75 | +5% $-21 | +10% $33 |
| Rate | -1.0pp $10 | -0.5pp $-32 | base $-75 | +0.5pp $-119 | +1.0pp $-164 |
UW: 25.0% down · 7.5% · 30yr · 1.5% tax · 5.0% vac · 8.0% maint · 8.0% mgmt
Financing live
Cash to close
- Down payment
- $42,475
- Closing costs
- $5,097
- Reserves months
- —
- Total cash needed
- —
Loan-product check · same deal, 3 products live
Conventional
25% down · 7.5% · 30yr
- Down + closing
- —
- Monthly P&I
- —
- Monthly cashflow
- —
- DSCR
- —
- Eligible?
- —
Personal DTI + credit; lowest rate.
DSCR
20% down · 8.5% · 30yr
- Down + closing
- —
- Monthly P&I
- —
- Monthly cashflow
- —
- DSCR
- —
- Eligible?
- —
No personal income docs; deal must DSCR.
Hard money
10% down · 12.0% · 12mo
- Down + closing
- —
- Monthly P&I
- —
- Monthly cashflow
- —
- DSCR
- —
- Eligible?
- —
Short-term bridge; refi at stabilization.
Listing history 29 events
-
2026-06-21days on market $169,900 Active 290 DOM
-
2026-06-18days on market $169,900 Active 287 DOM
-
2026-06-17days on market $169,900 Active 286 DOM
-
2026-06-16days on market $169,900 Active 285 DOM
-
2026-06-15days on market $169,900 Active 284 DOM
-
2026-06-13days on market $169,900 Active 282 DOM
-
2026-06-10days on market $169,900 Active 279 DOM
-
2026-06-09days on market $169,900 Active 278 DOM
-
2026-06-08days on market $169,900 Active 277 DOM
-
2026-06-07days on market $169,900 Active 276 DOM
-
2026-06-03days on market $169,900 Active 272 DOM
-
2026-06-02days on market $169,900 Active 271 DOM
-
2026-06-01days on market $169,900 Active 270 DOM
-
2026-05-31days on market $169,900 Active 269 DOM
-
2026-04-27price $189,900
-
2026-03-30price $199,900
-
2026-03-02price $209,900
-
2026-02-04price $219,900
-
2026-01-09price $229,900
-
2025-12-02status Active
-
2025-12-02historical
-
2025-10-21price $239,900
-
2025-09-16price $259,900
-
2025-09-02$269,900 Active
-
2025-08-04price $269,900
-
2025-06-12price $284,900
-
2025-05-08price $294,900
-
2025-04-15price $304,900
-
2022-12-04historical
ⓘ Source: listings_history table (triggers on properties + properties_extension) + one-shot
backfill from property_details.listing_events for pre-trigger history.
Tax reassessment forecast IN · Partial reset (capped growth)
- Current annual tax
- $2,375 · $198/mo
- Projected year-2 tax
- $2,375 · $198/mo
- Expected delta
- $0/yr ($0/mo · 0.0%)
ⓘ Screening estimate from a state-policy table — verify with the county assessor before closing.
Climate risk First Street
- Flood 1/10 Low FEMA zone X (unshaded) · 0% chance over 30 yrs
- Wildfire 1/10 Low
- Heat 4/10 Moderate 7 d/yr ≥105°F today · 19 d/yr by 30 yrs out
- Wind 2/10 Low 2% chance of damaging wind over 30 yrs
- Air quality 2/10 Low 1 unhealthy d/yr today · 2 by 30 yrs out
Nearby sold comps map
Loading sold comps map…
Walkable amenities ~0.75 mi
Loading nearby amenities…
Taxation est. · year 1
- Rental income
- $16,475
- − Mortgage interest
- −$9,517
- − Property taxes
- −$2,375
- − Insurance
- −$850
- − Repairs & maintenance
- −$1,318
- − Management
- −$1,318
- − Depreciation
- −$4,943
- Taxable loss
- −$3,845
- Est. tax savings @ 24.0%
- +$923
- After-tax cash flow
- $22/yr
For passive investors: Depreciation is non-cash, so a rental often shows a tax loss while cash-flowing — sheltering income. Rental losses are passive: they offset passive income freely, and up to $25,000/yr can offset ordinary (W-2) income if you actively participate and your MAGI is under $100k (phasing out to $0 by $150k); unused losses carry forward. On sale, claimed depreciation is recaptured at up to 25%, and gains may owe capital-gains tax (a 1031 exchange can defer both). Figures are a year-1 estimate at your 24.0% rate — not tax advice; consult a CPA.
Schools (NCES district)
- District
- New Albany-Floyd County Consolidated Schools
- NCES district ID
- 1807410
- Math proficiency
- 46% ▼ -4.00%
- Reading proficiency
- 50% ▼ -3.00%
- Median HH income
- $54,709
- Composite
- 41.57/100
- National rank
- #3441
- State rank
- #68 of 301 in IN
Livability — Greenville
- Score
- 70/100
- State rank
- #172
- US rank
- #8030
Category grades
Schools grade is shown separately in the Schools card above.
Census & demographics
- Population (ZIP)
- 5,514
Population outlook (Floyd County) Hauer SSP2
- Today (2025)
- 82,092 people
- By 2030
- 84,384 · +2.8%
- By 2040
- 87,919 · +7.1%
- By 2050
- 89,958 · +9.6%
- By 2075
- 94,159 · +14.7%
- By 2100
- 91,907 · +12.0%
Race, ethnicity, and origin ACS 2023
- Neighborhood character
- Predominantly White (93%)
- Race & ethnicity
- White 93% Two or more races 6% Hispanic / Latino 3% Asian 1%
- Common ancestry
- Portuguese 3% Serbian 2% Slovak 2%
- Foreign-born
- 2% · Canada, China
- Languages at home
- 97% English-only · Other Indo-European 1% Spanish 1%
Political lean MEDSL · Floyd
- 2024 margin
- R (+15.5) · D 41.4% · R 56.9% · Other 1.7%
- 2008→2024 swing
- -5.4pp toward R · 2008: -10.1pp · 2024: -15.5pp
- All cycles
- 2024: R+15.5 2020: R+14.1 2016: R+20.1 2012: R+14.3 2008: R+10.1
Not yet ingested
- Civics
- —
Market trends
- HPI YoY
- ▼ -98.09%
- Current HPI
- 210.1422
- Rent YoY
- —
- Metro
- —
- State GDP YoY
- ▲ 2.90%
- F500 in state
- 18
Industry mix (Fortune 500 HQ in IN)
| Industry | F500 HQs | Revenue |
|---|---|---|
| Industrial Machinery | 2 | $37B |
|
||
| Healthcare | 1 | $177B |
|
||
| Pharmaceuticals | 1 | $45B |
|
||
| Metals / Steel | 1 | $18B |
|
||
| Agriculture | 1 | $17B |
|
||
| Packaging | 1 | $12B |
|
||
Price history
-37.7% since first listed15 events — show timeline
- 2026-04-27 Price Changed $189,900 SIRA
- 2026-03-30 Price Changed $199,900 SIRA
- 2026-03-02 Price Changed $209,900 SIRA
- 2026-02-04 Price Changed $219,900 SIRA
- 2026-01-09 Price Changed $229,900 SIRA
- 2025-12-02 Relisted — SIRA
- 2025-12-02 Delisted — SIRA
- 2025-10-21 Price Changed $239,900 SIRA
- 2025-09-16 Price Changed $259,900 SIRA
- 2025-09-02 Listed $269,900 SIRA
- 2025-08-04 Price Changed $269,900 SIRA
- 2025-06-12 Price Changed $284,900 SIRA
- 2025-05-08 Price Changed $294,900 SIRA
- 2025-04-15 Price Changed $304,900 SIRA
- 2022-12-04 Rental Removed — RENT.
Property tax history
+2.5%/yrLatest (2024): $2,375 · -24.2% YoY. Source: county tax records.
Cash-flow waterfall
monthlySold comps — $/sqft
last 12 mo · ≤1 miLoading sold comps…