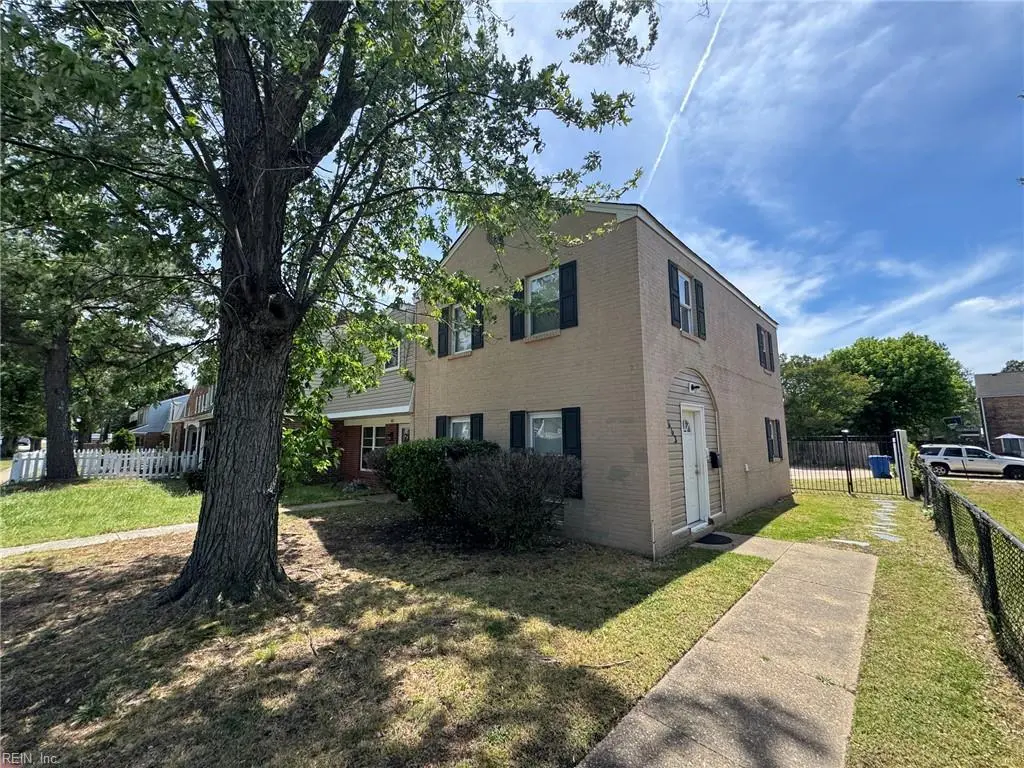
663 Baker Rd · Virginia Beach, VA
Flood risk 1/10 · Minimal
- FEMA flood zone
- X (unshaded)
- Chance of flooding over 30 yrs
- 0.0%
- Est. flood insurance / yr
- $507 – $1,088
Fire risk 1/10 · Minimal
- Est. fire insurance / yr
- $666 – $1,236
Heat risk 9/10 · Severe
- Hot days now (above 104°F)
- 7 days/yr
- Hot days in 30 yrs
- 16 days/yr
Wind risk 8/10 · Major
- Chance of severe wind over 30 yrs
- 80.0%
Air-quality risk 3/10 · Minor
- Unhealthy air days now
- 2 days/yr
- Unhealthy air days in 30 yrs
- 3 days/yr
Risk factors via First Street. Map © Google.
Why this score? — see what drove the D+ grade
The composite is a weighted blend of 9 inputs, each scored 0–100. Each bar is that input's sub-score; the figure is the points it added to the 100-point composite (weight × sub-score).
- Cash flow +18.6/30.0
- Schools +6.4/10.0
- DSCR +5.8/10.0
- ARV discount +4.2/15.0
- Livability +4.2/5.0
- Rent growth +3.9/5.0
- 1% rule +3.8/10.0
- Condition / age +2.5/5.0
- Appreciation +0.0/10.0
$254,900
🖨 Deal sheet (PDF) 📄 Offer letter ✓ Due diligence
Listing remarks
Welcome home to this beautifully maintained end-unit four-bedroom townhome in Virginia Beach, where comfort meets convenience in the heart of the city. The well-designed floor plan features fresh interior paint and new carpet throughout. Conveniently located near shopping, dining, entertainment, and major interstates. Move-in ready and waiting for its next owner!
Key facts
- Built 1969
- Listed 13 days
Property features AI
Finance
- Other: Neighborhood: LAKE EDWARD
- HOA & community: No HOA (no association listed)
Exterior
- Parking: Off-street parking; Driveway spaces; On-street parking
- Utilities: City/county water; City/county sewer; Electric service
- Home design: Attached townhouse; 2 stories with 2 living levels; Slab foundation; Simple ownership
- Construction: Asphalt shingle roof
- Exterior features: Brick siding; Decorative partial fence; Storage shed; Attic (access via scuttle)
Interior
- Kitchen: Electric range; Microwave; Dishwasher
- Bedrooms: Master bedroom; Additional bedroom(s)
- Flooring: Carpet; Ceramic; Laminate
- Bathrooms: 1 full bathroom; 1 half bathroom
- Heating & cooling: Heat pump heating; Electric heating; Central air conditioning; Electric water heater
- Interior features: Cable hookup; Ceiling fan; Scuttle access (attic access)
- Laundry & utility: Washer hookup (main floor laundry); Dryer hookup; Utility room; Utility closet
Neighborhood map
What this means for you Summary
Snapshot
- This is a 4-bed/1.5-bath townhouse listed at $255k.
Deal economics
- At list price, monthly cash flow is $246 ($3k/yr) — positive.
- The deal already cash-flows at list — no discount required.
- To meet the 1% rule (rent ≥ 1% of price), the offer needs to be $225k (11.7% below list).
- Recommended offer: $225k (11.7% below list) — sets the bar for 1% rule.
- Cap rate 7.4% vs local median 3.5% in Virginia Beach — top-decile yield for the area; either an underpriced asset or a hidden risk that comps aren't pricing in. Stress-test before assuming the spread holds.
Location & tenants
- Location reads 83/100 on livability (#38 in VA, #880 nationally) — a professional / high-income tenant draw. Strengths: amenities A+, employment A+, housing A+; Watch: cost of living C-, commute F.
- Va Beach City Public School District (urban): math 69% / reading 78% proficiency, ranked #10 of 131 in VA (top 8%) — strong family-tenant draw, lease renewals of 3-5y typical.
- Zoned schools: Diamond Springs Elementary (484 students, 100% FRL); Bayside Middle (math 53% / reading 54%, grade C+, #209 of 342 statewide, top 62%, 700 students, 92% FRL); Bayside High (math 63% / reading 75%, grade B, #170 of 319 statewide, top 55%, 1,983 students, 65% FRL) — zoned schools average 86% FRL vs 28% district-wide (58 pts higher); higher-poverty schools than district average — tighter screening recommended.
- Zoned-school proficiency averages 61% at this address vs 74% district-wide (-12 pts) — the specific schools serving this property underperform the Va Beach City Public School District average; the district grade overstates school quality for this exact location.
- Market conditions: Rents rising fast (+5.6%/yr); 229 active listings in the ZIP; 25 comparable units currently listed for rent nearby; rentals at typical pace (median 18d on market — plan ~3-4 weeks tenant-placement turnaround); 666 units permitted in Virginia Beach city in 2024 (347 in 5+ unit buildings).
- This rent runs 39% of the median local income ($69k/yr) — at the standard rent-burdened threshold; future hikes will face affordability resistance.
Forward outlook
- Local home prices are declining (-3.0%/yr); year-one equity from $2k of loan paydown is wiped out by about $8k of value loss. Plan a longer hold.
- Virginia Beach County population projected at +6% by 2050 — modest demand growth; plan on rents tracking national, not racing it.
Negotiation context
- Only 13 days on market — expect competitive offers; lowballing is unlikely to land.
- Current owner paid $135k; list at $255k implies a 89% gain — meaningful room to come down on a strong offer.
Risks & watch-outs
- Climate carrying-cost: severe wind risk, 80% chance of damaging wind over 30y; extreme-heat days projected 7→16/yr by 2055 (HVAC capex compounding) — expect insurance premiums to compound above CPI over the hold.
Questions for the listing agent
- Built in 1969 — when were the roof, HVAC, electrical panel, plumbing, and water heater last replaced?
- Is there a deadline driving the sale (1031 exchange, divorce, estate, relocation)? That informs how much negotiation room exists.
- Schools are A-rated — typically a magnet for longer-tenancy family renters. What's the average tenant stay here, and is there a school-zone premium baked into asking?
- The area grade is low — what's the realistic commute time and amenity access for the typical tenant pool here? Any planned neighborhood developments (good or bad) we should know about?
- What's the average days-on-market for RENTAL listings here right now (not sales)? A rising rental-DOM trend means longer vacancies and softer asking-rent achievability than the comps imply.
- What's the recent tenant-quality profile in this submarket — average credit score on applications, eviction rate, late-payment / NSF rate, and stable-employment percentage? A property-management company in the area should have these aggregated.
- How much new for-sale + rental construction is in the pipeline within 1–3 miles? Heavy new supply typically softens prices + rents 12–24 months out; constrained supply supports both.
Investment metrics
- 1% rule
- 0.88% ✗
- Cap rate
- 7.45%
- Cash-on-cash
- 4.13%
- DSCR
- 1.18
- GRM
- 9.4
CMA / ARV
- ARV (on-the-fly)
- $237,600
- Comps found
- 12
Show comp detail 12 sales within ~0.75 mi
| Address | Dist | Beds/Ba | Sqft | Sold | Price | $/sf | Match |
|---|---|---|---|---|---|---|---|
| 663 Baker Rd | 0.00mi | 4/1.5 | 1,200 (0%) | 0mo | $254,900 | $212 | 100 |
| 5716 E Hastings Arch | 0.04mi | 3/1.5 (-1) | 1,200 (0%) | 2mo | $245,000 | $204 | 91 |
| 5944 Margate Ave | 0.37mi | 3/1.5 (-1) | 1,260 (+5%) | 2mo | $200,000 | $159 | 68 |
| 5900 Blackpoole Ln | 0.30mi | 3/1.5 (-1) | 1,310 (+9%) | 3mo | $257,500 | $197 | 63 |
| 6006 Margate Ave | 0.45mi | 3/1.5 (-1) | 1,260 (+5%) | 3mo | $250,000 | $198 | 63 |
| 5920 Buckminister Ln | 0.34mi | 3/1.5 (-1) | 1,301 (+8%) | 4mo | $245,000 | $188 | 62 |
| 809 S Buckingham Ct | 0.29mi | 3/2.5 (-1) | 1,322 (+10%) | 1mo | $270,000 | $204 | 60 |
| 839 Devonshire Ct | 0.34mi | 3/1.5 (-1) | 1,328 (+11%) | 4mo | $255,000 | $192 | 58 |
| 5676 Weblin Dr | 0.33mi | 3/2.5 (-1) | 1,322 (+10%) | 1mo | $265,000 | $200 | 58 |
| 5487 Davis Way | 0.67mi | 3/1.5 (-1) | 1,266 (+6%) | 3mo | $230,000 | $182 | 52 |
| 5661 Campus Dr | 0.58mi | 3/2.5 (-1) | 1,350 (+12%) | 0mo | $283,500 | $210 | 43 |
| 5589 Campus Dr | 0.63mi | 3/2.5 (-1) | 1,346 (+12%) | 2mo | $210,000 | $156 | 40 |
Match score weights: distance 35% · size 25% · config 20% · recency 20%. Top-matched comps best support the ARV.
Projected returns pro-forma
-3.0% appreciation · 5.61% rent growth · sell at horizon
- IRR
- -7.3%
- Equity multiple
- 0.72×
- Total profit
- $-19,695
- Equity at exit
- $38,006
- IRR
- 5.0%
- Equity multiple
- 1.40×
- Total profit
- $28,834
- Equity at exit
- $22,039
Cash invested: $71,372 (down + closing). Projections, not guarantees.
Landlord ↔ Tenant lean methodology
- Overall (STATE)
- 55 Moderately Landlord-Leaning
- State Virginia
- 55 Moderately Landlord-Leaning · D+2
- County
- — inherits STATE
- City
- — inherits STATE
ZIP-level market 23462
- Rents YoY
- 5.6%
- Active inventory
- 229
- Price-to-rent
- 9.4×
Monthly cashflow live
- Estimated rent
- $2,252 high interval (Pro) →
- Mortgage (P&I)
- −$1,337
- Tax from tax record
- −$90 /mo · $1,082/yr
- Insurance
- −$106
- HOA
- −$0
- Vacancy / Maint / Mgmt
- −$473
- Net cashflow
- $246
Break-even live
Sensitivity live
| Price | -10% $390 | -5% $318 | +0% $246 | +5% $174 | +10% $101 |
|---|---|---|---|---|---|
| Rent | -10% $68 | -5% $157 | +0% $246 | +5% $335 | +10% $424 |
| Rate | -1.0pp $374 | -0.5pp $311 | base $246 | +0.5pp $180 | +1.0pp $112 |
UW: 25.0% down · 7.5% · 30yr · 1.5% tax · 5.0% vac · 8.0% maint · 8.0% mgmt
Financing live
Cash to close
- Down payment
- $63,725
- Closing costs
- $7,647
- Reserves months
- —
- Total cash needed
- —
Loan-product check · same deal, 3 products live
Conventional
25% down · 7.5% · 30yr
- Down + closing
- —
- Monthly P&I
- —
- Monthly cashflow
- —
- DSCR
- —
- Eligible?
- —
Personal DTI + credit; lowest rate.
DSCR
20% down · 8.5% · 30yr
- Down + closing
- —
- Monthly P&I
- —
- Monthly cashflow
- —
- DSCR
- —
- Eligible?
- —
No personal income docs; deal must DSCR.
Hard money
10% down · 12.0% · 12mo
- Down + closing
- —
- Monthly P&I
- —
- Monthly cashflow
- —
- DSCR
- —
- Eligible?
- —
Short-term bridge; refi at stabilization.
Rent comps 25 comps
| Address | Beds | Baths | Sqft | Rent | $/sqft | DOM | Units | Dist |
|---|---|---|---|---|---|---|---|---|
| 712 White Hall Ln Virginia Beach, VA | 3.0 | 1.5 | 1400 | $2,200 | $1.57 | 25d | 1 | 0.06mi |
| 5831 E Hastings Arch Virginia Beach, VA | 3.0 | 1.5 | 1200 | $1,950 | $1.62 | 25d | 1 | 0.16mi |
| 620 Red Horse Ln Virginia Beach, VA | 3.0 | 1.5 | 1396 | $1,550 | $1.11 | 21d | 1 | 0.25mi |
| 813 S Grosvenor Ct Virginia Beach, VA | 3.0 | 2.5 | 1476 | $2,300 | $1.56 | 6d | 1 | 0.34mi |
| 5964 Blackpoole Ln Virginia Beach, VA | 3.0 | 1.5 | 1310 | $2,100 | $1.60 | 25d | 1 | 0.41mi |
| 5516 Seawall Ct Virginia Beach, VA | 2.0–3.0 | 1.0–3.0 | 1125 | $2,421 | $2.15 | 3d | 18 | 0.59mi |
| 5684 Campus Dr Virginia Beach, VA | 3.0 | 2.5 | 1356 | $2,495 | $1.84 | 6d | 1 | 0.59mi |
| 5500 Baccalaureate Dr Virginia Beach, VA | 3.0 | 2.5 | 1400 | $1,995 | $1.43 | 16d | 1 | 0.59mi |
| 5403 Scholarship Dr Virginia Beach, VA | 3.0 | 2.5 | 1480 | $2,100 | $1.42 | 25d | 1 | 0.60mi |
| 5517 Lynbrook Lndg Virginia Beach, VA | 3.0 | 2.5 | 1360 | $2,335 | $1.72 | 25d | 1 | 0.65mi |
| 5547 Lynbrook Lndg Virginia Beach, VA | 3.0 | 1.0 | 820 | $1,350 | $1.65 | 19d | 1 | 0.66mi |
| 616 Aubrey Dr Virginia Beach, VA | 3.0 | 1.5 | 1266 | $1,995 | $1.58 | 25d | 1 | 0.68mi |
| 5414 Catina Arch Virginia Beach, VA | 1.0–4.0 | 1.0–1.5 | 866 | $2,276 | $2.63 | 4d | 10 | 0.87mi |
| 1060 Kempsville Rd Norfolk, VA | 3.0 | 2.0 | 1425 | $2,975 | $2.09 | 13d | 1 | 1.03mi |
| 1060 Kempsville Rd Unit 00 08107 Norfolk, VA | 3.0 | 2.0 | 1383 | $2,479 | $1.79 | 14d | 1 | 1.05mi |
| 449 Peregrine St Virginia Beach, VA | 3.0 | 2.0 | 1400 | $1,995 | $1.43 | 18d | 1 | 1.22mi |
| 6163 Kempsville Cir Norfolk, VA | 1.0–3.0 | 1.0–2.0 | 1120 | $3,008 | $2.69 | 3d | 12 | 1.25mi |
| 326 Harrier St Virginia Beach, VA | 3.0 | 1.5 | 1178 | $1,995 | $1.69 | 18d | 1 | 1.29mi |
| 1124 Gleaning Close Virginia Beach, VA | 3.0 | 2.0 | 1160 | $1,995 | $1.72 | 25d | 1 | 1.32mi |
| 1136 Gleaning Close Virginia Beach, VA | 3.0 | 2.5 | 1456 | $1,895 | $1.30 | 9d | 1 | 1.34mi |
| 512 Featherstone Ct Unit 573F Virginia Beach, VA | 3.0 | 1.0 | 1047 | $1,675 | $1.60 | 25d | 1 | 1.35mi |
| 5212 Richard Rd Virginia Beach, VA | 3.0 | 2.5 | 1372 | $2,100 | $1.53 | 23d | 1 | 1.37mi |
| 5206 Richard Rd Virginia Beach, VA | 3.0 | 1.5 | 1240 | $1,795 | $1.45 | 23d | 1 | 1.38mi |
| 1151 Hillock Xing Virginia Beach, VA | 3.0 | 2.5 | 1410 | $1,975 | $1.40 | 12d | 1 | 1.41mi |
| 5161 Weaver Dr Virginia Beach, VA | 2.0–3.0 | 1.0 | 971 | $1,675 | $1.73 | 6d | 4 | 1.44mi |
Listing history 4 events
-
2026-05-16historical Active Under Contract
-
2026-05-14$254,900 Active
-
2009-10-29soldstatus $135,000
-
1998-03-11soldstatus $59,900
ⓘ Source: listings_history table (triggers on properties + properties_extension) + one-shot
backfill from property_details.listing_events for pre-trigger history.
Tax reassessment forecast VA · Resets to sale price
- Current annual tax
- $1,082 · $90/mo
- Projected year-2 tax
- $2,090 · $174/mo
- Expected delta
- +$1,009/yr (+$84/mo · 93.2%)
ⓘ Screening estimate from a state-policy table — verify with the county assessor before closing.
Climate risk First Street
- Flood 1/10 Low FEMA zone X (unshaded) · 0% chance over 30 yrs
- Wildfire 1/10 Low
- Heat 9/10 Extreme 7 d/yr ≥104°F today · 16 d/yr by 30 yrs out
- Wind 8/10 Severe 80% chance of damaging wind over 30 yrs
- Air quality 3/10 Moderate 2 unhealthy d/yr today · 3 by 30 yrs out
Nearby sold comps map
Loading sold comps map…
Walkable amenities ~0.75 mi
Loading nearby amenities…
Taxation est. · year 1
- Rental income
- $27,019
- − Mortgage interest
- −$14,278
- − Property taxes
- −$1,082
- − Insurance
- −$1,274
- − Repairs & maintenance
- −$2,162
- − Management
- −$2,162
- − Depreciation
- −$7,415
- Taxable loss
- −$1,353
- Est. tax savings @ 24.0%
- +$325
- After-tax cash flow
- $3,273/yr
For passive investors: Depreciation is non-cash, so a rental often shows a tax loss while cash-flowing — sheltering income. Rental losses are passive: they offset passive income freely, and up to $25,000/yr can offset ordinary (W-2) income if you actively participate and your MAGI is under $100k (phasing out to $0 by $150k); unused losses carry forward. On sale, claimed depreciation is recaptured at up to 25%, and gains may owe capital-gains tax (a 1031 exchange can defer both). Figures are a year-1 estimate at your 24.0% rate — not tax advice; consult a CPA.
Schools (NCES district)
- District
- Va Beach City Public School District
- NCES district ID
- 5103840
- Math proficiency
- 69% ▼ -19.00%
- Reading proficiency
- 78% ▼ -7.00%
- Median HH income
- $66,452
- Composite
- 63.81/100
- National rank
- #594
- State rank
- #10 of 131 in VA
Livability — Virginia Beach
- Score
- 83/100
- State rank
- #38
- US rank
- #880
Category grades
Schools grade is shown separately in the Schools card above.
Census & demographics
- Census place
- Virginia Beach, VA
- County
- Virginia Beach City · 448,227 people
- City population
- 448,227
- Metro
- Virginia Beach-Norfolk-Newport News, VA-NC
- Population (ZIP)
- 66,151
- Household income
- $69,040
- Rent vs Own
- Severe rent burden
- 3906.0
Population outlook (Virginia Beach County) Hauer SSP2
- Today (2025)
- 480,401 people
- By 2030
- 491,221 · +2.3%
- By 2040
- 504,882 · +5.1%
- By 2050
- 508,847 · +5.9%
- By 2075
- 504,831 · +5.1%
- By 2100
- 465,867 · -3.0%
Race, ethnicity, and origin ACS 2023
- Neighborhood character
- Diverse neighborhood (Simpson 0.68)
- Race & ethnicity
- White 45% Black 32% Hispanic / Latino 12% Two or more races 10% Asian 5%
- Hispanic origin (detail)
- Mexican 4% Puerto Rican 3%
- Common ancestry
- Romanian 2% Italian 1% Slovak 1%
- Foreign-born
- 9% · Canada, China, Vietnam
- Languages at home
- 87% English-only · Spanish 6% Tagalog/Filipino 2% Other Asian/Pacific 1%
Political lean MEDSL · Virginia Beach
- 2024 margin
- Toss-up / Even · D 50.7% · R 48.0% · Other 1.3%
- 2008→2024 swing
- +3.4pp toward D · 2008: -0.7pp · 2024: 2.6pp
- All cycles
- 2024: D+2.6 2020: D+5.4 2016: R+4.5 2012: R+2.5 2008: R+0.7
Not yet ingested
- Civics
- —
Market trends
- HPI YoY
- ▼ -269.19%
- Current HPI
- 333.1908
- Rent YoY
- ▲ 5.61%
- Metro
- Virginia Beach-Norfolk-Newport News, VA-NC
- State GDP YoY
- ▲ 2.40%
- F500 in state
- 50
Industry mix (Fortune 500 HQ in VA)
| Industry | F500 HQs | Revenue |
|---|---|---|
| Aerospace / Defense | 4 | $236B |
|
||
| Technology / Defense | 3 | $32B |
|
||
| Financial Services | 2 | $176B |
|
||
| Utilities | 2 | $27B |
|
||
| Insurance | 2 | $25B |
|
||
| Technology | 2 | $15B |
|
||
Price history
+325.5% since first listed4 events — show timeline
- 2026-05-16 Contingent — REINMLS
- 2026-05-14 Listed $254,900 REINMLS
- 2009-10-29 Sold (Public Records) $135,000 Public Records
- 1998-03-11 Sold (Public Records) $59,900 Public Records
Property tax history
+4.3%/yrLatest (2020): $1,082 · +4.2% YoY. Source: county tax records.
Cash-flow waterfall
monthlySold comps — $/sqft
last 12 mo · ≤1 miLoading sold comps…