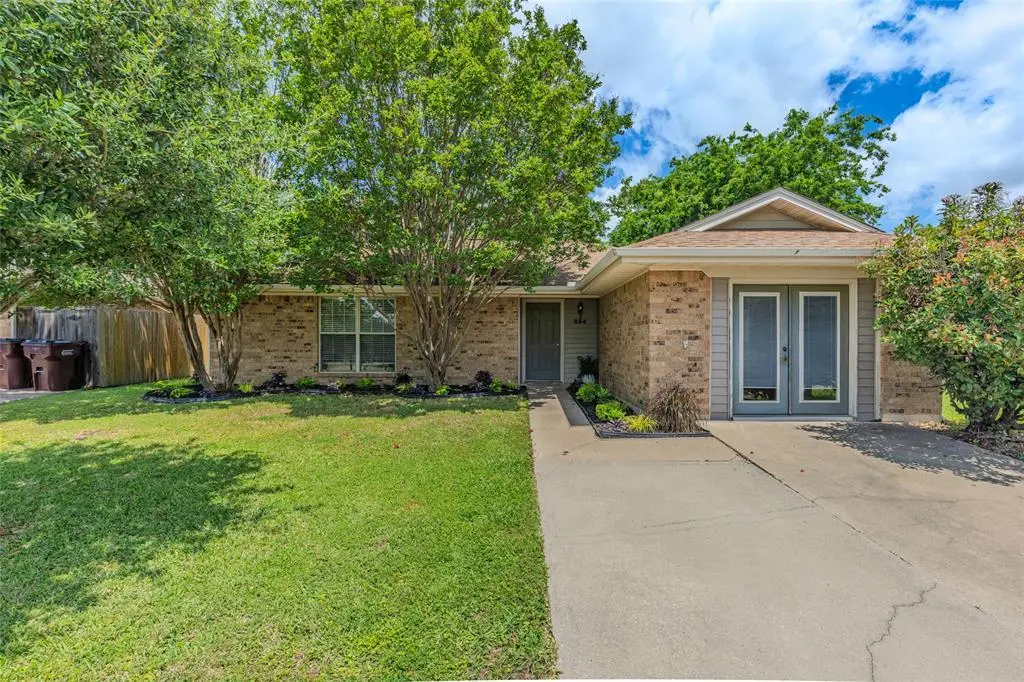
824 Meadowdale Dr · Royse City, TX
Flood risk 1/10 · Minimal
- FEMA flood zone
- X (unshaded)
- Chance of flooding over 30 yrs
- 0.0%
- Est. flood insurance / yr
- $507 – $1,088
Fire risk 5/10 · Moderate
- Est. fire insurance / yr
- $1,222 – $2,270
Heat risk 8/10 · Major
- Hot days now (above 110°F)
- 7 days/yr
- Hot days in 30 yrs
- 24 days/yr
Wind risk 6/10 · Moderate
- Chance of severe wind over 30 yrs
- 27.0%
Air-quality risk 2/10 · Minimal
- Unhealthy air days now
- 1 days/yr
- Unhealthy air days in 30 yrs
- 1 days/yr
Risk factors via First Street. Map © Google.
Why this score? — see what drove the D grade
The composite is a weighted blend of 9 inputs, each scored 0–100. Each bar is that input's sub-score; the figure is the points it added to the 100-point composite (weight × sub-score).
- Cash flow +11.1/30.0
- ARV discount +11.0/15.0
- 1% rule +4.2/10.0
- Schools +3.8/10.0
- Livability +3.8/5.0
- DSCR +3.2/10.0
- Condition / age +2.5/5.0
- Rent growth +2.2/5.0
- Appreciation +0.0/10.0
$219,900
🖨 Deal sheet (PDF) 📄 Offer letter ✓ Due diligence
Listing remarks MLS
Maintained to perfection! 3/1.5/1 featuring ceiling fans in all rooms, ceramic tile flooring, berber carpet, neutral colors, security system, and more Outside features are new roof and gutters in'03,privacy fence, and extra concrete drive for parking. Perfect for those just getting started
Key facts
- Enclosed garage
- Large backyard
- Updated interior
Tags
Property features AI
Finance
- HOA & community: No association
Exterior
- Parking: Driveway; Additional parking (on property)
- Utilities: City water; City sewer; Concrete curb and gutter; Sidewalks
- Home design: Single-family residence; One-story; Residential property; Deed restrictions
- Construction: Built in 1990; Brick and siding exterior; Composition roof; Slab foundation; Storage structure on lot
- Exterior features: Gutters; Storage; Wood fencing in back yard; Large backyard with grass; Few trees; Subdivision setting; Utilities easement
Interior
- Kitchen: Dishwasher; Disposal; Electric range; Microwave; Refrigerator; Built-in cabinets; Solid surface counters; Water line to refrigerator
- Bedrooms: 3 bedrooms (all on main level); Primary bedroom on main level
- Flooring: Luxury vinyl plank
- Bathrooms: 1 full bathroom; 1 half bathroom
- Heating & cooling: Central heating (electric); Central air (electric); Ceiling fan(s)
- Interior features: Open floorplan; Cable TV available; High-speed internet available; Walk-in closet(s); Window coverings
- Laundry & utility: Laundry in hall; Full-size washer/dryer area; Built-in cabinets in laundry
Neighborhood map
What this means for you Summary
Snapshot
- This is a 3-bed/1.5-bath single-family listed at $220k.
Deal economics
- At list price, monthly cash flow is $-87 ($-1k/yr) — negative.
- To cash-flow at today's rent, offer at most $205k (7.0% below list).
- To meet the 1% rule (rent ≥ 1% of price), the offer needs to be $202k (8.2% below list).
- Recommended offer: $202k (8.2% below list) — sets the bar for 1% rule.
- Cap rate 5.8% vs local median 4.2% in Royse City — top-decile yield for the area; either an underpriced asset or a hidden risk that comps aren't pricing in. Stress-test before assuming the spread holds.
Location & tenants
- Location reads 75/100 on livability (#158 in TX, #4,292 nationally) — a middle-class / working-renter tenant base. Strengths: crime A+, employment A+, housing A+; Watch: amenities F, commute F.
- Royse City ISD (rural): math 42% / reading 42% proficiency, ranked #266 of 826 in TX (top 32%) — families likely to look elsewhere, expect single-tenant / working-renter base with shorter leases.
- Zoned schools: Davis El (math 52% / reading 41%, grade D-, #1,080 of 4,322 statewide, top 25%, 500 students, 52% FRL); Ouida Baley Middle (math 32% / reading 35%, grade F, #911 of 1,662 statewide, top 56%, 934 students, 43% FRL); Royse City H S (math 38% / reading 55%, grade D-, #621 of 1,632 statewide, top 38%, 2,526 students, 37% FRL).
- Market conditions: Rents soft (-1.1%/yr); 1301 active listings in the ZIP; 30 comparable units currently listed for rent nearby; rentals at typical pace (median 21d on market — plan ~3-4 weeks tenant-placement turnaround); high-income renter base; 1,810 units permitted in Rockwall County in 2024 (0 in 5+ unit buildings).
Forward outlook
- Local home prices are declining (-3.0%/yr); year-one equity from $2k of loan paydown is wiped out by about $7k of value loss. Plan a longer hold.
- Rockwall County population projected at +56% by 2050 — long-run rental-demand tailwind backs the buy-and-hold thesis.
Negotiation context
- It's been on market 21 days — a 2% lower offer ($217k) is reasonable based on typical stale-listing flexibility.
- 2 sale attempts since 21y ago with the ask held roughly flat each time — persistent listings suggest the price (not the market) is what's stuck; bring a comps-based counter.
Risks & watch-outs
- Climate carrying-cost: major wind risk, 27% chance of damaging wind over 30y; moderate wildfire risk; extreme-heat days projected 7→24/yr by 2055 (HVAC capex compounding) — expect insurance premiums to compound above CPI over the hold.
Questions for the listing agent
- What do current leases actually rent for vs. the listed asking? Can we see a recent rent roll and the last 12 months of T-12 income?
- Is there a deadline driving the sale (1031 exchange, divorce, estate, relocation)? That informs how much negotiation room exists.
- The area grade is low — what's the realistic commute time and amenity access for the typical tenant pool here? Any planned neighborhood developments (good or bad) we should know about?
- What's the average days-on-market for RENTAL listings here right now (not sales)? A rising rental-DOM trend means longer vacancies and softer asking-rent achievability than the comps imply.
- What's the recent tenant-quality profile in this submarket — average credit score on applications, eviction rate, late-payment / NSF rate, and stable-employment percentage? A property-management company in the area should have these aggregated.
- How much new for-sale + rental construction is in the pipeline within 1–3 miles? Heavy new supply typically softens prices + rents 12–24 months out; constrained supply supports both.
Investment metrics
- 1% rule
- 0.92% ✗
- Cap rate
- 5.82%
- Cash-on-cash
- -1.69%
- DSCR
- 0.92
- GRM
- 9.1
CMA / ARV
- ARV (median comp)
- $238,566
- List price
- $219,900
- Delta
- -7.82%
- Verdict
- FAIR
- Comps
- 20 within 1.0 mi
Show comp detail 12 sales within ~0.75 mi
| Address | Dist | Beds/Ba | Sqft | Sold | Price | $/sf | Match |
|---|---|---|---|---|---|---|---|
| 425 Rustic Grove Ln | 0.22mi | 3/2.0 | 1,395 (-2%) | 9mo | $259,480 | $186 | 77 |
| 409 Fireside Pl | 0.33mi | 3/2.0 | 1,382 (-3%) | 2mo | $245,000 | $177 | 76 |
| 700 Oak Grove Ln | 0.15mi | 3/2.0 | 1,305 (-8%) | 2mo | $220,900 | $169 | 76 |
| 817 Oak Grove Ln | 0.03mi | 3/2.5 | 1,570 (+10%) | 6mo | $149,900 | $95 | 72 |
| 713 Loganwood Dr | 0.12mi | 3/2.0 | 1,300 (-8%) | 11mo | $220,000 | $169 | 69 |
| 305 Rustic Grove Ln | 0.23mi | 3/2.0 | 1,564 (+10%) | 6mo | $254,900 | $163 | 66 |
| 717 Loganwood Dr | 0.11mi | 3/2.0 | 1,231 (-13%) | 10mo | $210,000 | $171 | 62 |
| 416 Autumn Trl | 0.25mi | 3/2.0 | 1,554 (+9%) | 11mo | $285,000 | $183 | 62 |
| 209 W County Line Rd | 0.67mi | 3/2.0 | 1,384 (-3%) | 2mo | $225,000 | $163 | 61 |
| 1017 N Houston St | 0.66mi | 3/1.0 | 1,448 (+2%) | 6mo | $199,000 | $137 | 59 |
| 813 Live Oak St | 0.64mi | 2/2.0 (-1) | 1,303 (-8%) | 0mo | $219,000 | $168 | 49 |
| 304 N Houston St | 0.54mi | 3/1.0 | 1,232 (-13%) | 11mo | $205,000 | $166 | 41 |
Match score weights: distance 35% · size 25% · config 20% · recency 20%. Top-matched comps best support the ARV.
Projected returns pro-forma
-3.0% appreciation · 0.0% rent growth · sell at horizon
- IRR
- -22.8%
- Equity multiple
- 0.24×
- Total profit
- $-46,944
- Equity at exit
- $32,788
- IRR
- -29.3%
- Equity multiple
- -0.14×
- Total profit
- $-70,327
- Equity at exit
- $19,013
Cash invested: $61,572 (down + closing). Projections, not guarantees.
Landlord ↔ Tenant lean methodology
- Overall (STATE)
- 87 Strongly Landlord-Friendly
- State Texas
- 87 Strongly Landlord-Friendly · R+5
- County
- — inherits STATE
- City
- — inherits STATE
ZIP-level market 75189
- Home prices YoY
- -25.0%
- Rents YoY
- -1.1%
- Active inventory
- 1301
- Price-to-rent
- 9.1×
Monthly cashflow live
- Estimated rent
- $2,018 high interval (Pro) →
- Mortgage (P&I)
- −$1,153
- Tax from tax record
- −$437 /mo · $5,238/yr
- Insurance
- −$92
- HOA
- −$0
- Vacancy / Maint / Mgmt
- −$424
- Net cashflow
- $-87
Break-even live
Sensitivity live
| Price | -10% $38 | -5% $-25 | +0% $-87 | +5% $-149 | +10% $-211 |
|---|---|---|---|---|---|
| Rent | -10% $-246 | -5% $-166 | +0% $-87 | +5% $-7 | +10% $73 |
| Rate | -1.0pp $24 | -0.5pp $-31 | base $-87 | +0.5pp $-144 | +1.0pp $-202 |
UW: 25.0% down · 7.5% · 30yr · 1.5% tax · 5.0% vac · 8.0% maint · 8.0% mgmt
Financing live
Cash to close
- Down payment
- $54,975
- Closing costs
- $6,597
- Reserves months
- —
- Total cash needed
- —
Loan-product check · same deal, 3 products live
Conventional
25% down · 7.5% · 30yr
- Down + closing
- —
- Monthly P&I
- —
- Monthly cashflow
- —
- DSCR
- —
- Eligible?
- —
Personal DTI + credit; lowest rate.
DSCR
20% down · 8.5% · 30yr
- Down + closing
- —
- Monthly P&I
- —
- Monthly cashflow
- —
- DSCR
- —
- Eligible?
- —
No personal income docs; deal must DSCR.
Hard money
10% down · 12.0% · 12mo
- Down + closing
- —
- Monthly P&I
- —
- Monthly cashflow
- —
- DSCR
- —
- Eligible?
- —
Short-term bridge; refi at stabilization.
Rent comps 30 comps
| Address | Beds | Baths | Sqft | Rent | $/sqft | DOM | Units | Dist |
|---|---|---|---|---|---|---|---|---|
| 721 Oak Grove Ln Royse City, TX | 3.0 | 2.0 | 1188 | $1,805 | $1.52 | 0d | 1 | 0.08mi |
| 821 Loganwood Dr Royse City, TX | 3.0 | 2.0 | 1291 | $1,725 | $1.34 | 26d | 1 | 0.10mi |
| 1012 Brookhaven Dr Royse City, TX | 3.0 | 2.0 | 1642 | $2,149 | $1.31 | 4d | 1 | 0.15mi |
| 412 Pin Oak Ln Royse City, TX | 3.0 | 2.0 | 1254 | $1,800 | $1.44 | 1d | 1 | 0.22mi |
| 412 Pin Oak Ln Royse City, TX | 3.0 | 2.0 | 1254 | $1,800 | $1.44 | 45d | 1 | 0.22mi |
| 221 Rustic Grove Ln Royse City, TX | 3.0 | 2.0 | 1233 | $1,895 | $1.54 | 45d | 1 | 0.25mi |
| 903 Live Oak St Royse City, TX | 2.0 | 1.5 | 1372 | $1,800 | $1.31 | 45d | 1 | 0.66mi |
| 1017 N Houston St Royse City, TX | 3.0 | 1.0 | 1448 | $1,725 | $1.19 | 45d | 1 | 0.67mi |
| 913 Live Oak St Unit B Royse City, TX | 3.0 | 2.0 | 1120 | $1,600 | $1.43 | 22d | 1 | 0.68mi |
| 209 E Gail Ln Royse City, TX | 3.0 | 1.5 | 1224 | $1,850 | $1.51 | 0d | 1 | 0.79mi |
| 309 S Bell St Royse City, TX | 2.0 | 1.0 | 1013 | $1,500 | $1.48 | 45d | 1 | 0.82mi |
| 1023 Lakes Dr Royse City, TX | 2.0–3.0 | 2.0 | 1194 | $1,749 | $1.46 | 3d | 1 | 0.88mi |
| 315 College St Royse City, TX | 3.0 | 2.0 | 1254 | $1,850 | $1.48 | 5d | 1 | 0.95mi |
| 524 Timberhaven Trl Royse City, TX | 3.0 | 2.0 | 1693 | $1,900 | $1.12 | 26d | 1 | 0.97mi |
| 1313 Waco Turner Royse City, TX | 4.0 | 2.0 | 1829 | $1,821 | $1.00 | 1d | 1 | 1.04mi |
| 609 Rosemary Dr Royse City, TX | 3.0 | 2.0 | 1759 | $1,901 | $1.08 | 14d | 1 | 1.08mi |
| 609 Rosemary Dr Royse City, TX | 3.0 | 2.0 | 1759 | $1,835 | $1.04 | 7d | 1 | 1.08mi |
| 713 Cooper Ln Royse City, TX | 4.0 | 2.0 | 1859 | $1,895 | $1.02 | 1d | 1 | 1.10mi |
| 708 Mackenzie Dr Royse City, TX | 4.0 | 2.0 | 1779 | $1,780 | $1.00 | 45d | 1 | 1.12mi |
| 1931 Hellams Ln Unit 1 Royse City, TX | 3.0 | 2.5 | 1711 | $1,995 | $1.17 | 20d | 1 | 1.14mi |
| 1939 Hellams Ln Unit 1 Royse City, TX | 3.0 | 2.5 | 1711 | $1,995 | $1.17 | 20d | 1 | 1.14mi |
| 1947 Hellams Ln Unit 1 Royse City, TX | 3.0 | 2.5 | 1850 | $2,250 | $1.22 | 7d | 1 | 1.15mi |
| 1501 Kelly Ln Royse City, TX | 3.0 | 2.0 | 1402 | $1,875 | $1.34 | 0d | 1 | 1.15mi |
| 804 Rowdy Dr Royse City, TX | 3.0 | 2.0 | 1671 | $1,700 | $1.02 | 4d | 1 | 1.17mi |
| 1612 Audrey Dr Royse City, TX | 3.0 | 2.0 | 1224 | $1,799 | $1.47 | 45d | 1 | 1.25mi |
| 512 Cookston Ln Royse City, TX | 3.0 | 2.0 | 1598 | $1,850 | $1.16 | 26d | 1 | 1.34mi |
| 1705 Fair Oaks Ln Royse City, TX | 3.0 | 2.0 | 1833 | $1,999 | $1.09 | 45d | 1 | 1.37mi |
| 1204 Blue Ridge Pl Royse City, TX | 4.0 | 2.0 | 1751 | $2,400 | $1.37 | 4d | 1 | 1.42mi |
| 225 Cookston Ln Royse City, TX | 4.0 | 2.0 | 1651 | $1,825 | $1.11 | 26d | 1 | 1.43mi |
| 225 Cookston Ln Royse City, TX | 4.0 | 2.0 | 1651 | $1,825 | $1.11 | 15d | 1 | 1.43mi |
Listing history 10 events
-
2026-06-04status $219,900 Pending 21 DOM
-
2026-06-03days on market $219,900 Active Option Contract 21 DOM
-
2026-06-02days on market $219,900 Active Option Contract 20 DOM
-
2026-06-01days on market $219,900 Active Option Contract 19 DOM
-
2026-05-31days on market $219,900 Active Option Contract 18 DOM
-
2026-05-12$219,900 Active 1154-char remark
-
2005-06-23soldstatus
-
2005-06-21soldstatus 290-char remark
Show marketing remark (290 chars)
Maintained to perfection! 3/1.5/1 featuring ceiling fans in all rooms, ceramic tile flooring, berber carpet, neutral colors, security system, and more Outside features are new roof and gutters in'03,privacy fence, and extra concrete drive for parking. Perfect for those just getting started
-
2005-05-29historical 290-char remark
Show marketing remark (290 chars)
Maintained to perfection! 3/1.5/1 featuring ceiling fans in all rooms, ceramic tile flooring, berber carpet, neutral colors, security system, and more Outside features are new roof and gutters in'03,privacy fence, and extra concrete drive for parking. Perfect for those just getting started
-
2005-02-14$90,000 290-char remark
Show marketing remark (290 chars)
Maintained to perfection! 3/1.5/1 featuring ceiling fans in all rooms, ceramic tile flooring, berber carpet, neutral colors, security system, and more Outside features are new roof and gutters in'03,privacy fence, and extra concrete drive for parking. Perfect for those just getting started
ⓘ Source: listings_history table (triggers on properties + properties_extension) + one-shot
backfill from property_details.listing_events for pre-trigger history.
Tax reassessment forecast TX · Resets to sale price
- Current annual tax
- $5,238 · $437/mo
- Projected year-2 tax
- $5,238 · $437/mo
- Expected delta
- $0/yr ($0/mo · 0.0%)
ⓘ Screening estimate from a state-policy table — verify with the county assessor before closing.
Climate risk First Street
- Flood 1/10 Low FEMA zone X (unshaded) · 0% chance over 30 yrs
- Wildfire 5/10 Major
- Heat 8/10 Severe 7 d/yr ≥110°F today · 24 d/yr by 30 yrs out
- Wind 6/10 Major 27% chance of damaging wind over 30 yrs
- Air quality 2/10 Low 1 unhealthy d/yr today · 1 by 30 yrs out
Nearby sold comps map
Loading sold comps map…
Walkable amenities ~0.75 mi
Loading nearby amenities…
Taxation est. · year 1
- Rental income
- $24,222
- − Mortgage interest
- −$12,318
- − Property taxes
- −$5,238
- − Insurance
- −$1,100
- − Repairs & maintenance
- −$1,938
- − Management
- −$1,938
- − Depreciation
- −$6,397
- Taxable loss
- −$4,707
- Est. tax savings @ 24.0%
- +$1,130
- After-tax cash flow
- $89/yr
For passive investors: Depreciation is non-cash, so a rental often shows a tax loss while cash-flowing — sheltering income. Rental losses are passive: they offset passive income freely, and up to $25,000/yr can offset ordinary (W-2) income if you actively participate and your MAGI is under $100k (phasing out to $0 by $150k); unused losses carry forward. On sale, claimed depreciation is recaptured at up to 25%, and gains may owe capital-gains tax (a 1031 exchange can defer both). Figures are a year-1 estimate at your 24.0% rate — not tax advice; consult a CPA.
Schools (NCES district)
- District
- Royse City ISD
- NCES district ID
- 4838220
- Math proficiency
- 42% ▼ -10.00%
- Reading proficiency
- 42% ▼ -5.00%
- Median HH income
- $73,810
- Composite
- 38.44/100
- National rank
- #4197
- State rank
- #266 of 826 in TX
Livability — Royse City
- Score
- 75/100
- State rank
- #158
- US rank
- #4292
Category grades
Schools grade is shown separately in the Schools card above.
Census & demographics
- Census place
- Royse City, TX
- County
- Rockwall County · 132,930 people
- City population
- 48,739
- Metro
- Dallas-Fort Worth-Arlington, TX
- Population (ZIP)
- 48,739
- Household income
- $117,125
- Rent vs Own
- Severe rent burden
- 569.0
Population outlook (Rockwall County) Hauer SSP2
- Today (2025)
- 118,396 people
- By 2030
- 132,209 · +11.7%
- By 2040
- 159,538 · +34.7%
- By 2050
- 185,299 · +56.5%
- By 2075
- 243,489 · +105.7%
- By 2100
- 277,814 · +134.6%
Race, ethnicity, and origin ACS 2023
- Neighborhood character
- Diverse neighborhood (Simpson 0.57)
- Race & ethnicity
- White 60% Hispanic / Latino 25% Two or more races 12% Black 10% Asian 2%
- Hispanic origin (detail)
- Mexican 20%
- Common ancestry
- Slovak 2% Serbian 1% Lithuanian 1%
- Foreign-born
- 10% · Canada, Philippines, Jamaica
- Languages at home
- 80% English-only · Spanish 15% Other Indo-European 1%
Political lean MEDSL · Rockwall
- 2024 margin
- Solid R (+40.9) · D 29.1% · R 70.0%
- 2008→2024 swing
- +5.3pp toward D · 2008: -46.2pp · 2024: -40.9pp
- All cycles
- 2024: R+40.9 2020: R+37.7 2016: R+47.5 2012: R+53.3 2008: R+46.2
Not yet ingested
- Civics
- —
Market trends
- HPI YoY
- ▼ -71.10%
- Current HPI
- 212.8422
- Rent YoY
- ▼ -1.13%
- Metro
- Dallas-Fort Worth-Arlington, TX
- State GDP YoY
- ▲ 3.95%
- F500 in state
- 110
Industry mix (Fortune 500 HQ in TX)
| Industry | F500 HQs | Revenue |
|---|---|---|
| Energy | 16 | $1,198B |
|
||
| Technology | 5 | $198B |
|
||
| Engineering / Construction | 4 | $72B |
|
||
| Energy Services | 3 | $60B |
|
||
| Utilities | 3 | $41B |
|
||
| Healthcare | 2 | $330B |
|
||
Price history
+144.3% since first listed7 events — show timeline
- 2026-06-03 Pending — NTREIS
- 2026-05-20 Contingent — NTREIS
- 2026-05-12 Listed $219,900 NTREIS
- 2005-06-23 Sold (Public Records) — Public Records
- 2005-06-21 Sold (MLS) — NTREIS
- 2005-05-29 Listing Removed — NTREIS
- 2005-02-14 Listed $90,000 NTREIS
Property tax history
+5.3%/yrLatest (2025): $5,238 · +4.8% YoY. Source: county tax records.
Cash-flow waterfall
monthlySold comps — $/sqft
last 12 mo · ≤1 miLoading sold comps…