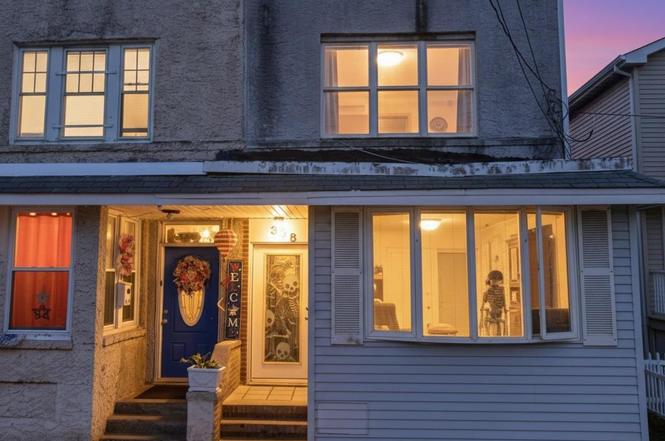
358 N Connecticut Ave · Atlantic City, NJ
Flood risk 9/10 · Severe
- FEMA flood zone
- AE
- Chance of flooding over 30 yrs
- 0.99%
- Est. flood insurance / yr
- $1,737 – $8,500
Fire risk 1/10 · Minimal
- Est. fire insurance / yr
- $526 – $976
Heat risk 9/10 · Severe
- Hot days now (above 94°F)
- 7 days/yr
- Hot days in 30 yrs
- 17 days/yr
Wind risk 8/10 · Major
- Chance of severe wind over 30 yrs
- 80.0%
Air-quality risk 3/10 · Minor
- Unhealthy air days now
- 2 days/yr
- Unhealthy air days in 30 yrs
- 3 days/yr
Risk factors via First Street. Map © Google.
Why this score? — see what drove the B- grade
The composite is a weighted blend of 9 inputs, each scored 0–100. Each bar is that input's sub-score; the figure is the points it added to the 100-point composite (weight × sub-score).
- Cash flow +30.0/30.0
- 1% rule +10.0/10.0
- DSCR +10.0/10.0
- ARV discount +7.5/15.0
- Rent growth +3.9/5.0
- Livability +2.8/5.0
- Condition / age +2.5/5.0
- Schools +1.4/10.0
- Appreciation +0.0/10.0
$124,000
🖨 Deal sheet 📄 Offer letter ✓ Due diligence
Listing remarks MLS
Opportunity Knocks! 4 bedroom, 1 Full Bath Colonial in highly sought neighborhood in Atlantic City. Buyer responsible for smoke cert & CCO
Key facts
- 1,742 sq ft lot
- Built 1900
- Listed 43 days
Property features AI
Finance
- Financial info: Fee simple ownership
Exterior
- Utilities: Public water; Public sewer
- Home design: Detached property; Estimated year built
- Construction: Block and vinyl siding construction; Block foundation
- Exterior features: Above-grade other structures
Interior
- Bedrooms: Four bedrooms on the upper level; Total of 4 bedrooms
- Bathrooms: One full bathroom
- Heating & cooling: Hot water heating; Natural gas heating and hot water
- Interior features: Estimated living area; Full basement
Neighborhood map
What this means for you Summary
Snapshot
- This is a 4-bed/1.0-bath single-family listed at $124k.
Deal economics
- At list price, monthly cash flow is $600 ($7k/yr) — positive.
- The deal already cash-flows at list — no discount required.
- Meets the 1% rule at list price ($3k rent vs $124k).
- Recommended offer: $120k (3.0% below list) — sets the bar for market timing.
- Cap rate 16.2% vs local median 3.7% in Atlantic City — top-decile yield for the area; either an underpriced asset or a hidden risk that comps aren't pricing in. Stress-test before assuming the spread holds.
Location & tenants
- Location reads 55/100 on livability (#525 in NJ) — a working-class tenant base; expect higher turnover. Strengths: health & safety A; Watch: commute D, schools F, crime F.
- Atlantic City School District (urban): math 9% / reading 26% proficiency, ranked #454 of 472 in NJ (top 96%) — low school quality limits family demand, transient renter base, plan for 1-2y turnover; 85% free/reduced lunch — lower-income household profile, screen leases tightly.
- Market conditions: Rents rising fast (+5.5%/yr); 482 active listings in the ZIP; 13 comparable units currently listed for rent nearby; rentals at typical pace (median 21d on market — plan ~3-4 weeks tenant-placement turnaround); lower-income renter base — watch delinquency; 672 units permitted in Atlantic County in 2024 (258 in 5+ unit buildings).
- At $2,507/mo this rent would consume 73% of the median local household income ($41k/yr) (locally 3414% of renters already pay >50% of income on rent) — very limited rent-growth headroom before tenants either downsize or default.
Forward outlook
- Local home prices are declining (-3.0%/yr); year-one equity from $857 of loan paydown is wiped out by about $4k of value loss. Plan a longer hold.
- Atlantic County population projected at -12% by 2050 — secular population decline; favor cash flow + early exit over multi-decade hold.
- At projected returns (-3.0% appreciation + 5.5% rent growth), your $35k cash investment doubles in ~5 years — after that, you're playing with house money.
Negotiation context
- It's been on market 43 days — a 3% lower offer ($120k) is reasonable based on typical stale-listing flexibility.
- 8 sale attempts since 13y ago with the ask held roughly flat each time — persistent listings suggest the price (not the market) is what's stuck; bring a comps-based counter.
Risks & watch-outs
- Watch-outs: flood insurance adds $427/mo; built in 1900 — expect roof / HVAC / electrical / plumbing capex.
- Climate carrying-cost: in FEMA flood zone AE (mandatory federal flood insurance); severe wind risk, 80% chance of damaging wind over 30y; extreme-heat days projected 7→17/yr by 2055 (HVAC capex compounding) — expect insurance premiums to compound above CPI over the hold.
Questions for the listing agent
- It's been on market 43 days. Have you received any prior offers? Is the seller open to a 3% concession, seller financing, or rate buy-down credit?
- Built in 1900 — when were the roof, HVAC, electrical panel, plumbing, and water heater last replaced?
- What's the actual annual flood-insurance premium (NFIP or private), and is the property in a SFHA with mandatory coverage?
- Is there a deadline driving the sale (1031 exchange, divorce, estate, relocation)? That informs how much negotiation room exists.
- Schools are F-rated, which usually means shorter tenancies and higher turnover. Who's the typical renter profile here, and what's been the actual vacancy rate?
- Crime grade is F in this area — have there been break-ins, vandalism, or insurance claims at this property in the last 3 years? What carrier currently insures it and at what premium?
- What's the average days-on-market for RENTAL listings here right now (not sales)? A rising rental-DOM trend means longer vacancies and softer asking-rent achievability than the comps imply.
- What's the recent tenant-quality profile in this submarket — average credit score on applications, eviction rate, late-payment / NSF rate, and stable-employment percentage? A property-management company in the area should have these aggregated.
- How much new for-sale + rental construction is in the pipeline within 1–3 miles? Heavy new supply typically softens prices + rents 12–24 months out; constrained supply supports both.
Investment metrics
- 1% rule
- 2.02% ✓
- Cap rate
- 16.23%
- Cash-on-cash
- 35.47%
- DSCR
- 2.58
- GRM
- 4.1
CMA / ARV
- ARV (on-the-fly)
- $305,950
- Comps found
- 12
Show comp detail 12 sales within ~0.75 mi
| Address | Dist | Beds/Ba | Sqft | Sold | Price | $/sf | Match |
|---|---|---|---|---|---|---|---|
| 500B Caspian Ave | 0.11mi | 3/1.5 (-1) | 1,374 (-5%) | 16mo | $311,999 | $227 | 65 |
| 407 Grammercy Pl | 0.31mi | 3/1.5 (-1) | 1,416 (-2%) | 13mo | $345,000 | $244 | 64 |
| 103 Chesapeake Bay Ct | 0.32mi | 3/2.0 (-1) | 1,434 (-1%) | 16mo | $300,000 | $209 | 61 |
| 114 N Maryland Ave | 0.33mi | 4/2.5 | 1,422 (-2%) | 17mo | $290,000 | $204 | 61 |
| 710 Sewell Ave | 0.18mi | 3/1.5 (-1) | 1,546 (+7%) | 16mo | $162,500 | $105 | 61 |
| 126 N New Hampshire Ave | 0.38mi | 3/2.5 (-1) | 1,452 (+0%) | 16mo | $501,495 | $345 | 58 |
| 304 Madison Ave | 0.30mi | 3/2.5 (-1) | 1,452 (+0%) | 22mo | $240,000 | $165 | 56 |
| 34 N Congress Ave Ave | 0.32mi | 3/2.0 (-1) | 1,340 (-8%) | 9mo | $275,000 | $205 | 56 |
| 17 Clipper Ct | 0.20mi | 3/2.5 (-1) | 1,258 (-13%) | 3mo | $265,000 | $211 | 55 |
| 531 Melrose Ave | 0.08mi | 3/2.0 (-1) | 1,568 (+8%) | 23mo | $290,000 | $185 | 54 |
| 611 N Connecticut Ave | 0.25mi | 3/2.5 (-1) | 1,592 (+10%) | 9mo | $420,000 | $264 | 54 |
| 26 N New Hampshire Ave | 0.42mi | 3/2.5 (-1) | 1,500 (+3%) | 22mo | $490,000 | $327 | 46 |
Match score weights: distance 35% · size 25% · config 20% · recency 20%. Top-matched comps best support the ARV.
Projected returns pro-forma
-3.0% appreciation · 5.52% rent growth · sell at horizon
- IRR
- 17.1%
- Equity multiple
- 1.72×
- Total profit
- $24,988
- Equity at exit
- $18,489
- IRR
- 28.0%
- Equity multiple
- 3.90×
- Total profit
- $100,575
- Equity at exit
- $10,721
Cash invested: $34,720 (down + closing). Projections, not guarantees.
Landlord ↔ Tenant lean methodology
- Overall (STATE)
- 21 Tenant-Leaning
- State New Jersey
- 21 Tenant-Leaning · D+6
- County
- — inherits STATE
- City
- — inherits STATE
ZIP-level market 08401
- Home prices YoY
- -7.0%
- Rents YoY
- 5.5%
- Active inventory
- 482
- Price-to-rent
- 4.1×
Monthly cashflow live
- Estimated rent
- $2,507 high interval (Pro) →
- Mortgage (P&I)
- −$650
- Tax from tax record
- −$252 /mo · $3,028/yr
- Insurance
- −$52
- Flood insurance flood zone
- −$427 /mo · $5,118/yr
- HOA
- −$0
- Vacancy / Maint / Mgmt
- −$527
- Net cashflow
- $600
Break-even live
UW: 25.0% down · 7.5% · 30yr · 1.5% tax · 5.0% vac · 8.0% maint · 8.0% mgmt
Financing live
Cash to close
- Down payment
- $31,000
- Closing costs
- $3,720
- Reserves months
- —
- Total cash needed
- —
Loan-product check · same deal, 3 products live
Conventional
25% down · 7.5% · 30yr
- Down + closing
- —
- Monthly P&I
- —
- Monthly cashflow
- —
- DSCR
- —
- Eligible?
- —
Personal DTI + credit; lowest rate.
DSCR
20% down · 8.5% · 30yr
- Down + closing
- —
- Monthly P&I
- —
- Monthly cashflow
- —
- DSCR
- —
- Eligible?
- —
No personal income docs; deal must DSCR.
Hard money
10% down · 12.0% · 12mo
- Down + closing
- —
- Monthly P&I
- —
- Monthly cashflow
- —
- DSCR
- —
- Eligible?
- —
Short-term bridge; refi at stabilization.
Rent comps 13 comps
| Address | Beds | Baths | Sqft | Rent | $/sqft | DOM | Units | Dist |
|---|---|---|---|---|---|---|---|---|
| 10 Starboard Ct #10 Atlantic City, NJ | 3.0 | 2.5 | 1680 | $2,400 | $1.43 | 13d | 1 | 0.32mi |
| 31 N Virginia Ave Atlantic City, NJ | 3.0 | 1.0 | 725 | $2,230 | $3.08 | 13d | 1 | 0.40mi |
| 326 N Tennessee Ave Unit 2 Atlantic City, NJ | 3.0 | 1.0 | 1815 | $2,200 | $1.21 | 13d | 1 | 0.59mi |
| 122 Dewey Pl Atlantic City, NJ | 3.0 | 1.0 | 1250 | $2,700 | $2.16 | 21d | 1 | 0.68mi |
| 1724 Atlantic Ave Unit A1 Atlantic City, NJ | 3.0 | 1.0 | 950 | $2,300 | $2.42 | 21d | 1 | 0.94mi |
| 905 Keener Ave Atlantic City, NJ | 3.0 | 1.0 | 1059 | $1,900 | $1.79 | 21d | 1 | 1.09mi |
| 2015 Grant Ave Atlantic City, NJ | 3.0 | 1.0 | 1056 | $2,325 | $2.20 | 21d | 1 | 1.10mi |
| 2021 Grant Ave Atlantic City, NJ | 3.0 | 1.0 | 1011 | $2,350 | $2.32 | 21d | 1 | 1.11mi |
| 1216 N Ohio Ave Atlantic City, NJ | 5.0 | 2.0 | 1355 | $2,900 | $2.14 | 21d | 1 | 1.11mi |
| 4 Italy Ter Atlantic City, NJ | 3.0 | 1.0 | 1000 | $2,300 | $2.30 | 21d | 1 | 1.30mi |
| 1510 N Arkansas Ave Atlantic City, NJ | 3.0 | 2.0 | 1008 | $2,750 | $2.73 | 13d | 1 | 1.42mi |
| 1523 N Arkansas Ave Atlantic City, NJ | 3.0 | 2.0 | 984 | $2,500 | $2.54 | 21d | 1 | 1.45mi |
| 1532 Emerson Pl Fl Front Atlantic City, NJ | 3.0 | 2.0 | 1200 | $2,400 | $2.00 | 13d | 1 | 1.46mi |
Listing history 21 events
-
2026-05-22status Pending
-
2026-05-07historical Active Under Contract
Show marketing remark (144 chars)
Opportunity Knocks! 4 bedroom, 1 Full Bath Colonial in highly sought neighborhood in Atlantic City. Buyer responsible for smoke cert & CCO
-
2026-05-07status Pending 144-char remark
Show marketing remark (144 chars)
Opportunity Knocks! 4 bedroom, 1 Full Bath Colonial in highly sought neighborhood in Atlantic City. Buyer responsible for smoke cert & CCO
-
2026-04-10status Active
Show marketing remark (144 chars)
Opportunity Knocks! 4 bedroom, 1 Full Bath Colonial in highly sought neighborhood in Atlantic City. Buyer responsible for smoke cert & CCO
-
2026-04-10status Active 144-char remark
Show marketing remark (144 chars)
Opportunity Knocks! 4 bedroom, 1 Full Bath Colonial in highly sought neighborhood in Atlantic City. Buyer responsible for smoke cert & CCO
-
2026-03-31soldstatus $150,000
-
2026-03-16historical Withdrawn/Temp Off Market 145-char remark
Show marketing remark (145 chars)
Opportunity Knocks! 4 Bedroom, 1 Full Bath Colonial in highly sought neighborhood of Atlantic City. Buyer responsible for Smoke Cert & CCO
-
2026-02-13historical Active Under Contract
Show marketing remark (144 chars)
Opportunity Knocks! 4 bedroom, 1 Full Bath Colonial in highly sought neighborhood in Atlantic City. Buyer responsible for smoke cert & CCO
-
2026-02-13status Pending 144-char remark
Show marketing remark (144 chars)
Opportunity Knocks! 4 bedroom, 1 Full Bath Colonial in highly sought neighborhood in Atlantic City. Buyer responsible for smoke cert & CCO
-
2026-01-28$124,000 Active
Show marketing remark (145 chars)
Opportunity Knocks! 4 Bedroom, 1 Full Bath Colonial in highly sought neighborhood of Atlantic City. Buyer responsible for Smoke Cert & CCO
-
2026-01-28$124,000 Active 144-char remark
Show marketing remark (145 chars)
Opportunity Knocks! 4 Bedroom, 1 Full Bath Colonial in highly sought neighborhood of Atlantic City. Buyer responsible for Smoke Cert & CCO
-
2026-01-28$124,000 Active 145-char remark
Show marketing remark (145 chars)
Opportunity Knocks! 4 Bedroom, 1 Full Bath Colonial in highly sought neighborhood of Atlantic City. Buyer responsible for Smoke Cert & CCO
-
2019-07-22historical Under Contract
-
2019-07-15historical
-
2019-06-11price $49,900
-
2019-04-04$54,900 Active
-
2019-03-21historical
-
2018-12-08price $69,900
-
2018-09-20$85,000 Active
-
2013-07-03historical
-
2013-03-05$135,000
ⓘ Source: listings_history table (triggers on properties + properties_extension) + one-shot
backfill from property_details.listing_events for pre-trigger history.
Tax reassessment forecast NJ · Partial reset (capped growth)
- Current annual tax
- $3,028 · $252/mo
- Projected year-2 tax
- $3,058 · $255/mo
- Expected delta
- +$30/yr (+$2/mo · 1.0%)
ⓘ Screening estimate from a state-policy table — verify with the county assessor before closing.
Climate risk First Street
- Flood 9/10 Extreme FEMA zone AE · 99% chance over 30 yrs
- Wildfire 1/10 Low
- Heat 9/10 Extreme 7 d/yr ≥94°F today · 17 d/yr by 30 yrs out
- Wind 8/10 Severe 80% chance of damaging wind over 30 yrs
- Air quality 3/10 Moderate 2 unhealthy d/yr today · 3 by 30 yrs out
Nearby sold comps map
Loading sold comps map…
Walkable amenities ~0.75 mi
Loading nearby amenities…
Taxation est. · year 1
- Rental income
- $30,087
- − Mortgage interest
- −$6,946
- − Property taxes
- −$3,028
- − Insurance
- −$5,738
- − Repairs & maintenance
- −$2,407
- − Management
- −$2,407
- − Depreciation
- −$3,607
- Taxable income
- $5,952
- Est. tax owed @ 24.0%
- −$1,429
- After-tax cash flow
- $5,770/yr
For passive investors: Depreciation is non-cash, so a rental often shows a tax loss while cash-flowing — sheltering income. Rental losses are passive: they offset passive income freely, and up to $25,000/yr can offset ordinary (W-2) income if you actively participate and your MAGI is under $100k (phasing out to $0 by $150k); unused losses carry forward. On sale, claimed depreciation is recaptured at up to 25%, and gains may owe capital-gains tax (a 1031 exchange can defer both). Figures are a year-1 estimate at your 24.0% rate — not tax advice; consult a CPA.
Schools (NCES district)
- District
- Atlantic City School District
- NCES district ID
- 3400960
- Math proficiency
- 9% ▼ -12.00%
- Reading proficiency
- 26% ▼ -6.00%
- Median HH income
- $27,842
- Composite
- 13.66/100
- National rank
- #9504
- State rank
- #454 of 472 in NJ
Livability — Atlantic City
- Score
- 55/100
- State rank
- #525
- US rank
- #23095
Category grades
Schools grade is shown separately in the Schools card above.
Census & demographics
- Census place
- Atlantic City, NJ
- County
- Atlantic County · 143,611 people
- City population
- 38,925
- Metro
- Atlantic City-Hammonton, NJ
- Population (ZIP)
- 38,925
- Household income
- $41,126
- Rent vs Own
- Severe rent burden
- 3414.0
Population outlook (Atlantic County) Hauer SSP2
- Today (2025)
- 268,948 people
- By 2030
- 264,497 · -1.7%
- By 2040
- 252,261 · -6.2%
- By 2050
- 237,846 · -11.6%
- By 2075
- 210,650 · -21.7%
- By 2100
- 180,234 · -33.0%
Race, ethnicity, and origin ACS 2023
- Neighborhood character
- Highly diverse neighborhood (Simpson 0.75)
- Race & ethnicity
- Hispanic / Latino 32% Black 32% Asian 16% White 16% Two or more races 11% Native American 2%
- Hispanic origin (detail)
- Mexican 10% Puerto Rican 8% Dominican 8%
- Common ancestry
- Romanian 1% Scotch-Irish 1%
- Foreign-born
- 29% · Canada, Vietnam, Jamaica
- Languages at home
- 52% English-only · Spanish 30% Other Indo-European 8% Vietnamese 3%
Political lean MEDSL · Atlantic
- 2024 margin
- Toss-up / Even · D 47.7% · R 50.7% · Other 1.6%
- 2008→2024 swing
- -18.1pp toward R · 2008: 15.1pp · 2024: -3.0pp
- All cycles
- 2024: R+3.0 2020: D+6.7 2016: D+6.2 2012: D+17.2 2008: D+15.1
Not yet ingested
- Civics
- —
Market trends
- HPI YoY
- ▼ -26.82%
- Current HPI
- 353.7827
- Rent YoY
- ▲ 5.52%
- Metro
- Atlantic City-Hammonton, NJ
- State GDP YoY
- ▲ 2.05%
- F500 in state
- 34
Industry mix (Fortune 500 HQ in NJ)
| Industry | F500 HQs | Revenue |
|---|---|---|
| Consumer Goods | 3 | $31B |
|
||
| Pharmaceuticals | 2 | $153B |
|
||
| Technology | 2 | $21B |
|
||
| Insurance | 2 | $20B |
|
||
| Healthcare | 2 | $19B |
|
||
| Financial Services | 1 | $70B |
|
||
Price history
+11.1% since first listed21 events — show timeline
- 2026-05-22 Pending — BRIGHT MLS
- 2026-05-07 Contingent — BRIGHT MLS
- 2026-05-07 Pending — MOMLS
- 2026-04-10 Relisted — BRIGHT MLS
- 2026-04-10 Relisted — MOMLS
- 2026-03-31 Sold (Public Records) $150,000 Public Records
- 2026-03-16 Delisted — CMCMLS
- 2026-02-13 Contingent — BRIGHT MLS
- 2026-02-13 Pending — MOMLS
- 2026-01-28 Listed $124,000 CMCMLS
- 2026-01-28 Listed $124,000 MOMLS
- 2026-01-28 Listed $124,000 BRIGHT MLS
- 2019-07-22 Contingent — SJSRMLS
- 2019-07-15 Listing Removed — SJSRMLS
- 2019-06-11 Price Changed $49,900 SJSRMLS
- 2019-04-04 Listed $54,900 SJSRMLS
- 2019-03-21 Listing Removed — SJSRMLS
- 2018-12-08 Price Changed $69,900 SJSRMLS
- 2018-09-20 Listed $85,000 SJSRMLS
- 2013-07-03 Listing Removed — SJSRMLS
- 2013-03-05 Listed $135,000 SJSRMLS
Property tax history
-3.6%/yrLatest (2025): $3,028 · -2.1% YoY. Source: county tax records.
Cash-flow waterfall
monthlySold comps — $/sqft
last 12 mo · ≤1 miLoading sold comps…