4333 Pentz Rd #29 · Paradise, CA
Flood risk 1/10 · Minimal
- FEMA flood zone
- X (unshaded)
- Chance of flooding over 30 yrs
- 0.0%
- Est. flood insurance / yr
- $507 – $1,088
Fire risk 8/10 · Major
- Est. fire insurance / yr
- $659 – $1,223
Heat risk 6/10 · Moderate
- Hot days now (above 102°F)
- 7 days/yr
- Hot days in 30 yrs
- 19 days/yr
Wind risk 1/10 · Minimal
- Chance of severe wind over 30 yrs
- —
Air-quality risk 10/10 · Severe
- Unhealthy air days now
- 37 days/yr
- Unhealthy air days in 30 yrs
- 40 days/yr
Risk factors via First Street. Map © Google.
Why this score? — see what drove the C grade
The composite is a weighted blend of 9 inputs, each scored 0–100. Each bar is that input's sub-score; the figure is the points it added to the 100-point composite (weight × sub-score).
- Cash flow +24.2/30.0
- DSCR +7.8/10.0
- ARV discount +7.5/15.0
- 1% rule +6.3/10.0
- Condition / age +4.2/5.0
- Rent growth +4.1/5.0
- Livability +3.1/5.0
- Schools +1.6/10.0
- Appreciation +0.0/10.0
$171,000
🖨 Deal sheet 📄 Offer letter ✓ Due diligence
Listing remarks
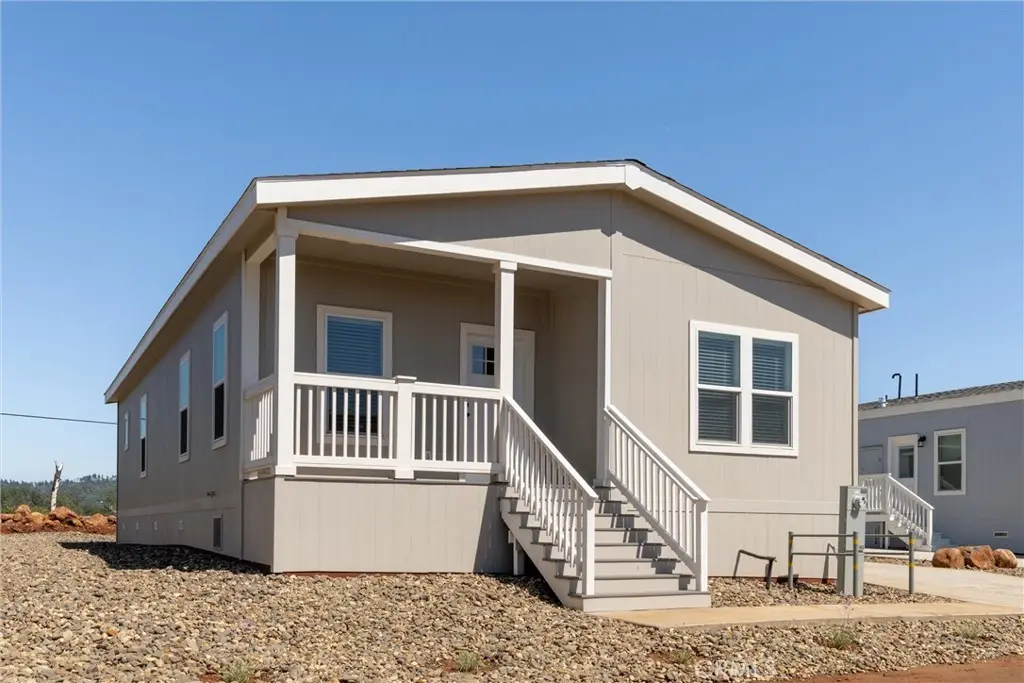
Sales Tax Included. Take advantage of 2 months free rent, beautiful views of the valley, generous lot sizes, wide concrete driveways and comfortable porches to enjoy the early mornings and evening sun sets. The Lime Saddle Mobile Home Park is an all ages community located just South of Paradise adjacent to the Sierra Del Sol Gated Community. This brand new 2025 Champion home features a spacious layout with 3 bedrooms and 2 bathrooms at 1422 square feet and comes with a full kitchen appliance package, carpet and linoleum flooring, and washer/dryer hook-ups. We even welcome your four-legged family members. Pet restrictions apply. Ask about our financing options – affordable down and mon
Key facts
- Comfortable porches
- Brand new home
- Generous lot sizes
Tags
Property features AI
Finance
- Other: Pets allowed with breed restrictions; Accessibility: Parking
- Financial info: Land lease: $600 monthly (park)
- HOA & community: Part of an association; Community features: Foothills; Park name: Lime Saddle MHP; Manager approval required
Exterior
- Parking: Driveway; Parking available; Park: Lime Saddle MHP; Private road frontage
- Utilities: Propane available; Sewer connected (private sewer); Electricity connected; Public/District water
- Home design: Single-story (1 total story); Entry on Pentz Road; Mobile home model: Harbor Cove; Double body type; Mobile home remains; Mobile dimensions approx. 27' x 56'
- Construction: Cement board exterior skirt; Asphalt roof
- Exterior features: Porch; Has patio; Landscaped lot; Cement board skirt; Asphalt roof
Interior
- Kitchen: Quartz counters
- Bedrooms: Entry at level 1
- Flooring: Carpet; Laminate
- Bathrooms: 2 full bathrooms
- Heating & cooling: Central cooling; Central furnace heating
- Interior features: Crown moldings; High (9'+) ceilings; Ceiling fan; Pantry; Two staircases; Open floor plan; Quartz counters
- Laundry & utility: Washer hookup; Electric dryer hookup; Has laundry
Neighborhood map
What this means for you Summary
Snapshot
- This is a 3-bed/2.0-bath manufactured listed at $171k. Condition is rated good.
Deal economics
- At list price, monthly cash flow is $340 ($4k/yr) — positive.
- The deal already cash-flows at list — no discount required.
- Meets the 1% rule at list price ($2k rent vs $171k).
- Recommended offer: $166k (3.0% below list) — sets the bar for market timing.
- Cap rate 8.7% vs local median 2.6% in Paradise — top-decile yield for the area; either an underpriced asset or a hidden risk that comps aren't pricing in. Stress-test before assuming the spread holds.
Location & tenants
- Location reads 61/100 on livability (#541 in CA) — a middle-class / working-renter tenant base. Strengths: schools A-, housing B+, crime B; Watch: employment C-, amenities F, commute F.
- Golden Feather Union Elementary (rural): math 11% / reading 20% proficiency, ranked #1,295 of 1,400 in CA (top 92%) — low school quality limits family demand, transient renter base, plan for 1-2y turnover; 72% free/reduced lunch — lower-income household profile, screen leases tightly.
- Market conditions: Rents rising fast (+6.4%/yr); 481 active listings in the ZIP; 946 units permitted in Butte County in 2024 (254 in 5+ unit buildings).
- This rent runs 33% of the median local income ($69k/yr) — at the standard rent-burdened threshold; future hikes will face affordability resistance.
Forward outlook
- Local home prices are declining (-3.0%/yr); year-one equity from $1k of loan paydown is wiped out by about $5k of value loss. Plan a longer hold.
- Butte County population projected at +10% by 2050 — modest demand growth; plan on rents tracking national, not racing it.
- At projected returns (-3.0% appreciation + 6.4% rent growth), your $48k cash investment doubles in ~9 years — after that, you're playing with house money.
Negotiation context
- It's been on market 39 days — a 3% lower offer ($166k) is reasonable based on typical stale-listing flexibility.
Risks & watch-outs
- Climate carrying-cost: severe wildfire risk; extreme-heat days projected 7→19/yr by 2055 (HVAC capex compounding) — expect insurance premiums to compound above CPI over the hold.
Questions for the listing agent
- It's been on market 39 days. Have you received any prior offers? Is the seller open to a 3% concession, seller financing, or rate buy-down credit?
- Is there a deadline driving the sale (1031 exchange, divorce, estate, relocation)? That informs how much negotiation room exists.
- Schools are A-rated — typically a magnet for longer-tenancy family renters. What's the average tenant stay here, and is there a school-zone premium baked into asking?
- What's the average days-on-market for RENTAL listings here right now (not sales)? A rising rental-DOM trend means longer vacancies and softer asking-rent achievability than the comps imply.
- What's the recent tenant-quality profile in this submarket — average credit score on applications, eviction rate, late-payment / NSF rate, and stable-employment percentage? A property-management company in the area should have these aggregated.
- How much new for-sale + rental construction is in the pipeline within 1–3 miles? Heavy new supply typically softens prices + rents 12–24 months out; constrained supply supports both.
Investment metrics
- 1% rule
- 1.13% ✓
- Cap rate
- 8.68%
- Cash-on-cash
- 8.53%
- DSCR
- 1.38
- GRM
- 7.4
CMA / ARV
No comps found within radius.
Projected returns pro-forma
-3.0% appreciation · 6.37% rent growth · sell at horizon
- IRR
- 0.4%
- Equity multiple
- 1.02×
- Total profit
- $747
- Equity at exit
- $25,497
- IRR
- 13.2%
- Equity multiple
- 2.22×
- Total profit
- $58,380
- Equity at exit
- $14,785
Cash invested: $47,880 (down + closing). Projections, not guarantees.
Landlord ↔ Tenant lean methodology
- Overall (STATE)
- 18 Strongly Tenant-Friendly
- State California
- 18 Strongly Tenant-Friendly · D+13
- County
- — inherits STATE
- City
- — inherits STATE
ZIP-level market 95969
- Rents YoY
- 6.4%
- Active inventory
- 481
- Price-to-rent
- 7.4×
Monthly cashflow live
- Estimated rent
- $1,927 medium interval (Pro) →
- Mortgage (P&I)
- −$897
- Tax est. 1.5%
- −$214 /mo · $2,565/yr
- Insurance
- −$71
- HOA
- −$0
- Vacancy / Maint / Mgmt
- −$405
- Net cashflow
- $340
Break-even live
UW: 25.0% down · 7.5% · 30yr · 1.5% tax · 5.0% vac · 8.0% maint · 8.0% mgmt
Financing live
Cash to close
- Down payment
- $42,750
- Closing costs
- $5,130
- Reserves months
- —
- Total cash needed
- —
Loan-product check · same deal, 3 products live
Conventional
25% down · 7.5% · 30yr
- Down + closing
- —
- Monthly P&I
- —
- Monthly cashflow
- —
- DSCR
- —
- Eligible?
- —
Personal DTI + credit; lowest rate.
DSCR
20% down · 8.5% · 30yr
- Down + closing
- —
- Monthly P&I
- —
- Monthly cashflow
- —
- DSCR
- —
- Eligible?
- —
No personal income docs; deal must DSCR.
Hard money
10% down · 12.0% · 12mo
- Down + closing
- —
- Monthly P&I
- —
- Monthly cashflow
- —
- DSCR
- —
- Eligible?
- —
Short-term bridge; refi at stabilization.
Listing history 17 events
-
2026-06-19days on market $171,000 Active 39 DOM
-
2026-06-18days on market $171,000 Active 38 DOM
-
2026-06-17days on market $171,000 Active 37 DOM
-
2026-06-16days on market $171,000 Active 36 DOM
-
2026-06-15days on market $171,000 Active 35 DOM
-
2026-06-14days on market $171,000 Active 33 DOM
-
2026-06-13days on market $171,000 Active 32 DOM
-
2026-06-10days on market $171,000 Active 30 DOM
-
2026-06-09days on market $171,000 Active 29 DOM
-
2026-06-08days on market $171,000 Active 28 DOM
-
2026-06-07days on market $171,000 Active 27 DOM
-
2026-06-03days on market $171,000 Active 23 DOM
-
2026-06-02days on market $171,000 Active 22 DOM
-
2026-06-01days on market $171,000 Active 21 DOM
-
2026-05-31days on market $171,000 Active 20 DOM
-
2026-05-30days on market $171,000 Active 19 DOM
-
2026-05-11$162,000 Active
ⓘ Source: listings_history table (triggers on properties + properties_extension) + one-shot
backfill from property_details.listing_events for pre-trigger history.
Climate risk First Street
- Flood 1/10 Low FEMA zone X (unshaded) · 0% chance over 30 yrs
- Wildfire 8/10 Severe
- Heat 6/10 Major 7 d/yr ≥102°F today · 19 d/yr by 30 yrs out
- Wind 1/10 Low
- Air quality 10/10 Extreme 37 unhealthy d/yr today · 40 by 30 yrs out
Nearby sold comps map
Loading sold comps map…
Walkable amenities ~0.75 mi
Loading nearby amenities…
Taxation est. · year 1
- Rental income
- $23,120
- − Mortgage interest
- −$9,579
- − Property taxes
- −$2,565
- − Insurance
- −$855
- − Repairs & maintenance
- −$1,850
- − Management
- −$1,850
- − Depreciation
- −$4,975
- Taxable income
- $1,447
- Est. tax owed @ 24.0%
- −$347
- After-tax cash flow
- $3,736/yr
For passive investors: Depreciation is non-cash, so a rental often shows a tax loss while cash-flowing — sheltering income. Rental losses are passive: they offset passive income freely, and up to $25,000/yr can offset ordinary (W-2) income if you actively participate and your MAGI is under $100k (phasing out to $0 by $150k); unused losses carry forward. On sale, claimed depreciation is recaptured at up to 25%, and gains may owe capital-gains tax (a 1031 exchange can defer both). Figures are a year-1 estimate at your 24.0% rate — not tax advice; consult a CPA.
Condition & rehab AI · 27 photos
This brand new 2025 Champion home is move-in ready with modern appliances, marble countertops, and hardwood flooring. It offers a good condition score and is ready for immediate occupancy.
Value-add opportunities
- Both Painting exterior and interior walls — Fresh paint enhances curb appeal and interior aesthetics
- Both Replace carpet with hardwood flooring in bedrooms — Hardwood flooring is more durable and adds value
- Both Install smart home devices — Smart home devices improve convenience and energy efficiency
Renovation cost estimate screening
Value-add ROI direction
- Both Painting exterior and interior walls — Fresh paint enhances curb appeal and interior aesthetics ↑
- Both Replace carpet with hardwood flooring in bedrooms — Hardwood flooring is more durable and adds value ↑
- Both Install smart home devices — Smart home devices improve convenience and energy efficiency ↑
ⓘ Cost ranges are severity-bucket heuristics (US national rule-of-thumb). Get contractor quotes + a written scope before underwriting a rehab budget.
Schools (NCES district)
- District
- Golden Feather Union Elementary
- NCES district ID
- 0615480
- Math proficiency
- 11% ▬ 0.00%
- Reading proficiency
- 20% ▬ 0.00%
- Median HH income
- $36,377
- Composite
- 16.29/100
- National rank
- #14273
- State rank
- #1295 of 1400 in CA
Livability — Paradise
- Score
- 61/100
- State rank
- #541
- US rank
- #18039
Category grades
Schools grade is shown separately in the Schools card above.
Census & demographics
- County
- Butte County · 175,030 people
- City population
- 8,339
- Metro
- Chico, CA
- Population (ZIP)
- 8,339
- Household income
- $69,067
- Rent vs Own
- Severe rent burden
- 218.0
Population outlook (Butte County) Hauer SSP2
- Today (2025)
- 237,527 people
- By 2030
- 243,804 · +2.6%
- By 2040
- 253,899 · +6.9%
- By 2050
- 262,561 · +10.5%
- By 2075
- 283,709 · +19.4%
- By 2100
- 282,689 · +19.0%
Race, ethnicity, and origin ACS 2023
- Neighborhood character
- Predominantly White (82%)
- Race & ethnicity
- White 82% Two or more races 11% Hispanic / Latino 8% Asian 2% Native American 1%
- Hispanic origin (detail)
- Mexican 7%
- Common ancestry
- Iranian 7% Lithuanian 4% Italian 2%
- Foreign-born
- 3% · Canada, China
- Languages at home
- 94% English-only · Spanish 4% Chinese 1%
Political lean MEDSL · Butte
- 2024 margin
- Toss-up / Even · D 46.8% · R 49.9% · Other 3.3%
- 2008→2024 swing
- -5.5pp toward R · 2008: 2.4pp · 2024: -3.1pp
- All cycles
- 2024: R+3.1 2020: D+1.7 2016: R+4.0 2012: R+3.9 2008: D+2.4
Not yet ingested
- Civics
- —
Market trends
- HPI YoY
- ▼ -410.40%
- Current HPI
- 102.8367
- Rent YoY
- ▲ 6.37%
- Metro
- Chico, CA
- State GDP YoY
- ▲ 3.21%
- F500 in state
- 116
Industry mix (Fortune 500 HQ in CA)
| Industry | F500 HQs | Revenue |
|---|---|---|
| Technology | 27 | $1,492B |
|
||
| Financial Services | 3 | $174B |
|
||
| Retail | 3 | $44B |
|
||
| Insurance | 3 | $26B |
|
||
| Media / Entertainment | 2 | $115B |
|
||
| Pharmaceuticals / Biotech | 2 | $62B |
|
||
Price history
1 event — show timeline
- 2026-05-11 Listed $162,000 CRMLS
Cash-flow waterfall
monthlySold comps — $/sqft
last 12 mo · ≤1 miLoading sold comps…