7 W 21st St · Chester, PA
Flood risk 1/10 · Minimal
- FEMA flood zone
- X (unshaded)
- Chance of flooding over 30 yrs
- 0.0%
- Est. flood insurance / yr
- $473 – $860
Fire risk 1/10 · Minimal
- Est. fire insurance / yr
- $511 – $949
Heat risk 7/10 · Major
- Hot days now (above 103°F)
- 7 days/yr
- Hot days in 30 yrs
- 15 days/yr
Wind risk 6/10 · Moderate
- Chance of severe wind over 30 yrs
- 27.0%
Air-quality risk 3/10 · Minor
- Unhealthy air days now
- 2 days/yr
- Unhealthy air days in 30 yrs
- 4 days/yr
Risk factors via First Street. Map © Google.
Why this score? — see what drove the B- grade
The composite is a weighted blend of 9 inputs, each scored 0–100. Each bar is that input's sub-score; the figure is the points it added to the 100-point composite (weight × sub-score).
- Cash flow +25.9/30.0
- ARV discount +12.0/15.0
- DSCR +8.7/10.0
- 1% rule +8.6/10.0
- Rent growth +4.2/5.0
- Livability +3.7/5.0
- Condition / age +2.5/5.0
- Schools +0.8/10.0
- Appreciation +0.0/10.0
$120,000
🖨 Deal sheet (PDF) 📄 Offer letter ✓ Due diligence
Listing remarks MLS
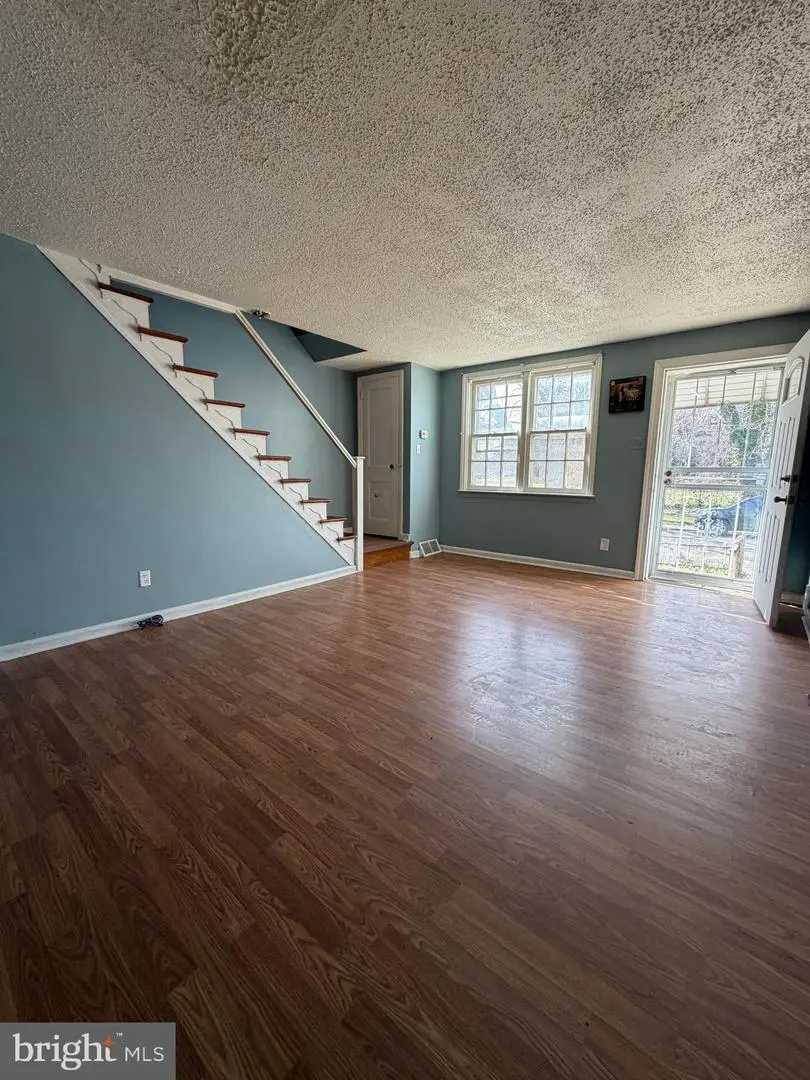
Lots of potential with this bright row home located right off of 352, to Brookhaven, Subaru Park & the Philly airport. Whether you're looking for your next home or investment property this property is a great fit for either buyer. Chester Housing Authority has a real need for affordable housing and is offering over $1800 per month for 3BR homes After some very minor improvements this home is ready for a new homeowner or a new tenant. The main floor has a bright bay window in the living room and luxury vinyl flooring. The dining area off off the kitchen has a sliding glass door that leads out to the deck. The upper level is equally bright and spacious with 3 nice sized bedrooms & a hall closet. The bathroom is all tile with a charming skylight. The full basement is dry and finishable with a walk-out to the off street parking below the rear deck. The front has a fenced in yard and a quaint patio area.
Key facts
- Built 1948
- Listed 86 days
Neighborhood map
What this means for you Summary
Snapshot
- This is a 3-bed/1.0-bath townhouse listed at $120k.
Deal economics
- At list price, monthly cash flow is $294 ($4k/yr) — positive.
- The deal already cash-flows at list — no discount required.
- Meets the 1% rule at list price ($2k rent vs $120k).
- Recommended offer: $113k (6.0% below list) — sets the bar for market timing.
- Cap rate 9.2% vs local median 7.5% in Chester — meaningfully above typical; check what's discounted (condition, days-on-market, listing class) to confirm the premium yield is real.
Location & tenants
- Location reads 73/100 on livability (#540 in PA) — a middle-class / working-renter tenant base. Strengths: amenities A+, commute A+, cost of living A+; Watch: schools F, crime F, employment F.
- Chester-Upland SD (suburban): math 4% / reading 17% proficiency, ranked #533 of 539 in PA (top 99%) — low school quality limits family demand, transient renter base, plan for 1-2y turnover; 81% free/reduced lunch — lower-income household profile, screen leases tightly.
- Market conditions: Rents rising fast (+6.9%/yr); 140 active listings in the ZIP; 36 comparable units currently listed for rent nearby; rentals at typical pace (median 19d on market — plan ~3-4 weeks tenant-placement turnaround); lower-income renter base — watch delinquency; 299 units permitted in Delaware County in 2024 (5 in 5+ unit buildings).
- At $1,633/mo this rent would consume 48% of the median local household income ($41k/yr) (locally 2668% of renters already pay >50% of income on rent) — very limited rent-growth headroom before tenants either downsize or default.
Forward outlook
- Local home prices are declining (-3.0%/yr); year-one equity from $830 of loan paydown is wiped out by about $4k of value loss. Plan a longer hold.
- At projected returns (-3.0% appreciation + 6.9% rent growth), your $34k cash investment doubles in ~8 years — after that, you're playing with house money.
Negotiation context
- It's been on market 87 days — a 6% lower offer ($113k) is reasonable based on typical stale-listing flexibility.
- 4 sale attempts since 3y ago with the ask held roughly flat each time — persistent listings suggest the price (not the market) is what's stuck; bring a comps-based counter.
- Current owner paid $62k; list at $120k implies a 92% gain — meaningful room to come down on a strong offer.
Risks & watch-outs
- Watch-outs: property tax is 3.2% of price; built in 1948 — expect roof / HVAC / electrical / plumbing capex.
- Climate carrying-cost: major wind risk, 27% chance of damaging wind over 30y; extreme-heat days projected 7→15/yr by 2055 (HVAC capex compounding) — expect insurance premiums to compound above CPI over the hold.
Questions for the listing agent
- It's been on market 87 days. Have you received any prior offers? Is the seller open to a 6% concession, seller financing, or rate buy-down credit?
- Built in 1948 — when were the roof, HVAC, electrical panel, plumbing, and water heater last replaced?
- Property tax is high relative to price — has the assessment been appealed recently, and will the sale trigger a re-assessment?
- Why hasn't it sold? Are there any deal-killer items the seller is aware of (foundation, flood, title, zoning, code violations)?
- Is there a deadline driving the sale (1031 exchange, divorce, estate, relocation)? That informs how much negotiation room exists.
- Schools are F-rated, which usually means shorter tenancies and higher turnover. Who's the typical renter profile here, and what's been the actual vacancy rate?
- Crime grade is F in this area — have there been break-ins, vandalism, or insurance claims at this property in the last 3 years? What carrier currently insures it and at what premium?
- What's the average days-on-market for RENTAL listings here right now (not sales)? A rising rental-DOM trend means longer vacancies and softer asking-rent achievability than the comps imply.
- What's the recent tenant-quality profile in this submarket — average credit score on applications, eviction rate, late-payment / NSF rate, and stable-employment percentage? A property-management company in the area should have these aggregated.
- How much new for-sale + rental construction is in the pipeline within 1–3 miles? Heavy new supply typically softens prices + rents 12–24 months out; constrained supply supports both.
Investment metrics
- 1% rule
- 1.36% ✓
- Cap rate
- 9.23%
- Cash-on-cash
- 10.50%
- DSCR
- 1.47
- GRM
- 6.1
CMA / ARV
- ARV (median comp)
- $133,445
- List price
- $120,000
- Delta
- -10.08%
- Verdict
- UNDERPRICED
- Comps
- 20 within 1.0 mi
Show comp detail 12 sales within ~0.75 mi
| Address | Dist | Beds/Ba | Sqft | Sold | Price | $/sf | Match |
|---|---|---|---|---|---|---|---|
| 21 W 21st St | 0.02mi | 3/1.0 | 1,151 (-0%) | 3mo | $137,500 | $119 | 96 |
| 125 W 21st St | 0.08mi | 3/1.5 | 1,152 (0%) | 1mo | $135,000 | $117 | 93 |
| 200 W 21st St | 0.15mi | 3/1.0 | 1,152 (0%) | 3mo | $160,000 | $139 | 90 |
| 312 W 21st St | 0.26mi | 3/1.0 | 1,152 (0%) | 2mo | $155,000 | $135 | 86 |
| 327 W 21st St | 0.28mi | 3/1.5 | 1,152 (0%) | 2mo | $105,312 | $91 | 84 |
| 2419 Upland St | 0.30mi | 3/1.0 | 1,212 (+5%) | 3mo | $105,000 | $87 | 75 |
| 2535 Lindsay St | 0.30mi | 3/1.0 | 1,088 (-6%) | 5mo | $80,000 | $74 | 73 |
| 2534 Sandeland St | 0.29mi | 2/1.0 (-1) | 1,204 (+4%) | 4mo | $190,000 | $158 | 71 |
| 1137 Mulberry St | 0.51mi | 3/1.5 | 1,122 (-3%) | 2mo | $235,000 | $209 | 68 |
| 250 E Avon Rd | 0.74mi | 3/1.0 | 1,152 (0%) | 5mo | $245,000 | $213 | 61 |
| 1008 E 18th St | 0.75mi | 3/1.0 | 1,200 (+4%) | 1mo | $200,000 | $167 | 57 |
| 1009 Mulberry St | 0.64mi | 3/1.5 | 1,078 (-6%) | 5mo | $215,000 | $199 | 53 |
Match score weights: distance 35% · size 25% · config 20% · recency 20%. Top-matched comps best support the ARV.
Projected returns pro-forma
-3.0% appreciation · 6.88% rent growth · sell at horizon
- IRR
- 4.4%
- Equity multiple
- 1.18×
- Total profit
- $6,034
- Equity at exit
- $17,892
- IRR
- 17.7%
- Equity multiple
- 2.77×
- Total profit
- $59,336
- Equity at exit
- $10,375
Cash invested: $33,600 (down + closing). Projections, not guarantees.
Landlord ↔ Tenant lean methodology
- Overall (STATE)
- 62 Landlord-Friendly
- State Pennsylvania
- 62 Landlord-Friendly · EVEN
- County
- — inherits STATE
- City
- — inherits STATE
ZIP-level market 19013
- Rents YoY
- 6.9%
- Active inventory
- 140
- Price-to-rent
- 6.1×
Monthly cashflow live
- Estimated rent
- $1,633 high interval (Pro) →
- Mortgage (P&I)
- −$629
- Tax from tax record
- −$317 /mo · $3,805/yr
- Insurance
- −$50
- HOA
- −$0
- Vacancy / Maint / Mgmt
- −$343
- Net cashflow
- $294
Break-even live
Sensitivity live
| Price | -10% $362 | -5% $328 | +0% $294 | +5% $260 | +10% $226 |
|---|---|---|---|---|---|
| Rent | -10% $165 | -5% $230 | +0% $294 | +5% $359 | +10% $423 |
| Rate | -1.0pp $354 | -0.5pp $325 | base $294 | +0.5pp $263 | +1.0pp $231 |
UW: 25.0% down · 7.5% · 30yr · 1.5% tax · 5.0% vac · 8.0% maint · 8.0% mgmt
Financing live
Cash to close
- Down payment
- $30,000
- Closing costs
- $3,600
- Reserves months
- —
- Total cash needed
- —
Loan-product check · same deal, 3 products live
Conventional
25% down · 7.5% · 30yr
- Down + closing
- —
- Monthly P&I
- —
- Monthly cashflow
- —
- DSCR
- —
- Eligible?
- —
Personal DTI + credit; lowest rate.
DSCR
20% down · 8.5% · 30yr
- Down + closing
- —
- Monthly P&I
- —
- Monthly cashflow
- —
- DSCR
- —
- Eligible?
- —
No personal income docs; deal must DSCR.
Hard money
10% down · 12.0% · 12mo
- Down + closing
- —
- Monthly P&I
- —
- Monthly cashflow
- —
- DSCR
- —
- Eligible?
- —
Short-term bridge; refi at stabilization.
Rent comps 36 comps
| Address | Beds | Baths | Sqft | Rent | $/sqft | DOM | Units | Dist |
|---|---|---|---|---|---|---|---|---|
| 125 W 21st St Chester, PA | 4.0 | 1.5 | 1152 | $1,850 | $1.61 | 25d | 1 | 0.05mi |
| 13 E 21st St Unit A Chester, PA | 2.0 | 1.0 | 900 | $1,250 | $1.39 | 44d | 1 | 0.10mi |
| 2219 Madison St Unit B Chester, PA | 2.0 | 1.0 | 800 | $1,000 | $1.25 | 44d | 1 | 0.19mi |
| 330 W 21st St Chester, PA | 3.0 | 1.0 | 1152 | $1,500 | $1.30 | 44d | 1 | 0.25mi |
| 25 W Parkway Ave Chester, PA | 3.0 | 1.0 | 1324 | $1,600 | $1.21 | 6d | 1 | 0.33mi |
| 314 E 24th St Chester, PA | 2.0 | 1.0–1.5 | 800 | $1,500 | $1.88 | 5d | 13 | 0.36mi |
| 2701 Madison St Chester, PA | 1.0–2.0 | 1.0 | 860 | $1,533 | $1.78 | 2d | 10 | 0.41mi |
| 2607 Edgmont Ave Unit 2F Brookhaven, PA | 2.0 | 1.0 | 850 | $1,600 | $1.88 | 25d | 1 | 0.47mi |
| 30 W Roland Rd Brookhaven, PA | 3.0 | 1.0 | 1424 | $1,695 | $1.19 | 44d | 1 | 0.54mi |
| 2015 Hyatt St Chester, PA | 3.0 | 1.0 | 988 | $1,950 | $1.97 | 11d | 1 | 0.56mi |
| 1127 Walnut St Chester, PA | 4.0 | 1.5 | 1312 | $1,600 | $1.22 | 8d | 1 | 0.75mi |
| 1510 Washington Ave Chester, PA | 4.0 | 1.5 | 1280 | $2,000 | $1.56 | 19d | 1 | 0.79mi |
| 1211 Johnson St Chester, PA | 3.0 | 1.0 | 882 | $1,500 | $1.70 | 3d | 1 | 0.86mi |
| 1944 Ridley Mill Ln Woodlyn, PA | 2.0 | 1.0 | 840 | $1,600 | $1.90 | 44d | 1 | 0.86mi |
| 89 Park Valley Ln Brookhaven, PA | 2.0 | 1.5 | 984 | $1,705 | $1.73 | 44d | 1 | 0.86mi |
| 814 Upland St Chester, PA | 3.0 | 1.0 | 1344 | $1,525 | $1.13 | 8d | 1 | 0.87mi |
| 51 Park Valley Ln Brookhaven, PA | 2.0 | 1.5 | 990 | $1,795 | $1.81 | 19d | 1 | 0.87mi |
| 1118 Brown St Unit 318 Chester, PA | 3.0 | 1.0 | 1092 | $1,900 | $1.74 | 15d | 1 | 0.93mi |
| 1124 Thomas St Chester, PA | 3.0 | 1.0 | 1046 | $1,200 | $1.15 | 25d | 1 | 1.02mi |
| 1206 Thomas St Chester, PA | 3.0 | 1.0 | 833 | $1,399 | $1.68 | 25d | 1 | 1.03mi |
| 407 Beech Rd Apt B Wallingford, PA | 2.0 | 1.0 | 998 | $1,600 | $1.60 | 44d | 1 | 1.08mi |
| 418 Penn St Chester, PA | 3.0 | 1.0 | 1250 | $1,350 | $1.08 | 44d | 1 | 1.19mi |
| 403 Trenton Ct Wallingford, PA | 2.0 | 1.0 | 775 | $2,250 | $2.90 | 2d | 1 | 1.20mi |
| 1312 E 13th St Crum Lynne, PA | 3.0 | 1.0 | 1280 | $1,940 | $1.52 | 19d | 1 | 1.23mi |
| 739 Pennsylvania Ave Wallingford, PA | 3.0 | 1.0 | 1026 | $2,100 | $2.05 | 8d | 1 | 1.30mi |
| 404 Nashville Ct Wallingford, PA | 2.0 | 1.0 | 868 | $1,750 | $2.02 | 19d | 1 | 1.31mi |
| 1400 MacDade Blvd Woodlyn, PA | 1.0–2.0 | 1.0 | 775 | $1,600 | $2.06 | 44d | 2 | 1.33mi |
| 1224 Elson Rd Brookhaven, PA | 3.0 | 2.0 | 1200 | $1,900 | $1.58 | 18d | 1 | 1.35mi |
| 768 Putnam Blvd Unit A Wallingford, PA | 2.0 | 1.0 | 889 | $1,595 | $1.79 | 25d | 1 | 1.36mi |
| 280 Bridgewater Rd Brookhaven, PA | 1.0–2.0 | 1.0–2.0 | 775 | $1,695 | $2.19 | 6d | 4 | 1.38mi |
| 280 Bridgewater Rd Brookhaven, PA | 1.0–2.0 | 1.0–1.5 | 775 | $1,800 | $2.32 | 25d | 2 | 1.38mi |
| 732 Putnam Blvd Wallingford, PA | 2.0 | 1.0 | 889 | $1,700 | $1.91 | 6d | 1 | 1.39mi |
| 1315 Harshaw Rd Brookhaven, PA | 3.0 | 2.5 | 1260 | $2,395 | $1.90 | 2d | 1 | 1.41mi |
| 1433 Grant Ave Unit B Woodlyn, PA | 2.0 | 1.0 | 1200 | $1,450 | $1.21 | 44d | 1 | 1.42mi |
| 532 Brookhaven Rd Brookhaven, PA | 1.0–2.0 | 1.0 | 720 | $1,690 | $2.35 | 2d | 10 | 1.42mi |
| 925 W 3rd St Chester, PA | 4.0 | 1.0 | 1500 | $1,700 | $1.13 | 19d | 1 | 1.49mi |
Listing history 29 events
-
2026-06-21days on market $120,000 Active 87 DOM
-
2026-06-18days on market $120,000 Active 84 DOM
-
2026-06-17days on market $120,000 Active 83 DOM
-
2026-06-16days on market $120,000 Active 82 DOM
-
2026-06-15days on market $120,000 Active 81 DOM
-
2026-06-13days on market $120,000 Active 79 DOM
-
2026-06-13days on market $120,000 Active 78 DOM
-
2026-06-09days on market $120,000 Active 75 DOM
-
2026-06-08days on market $120,000 Active 74 DOM
-
2026-06-07days on market $120,000 Active 73 DOM
-
2026-06-04days on market $120,000 Active 70 DOM
-
2026-06-03days on market $120,000 Active 69 DOM
-
2026-06-02days on market $120,000 Active 68 DOM
-
2026-06-01days on market $120,000 Active 67 DOM
-
2026-05-31days on market $120,000 Active 66 DOM
-
2026-03-27$120,000 Active 927-char remark
Show marketing remark (927 chars)
Lots of potential with this bright row home located right off of 352, to Brookhaven, Subaru Park & the Philly airport. Whether you're looking for your next home or investment property this property is a great fit for either buyer. Chester Housing Authority has a real need for affordable housing and is offering over $1800 per month for 3BR homes After some very minor improvements this home is ready for a new homeowner or a new tenant. The main floor has a bright bay window in the living room and luxury vinyl flooring. The dining area off off the kitchen has a sliding glass door that leads out to the deck. The upper level is equally bright and spacious with 3 nice sized bedrooms & a hall closet. The bathroom is all tile with a charming skylight. The full basement is dry and finishable with a walk-out to the off street parking below the rear deck. The front has a fenced in yard and a quaint patio area.
-
2026-03-26historical $120,000 927-char remark
Show marketing remark (927 chars)
Lots of potential with this bright row home located right off of 352, to Brookhaven, Subaru Park & the Philly airport. Whether you're looking for your next home or investment property this property is a great fit for either buyer. Chester Housing Authority has a real need for affordable housing and is offering over $1800 per month for 3BR homes After some very minor improvements this home is ready for a new homeowner or a new tenant. The main floor has a bright bay window in the living room and luxury vinyl flooring. The dining area off off the kitchen has a sliding glass door that leads out to the deck. The upper level is equally bright and spacious with 3 nice sized bedrooms & a hall closet. The bathroom is all tile with a charming skylight. The full basement is dry and finishable with a walk-out to the off street parking below the rear deck. The front has a fenced in yard and a quaint patio area.
-
2025-12-29historical
-
2025-12-19price $139,999
-
2025-10-20price $153,999
-
2025-09-20price $154,999
-
2025-08-02price $159,000
-
2025-07-07$164,999 Active
-
2024-03-11historical $1,500
-
2024-02-01$1,500
-
2024-01-23historical $1,500
-
2023-12-28$1,500
-
2006-06-12soldstatus $62,500
-
1992-06-15soldstatus $56,500
ⓘ Source: listings_history table (triggers on properties + properties_extension) + one-shot
backfill from property_details.listing_events for pre-trigger history.
Tax reassessment forecast PA · Partial reset (capped growth)
- Current annual tax
- $3,805 · $317/mo
- Projected year-2 tax
- $3,805 · $317/mo
- Expected delta
- $0/yr ($0/mo · -0.0%)
ⓘ Screening estimate from a state-policy table — verify with the county assessor before closing.
Climate risk First Street
- Flood 1/10 Low FEMA zone X (unshaded) · 0% chance over 30 yrs
- Wildfire 1/10 Low
- Heat 7/10 Severe 7 d/yr ≥103°F today · 15 d/yr by 30 yrs out
- Wind 6/10 Major 27% chance of damaging wind over 30 yrs
- Air quality 3/10 Moderate 2 unhealthy d/yr today · 4 by 30 yrs out
Nearby sold comps map
Loading sold comps map…
Walkable amenities ~0.75 mi
Loading nearby amenities…
Taxation est. · year 1
- Rental income
- $19,601
- − Mortgage interest
- −$6,722
- − Property taxes
- −$3,805
- − Insurance
- −$600
- − Repairs & maintenance
- −$1,568
- − Management
- −$1,568
- − Depreciation
- −$3,491
- Taxable income
- $1,847
- Est. tax owed @ 24.0%
- −$443
- After-tax cash flow
- $3,085/yr
For passive investors: Depreciation is non-cash, so a rental often shows a tax loss while cash-flowing — sheltering income. Rental losses are passive: they offset passive income freely, and up to $25,000/yr can offset ordinary (W-2) income if you actively participate and your MAGI is under $100k (phasing out to $0 by $150k); unused losses carry forward. On sale, claimed depreciation is recaptured at up to 25%, and gains may owe capital-gains tax (a 1031 exchange can defer both). Figures are a year-1 estimate at your 24.0% rate — not tax advice; consult a CPA.
Schools (NCES district)
- District
- Chester-Upland SD
- NCES district ID
- 4205860
- Math proficiency
- 4% ▼ -3.00%
- Reading proficiency
- 17% ▼ -6.00%
- Median HH income
- $29,790
- Composite
- 8.05/100
- National rank
- #9918
- State rank
- #533 of 539 in PA
Livability — Chester
- Score
- 73/100
- State rank
- #540
- US rank
- #5053
Category grades
Schools grade is shown separately in the Schools card above.
Census & demographics
- Census place
- Chester, PA
- County
- Delaware County · 399,863 people
- City population
- 35,064
- Metro
- Philadelphia-Camden-Wilmington, PA-NJ-DE-MD
- Population (ZIP)
- 35,064
- Household income
- $41,261
- Rent vs Own
- Severe rent burden
- 2668.0
Population outlook (Delaware County) Hauer SSP2
- Today (2025)
- 577,490 people
- By 2030
- 581,243 · +0.6%
- By 2040
- 584,700 · +1.2%
- By 2050
- 586,581 · +1.6%
- By 2075
- 598,706 · +3.7%
- By 2100
- 590,823 · +2.3%
Race, ethnicity, and origin ACS 2023
- Neighborhood character
- Predominantly Black (71%)
- Race & ethnicity
- Black 71% White 14% Hispanic / Latino 9% Two or more races 4%
- Hispanic origin (detail)
- Puerto Rican 6%
- Common ancestry
- Romanian 2%
- Foreign-born
- 4% · Canada
- Languages at home
- 92% English-only · Spanish 6%
Political lean MEDSL · Delaware
- 2024 margin
- Strong D (+23.7) · D 61.4% · R 37.6% · Other 1.0%
- 2008→2024 swing
- +2.3pp toward D · 2008: 21.4pp · 2024: 23.7pp
- All cycles
- 2024: D+23.7 2020: D+26.7 2016: D+22.0 2012: D+21.8 2008: D+21.4
Not yet ingested
- Civics
- —
Market trends
- HPI YoY
- ▼ -149.69%
- Current HPI
- 219.5173
- Rent YoY
- ▲ 6.88%
- Metro
- Philadelphia-Camden-Wilmington, PA-NJ-DE-MD
- State GDP YoY
- ▲ 1.68%
- F500 in state
- 34
Industry mix (Fortune 500 HQ in PA)
| Industry | F500 HQs | Revenue |
|---|---|---|
| Healthcare | 2 | $309B |
|
||
| Insurance | 2 | $27B |
|
||
| Telecommunications / Media | 1 | $124B |
|
||
| Industrial Distribution | 1 | $22B |
|
||
| Financial Services | 1 | $20B |
|
||
| Chemicals / Materials | 1 | $18B |
|
||
Price history
+112.4% since first listed14 events — show timeline
- 2026-03-27 Listed $120,000 BRIGHT MLS
- 2026-03-26 Coming Soon $120,000 BRIGHT MLS
- 2025-12-29 Listing Removed — BRIGHT MLS
- 2025-12-19 Price Changed $139,999 BRIGHT MLS
- 2025-10-20 Price Changed $153,999 BRIGHT MLS
- 2025-09-20 Price Changed $154,999 BRIGHT MLS
- 2025-08-02 Price Changed $159,000 BRIGHT MLS
- 2025-07-07 Listed $164,999 BRIGHT MLS
- 2024-03-11 Rental Removed $1,500 BRIGHTMLS
- 2024-02-01 Listed for Rent $1,500 BRIGHTMLS
- 2024-01-23 Rental Removed $1,500 BRIGHTMLS
- 2023-12-28 Listed for Rent $1,500 BRIGHTMLS
- 2006-06-12 Sold (Public Records) $62,500 Public Records
- 1992-06-15 Sold (Public Records) $56,500 Public Records
Property tax history
+18.6%/yrLatest (2026): $3,805 · +143.3% YoY. Source: county tax records.
Cash-flow waterfall
monthlySold comps — $/sqft
last 12 mo · ≤1 miLoading sold comps…