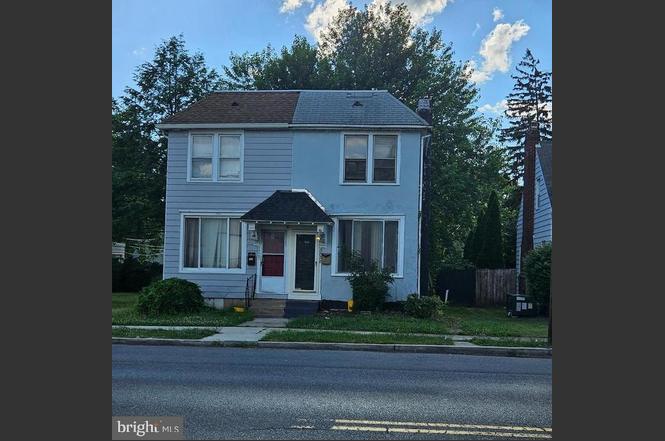
3538 N 6th St · Susquehanna, PA
Flood risk 9/10 · Severe
- FEMA flood zone
- X (unshaded)
- Chance of flooding over 30 yrs
- 0.99%
- Est. flood insurance / yr
- $473 – $860
Fire risk 1/10 · Minimal
- Est. fire insurance / yr
- $511 – $949
Heat risk 5/10 · Moderate
- Hot days now (above 101°F)
- 7 days/yr
- Hot days in 30 yrs
- 15 days/yr
Wind risk 3/10 · Minor
- Chance of severe wind over 30 yrs
- 5.0%
Air-quality risk 2/10 · Minimal
- Unhealthy air days now
- 1 days/yr
- Unhealthy air days in 30 yrs
- 3 days/yr
Risk factors via First Street. Map © Google.
Why this score? — see what drove the C grade
The composite is a weighted blend of 9 inputs, each scored 0–100. Each bar is that input's sub-score; the figure is the points it added to the 100-point composite (weight × sub-score).
- Cash flow +21.1/30.0
- ARV discount +15.0/15.0
- DSCR +6.7/10.0
- 1% rule +5.6/10.0
- Rent growth +2.9/5.0
- Schools +2.6/10.0
- Livability +2.5/5.0
- Condition / age +2.5/5.0
- Appreciation +0.0/10.0
$164,900
🖨 Deal sheet 📄 Offer letter ✓ Due diligence
Listing remarks
Welcome to 3538 N 6th Street in Harrisburg! This charming home is full of character, space, and opportunity. From the moment you arrive, you'll appreciate the inviting curb appeal and convenient location close to shopping, dining, parks, schools, and major commuter routes. Step inside to discover a spacious layout with plenty of natural light, creating a warm and welcoming atmosphere throughout. The generous living areas provide the perfect setting for relaxing with family, entertaining guests, or simply enjoying everyday life. The kitchen offers ample space for meal preparation and gatherings, while the comfortable bedrooms provide peaceful retreats at the end of the day. Whether you're a
Key facts
- Natural light
- Parking
- Built 1920
Tags
Property features AI
Exterior
- Parking: Off-street parking (1 space); On-street parking available
- Utilities: Public water; Public sewer; Hot water from natural gas
- Home design: Semi-detached property; Above-grade finished area reported by assessor
- Construction: Steel siding and stucco exterior; Block foundation; Other structures listed above and below grade
- Exterior features: Paved parking; On-street and off-street parking available; One total garage/parking space; Ground rent paid annually
Interior
- Bedrooms: Three bedrooms on the main level
- Bathrooms: Two full bathrooms (both on the main level)
- Heating & cooling: Hot water radiator heating; Heating fuel: oil and natural gas; Window air conditioning units (electric)
- Interior features: One fireplace; Basement: dirt floor, unfinished; Living area recorded from assessor; Not in a federal flood zone
Neighborhood map
What this means for you Summary
Snapshot
- This is a 3-bed/1.5-bath townhouse listed at $165k.
Deal economics
- At list price, monthly cash flow is $178 ($2k/yr) — positive.
- The deal already cash-flows at list — no discount required.
- Meets the 1% rule at list price ($2k rent vs $165k).
Location & tenants
- Location reads: area grade C — affects rentability + tenant quality, not the cash-flow math above.
- Susquehanna Township SD (suburban): math 17% / reading 39% proficiency, ranked #444 of 539 in PA (top 82%) — low school quality limits family demand, transient renter base, plan for 1-2y turnover.
- Zoned schools: Susquehanna Twp Hs (math 37% / reading 10%, grade F, #379 of 437 statewide, top 87%, 743 students, 55% FRL) — zoned schools average 55% FRL vs 35% district-wide (21 pts higher); higher-poverty schools than district average — tighter screening recommended.
- Market conditions: Rents rising (+1.6%/yr); 170 active listings in the ZIP; 7 comparable units currently listed for rent nearby; rentals lingering (median 44d on market — plan ~5-8 weeks vacancy on turnover, expect pricing pressure); 57% of comp listings sitting > 30 days — soft ceiling on asking rent; solid renter incomes; 540 units permitted in Dauphin County in 2024 (194 in 5+ unit buildings).
Forward outlook
- Local home prices are declining (-3.0%/yr); year-one equity from $1k of loan paydown is wiped out by about $5k of value loss. Plan a longer hold.
Negotiation context
- Only 2 days on market — expect competitive offers; lowballing is unlikely to land.
- Current owner paid $69k; list at $165k implies a 139% gain — meaningful room to come down on a strong offer.
Risks & watch-outs
- Watch-outs: flood insurance adds $56/mo; built in 1920 — expect roof / HVAC / electrical / plumbing capex.
- Climate carrying-cost: severe flood risk; extreme-heat days projected 7→15/yr by 2055 (HVAC capex compounding) — expect insurance premiums to compound above CPI over the hold.
Questions for the listing agent
- Built in 1920 — when were the roof, HVAC, electrical panel, plumbing, and water heater last replaced?
- What's the actual annual flood-insurance premium (NFIP or private), and is the property in a SFHA with mandatory coverage?
- Is there a deadline driving the sale (1031 exchange, divorce, estate, relocation)? That informs how much negotiation room exists.
- What's the average days-on-market for RENTAL listings here right now (not sales)? A rising rental-DOM trend means longer vacancies and softer asking-rent achievability than the comps imply.
- What's the recent tenant-quality profile in this submarket — average credit score on applications, eviction rate, late-payment / NSF rate, and stable-employment percentage? A property-management company in the area should have these aggregated.
- How much new for-sale + rental construction is in the pipeline within 1–3 miles? Heavy new supply typically softens prices + rents 12–24 months out; constrained supply supports both.
Investment metrics
- 1% rule
- 1.06% ✓
- Cap rate
- 8.00%
- Cash-on-cash
- 6.08%
- DSCR
- 1.27
- GRM
- 7.8
CMA / ARV
- ARV (on-the-fly)
- $202,244
- Comps found
- 12
Show comp detail 12 sales within ~0.75 mi
| Address | Dist | Beds/Ba | Sqft | Sold | Price | $/sf | Match |
|---|---|---|---|---|---|---|---|
| 3132 N 3rd St | 0.55mi | 3/1.5 | 1,682 (+3%) | 1mo | $230,000 | $137 | 68 |
| 3227 N 4th St | 0.43mi | 4/1.5 (+1) | 1,530 (-6%) | 3mo | $144,000 | $94 | 62 |
| 228 Lewis St | 0.53mi | 3/2.0 | 1,741 (+7%) | 2mo | $294,500 | $169 | 60 |
| 3863 N 6th St | 0.49mi | 4/1.5 (+1) | 1,716 (+5%) | 5mo | $208,000 | $121 | 59 |
| 3007 N 3rd St | 0.68mi | 4/1.5 (+1) | 1,654 (+1%) | 5mo | $205,000 | $124 | 57 |
| 3847 N 6th St | 0.45mi | 4/2.5 (+1) | 1,539 (-6%) | 5mo | $200,000 | $130 | 57 |
| 3211 N 4th St | 0.47mi | 4/1.0 (+1) | 1,470 (-10%) | 1mo | $185,000 | $126 | 54 |
| 3214 N 3rd St | 0.49mi | 3/1.0 | 1,472 (-10%) | 8mo | $140,000 | $95 | 52 |
| 210 Lewis St | 0.57mi | 3/1.5 | 1,440 (-12%) | 6mo | $179,000 | $124 | 49 |
| 3134 N 6th St | 0.55mi | 3/2.0 | 1,836 (+13%) | 10mo | $93,000 | $51 | 43 |
| 3107 N 6th St | 0.61mi | 3/1.0 | 1,411 (-14%) | 6mo | $180,000 | $128 | 42 |
| 3002 N 3rd St | 0.70mi | 4/1.0 (+1) | 1,846 (+13%) | 11mo | $85,000 | $46 | 29 |
Match score weights: distance 35% · size 25% · config 20% · recency 20%. Top-matched comps best support the ARV.
Projected returns pro-forma
-3.0% appreciation · 1.55% rent growth · sell at horizon
- IRR
- -10.8%
- Equity multiple
- 0.61×
- Total profit
- $-17,807
- Equity at exit
- $24,587
- IRR
- -3.7%
- Equity multiple
- 0.77×
- Total profit
- $-10,640
- Equity at exit
- $14,258
Cash invested: $46,172 (down + closing). Projections, not guarantees.
Landlord ↔ Tenant lean methodology
- Overall (STATE)
- 62 Landlord-Friendly
- State Pennsylvania
- 62 Landlord-Friendly · EVEN
- County
- — inherits STATE
- City
- — inherits STATE
ZIP-level market 17110
- Rents YoY
- 1.6%
- Active inventory
- 170
- Price-to-rent
- 7.8×
Monthly cashflow live
- Estimated rent
- $1,752 high interval (Pro) →
- Mortgage (P&I)
- −$865
- Tax from tax record
- −$216 /mo · $2,597/yr
- Insurance
- −$69
- Flood insurance flood zone
- −$56 /mo · $666/yr
- HOA
- −$0
- Vacancy / Maint / Mgmt
- −$368
- Net cashflow
- $178
Break-even live
UW: 25.0% down · 7.5% · 30yr · 1.5% tax · 5.0% vac · 8.0% maint · 8.0% mgmt
Financing live
Cash to close
- Down payment
- $41,225
- Closing costs
- $4,947
- Reserves months
- —
- Total cash needed
- —
Loan-product check · same deal, 3 products live
Conventional
25% down · 7.5% · 30yr
- Down + closing
- —
- Monthly P&I
- —
- Monthly cashflow
- —
- DSCR
- —
- Eligible?
- —
Personal DTI + credit; lowest rate.
DSCR
20% down · 8.5% · 30yr
- Down + closing
- —
- Monthly P&I
- —
- Monthly cashflow
- —
- DSCR
- —
- Eligible?
- —
No personal income docs; deal must DSCR.
Hard money
10% down · 12.0% · 12mo
- Down + closing
- —
- Monthly P&I
- —
- Monthly cashflow
- —
- DSCR
- —
- Eligible?
- —
Short-term bridge; refi at stabilization.
Rent comps 7 comps
| Address | Beds | Baths | Sqft | Rent | $/sqft | DOM | Units | Dist |
|---|---|---|---|---|---|---|---|---|
| 3216 Green St Harrisburg, PA | 4.0 | 2.0 | 1550 | $2,200 | $1.42 | 14d | 1 | 0.51mi |
| 2728 N 6th St Harrisburg, PA | 4.0 | 2.0 | 1786 | $1,750 | $0.98 | 14d | 1 | 0.96mi |
| 2715 N 6th St Harrisburg, PA | 4.0 | 1.0 | 1620 | $1,650 | $1.02 | 14d | 1 | 0.99mi |
| 2615 Waldo St Harrisburg, PA | 3.0 | 1.0 | 1400 | $1,095 | $0.78 | 44d | 1 | 1.08mi |
| 2801 N 2nd St Apt A2 Harrisburg, PA | 3.0 | 1.5 | 1200 | $1,495 | $1.25 | 44d | 1 | 1.12mi |
| 514 Radnor St Harrisburg, PA | 4.0 | 1.0 | 1498 | $1,600 | $1.07 | 44d | 1 | 1.15mi |
| 2406 Reel St Harrisburg, PA | 4.0 | 1.0 | 1500 | $1,395 | $0.93 | 44d | 1 | 1.37mi |
Listing history 3 events
-
2026-06-18days on market $164,900 Active 2 DOM
-
2026-06-16remarks 699-char remark
-
2026-06-16$164,900 Active 1 DOM
ⓘ Source: listings_history table (triggers on properties + properties_extension) + one-shot
backfill from property_details.listing_events for pre-trigger history.
Tax reassessment forecast PA · Partial reset (capped growth)
- Current annual tax
- $2,597 · $216/mo
- Projected year-2 tax
- $2,601 · $217/mo
- Expected delta
- +$4/yr ($0/mo · 0.2%)
ⓘ Screening estimate from a state-policy table — verify with the county assessor before closing.
Climate risk First Street
- Flood 9/10 Extreme FEMA zone X (unshaded) · 99% chance over 30 yrs
- Wildfire 1/10 Low
- Heat 5/10 Major 7 d/yr ≥101°F today · 15 d/yr by 30 yrs out
- Wind 3/10 Moderate 5% chance of damaging wind over 30 yrs
- Air quality 2/10 Low 1 unhealthy d/yr today · 3 by 30 yrs out
Nearby sold comps map
Loading sold comps map…
Walkable amenities ~0.75 mi
Loading nearby amenities…
Taxation est. · year 1
- Rental income
- $21,021
- − Mortgage interest
- −$9,237
- − Property taxes
- −$2,597
- − Insurance
- −$1,491
- − Repairs & maintenance
- −$1,682
- − Management
- −$1,682
- − Depreciation
- −$4,797
- Taxable loss
- −$464
- Est. tax savings @ 24.0%
- +$111
- After-tax cash flow
- $2,253/yr
For passive investors: Depreciation is non-cash, so a rental often shows a tax loss while cash-flowing — sheltering income. Rental losses are passive: they offset passive income freely, and up to $25,000/yr can offset ordinary (W-2) income if you actively participate and your MAGI is under $100k (phasing out to $0 by $150k); unused losses carry forward. On sale, claimed depreciation is recaptured at up to 25%, and gains may owe capital-gains tax (a 1031 exchange can defer both). Figures are a year-1 estimate at your 24.0% rate — not tax advice; consult a CPA.
Schools (NCES district)
- District
- Susquehanna Township SD
- NCES district ID
- 4223010
- Math proficiency
- 17% ▼ -15.00%
- Reading proficiency
- 39% ▼ -10.00%
- Median HH income
- $61,794
- Composite
- 25.59/100
- National rank
- #7424
- State rank
- #444 of 539 in PA
Livability — Susquehanna
No livability data for this city. (Only ~50 U.S. cities are tracked.)
Census & demographics
- County
- Dauphin County · 247,857 people
- Metro
- Harrisburg-Carlisle, PA
- Population (ZIP)
- 27,364
- Household income
- $80,699
- Rent vs Own
- Severe rent burden
- 1037.0
Population outlook (Dauphin County) Hauer SSP2
- Today (2025)
- 281,628 people
- By 2030
- 283,549 · +0.7%
- By 2040
- 285,385 · +1.3%
- By 2050
- 286,188 · +1.6%
- By 2075
- 291,053 · +3.3%
- By 2100
- 282,374 · +0.3%
Race, ethnicity, and origin ACS 2023
- Neighborhood character
- Diverse neighborhood (Simpson 0.66)
- Race & ethnicity
- White 47% Black 32% Hispanic / Latino 9% Asian 7% Two or more races 6%
- Hispanic origin (detail)
- Puerto Rican 6% Dominican 1%
- Common ancestry
- Italian 3% Romanian 2% Slovak 1%
- Foreign-born
- 8% · Canada, India, Vietnam
- Languages at home
- 88% English-only · Spanish 6% Other Indo-European 2% Vietnamese 1%
Political lean MEDSL · Dauphin
- 2024 margin
- Lean D (+5.9) · D 52.4% · R 46.5% · Other 1.1%
- 2008→2024 swing
- -3.1pp toward R · 2008: 9.1pp · 2024: 5.9pp
- All cycles
- 2024: D+5.9 2020: D+8.5 2016: D+2.8 2012: D+6.0 2008: D+9.1
Not yet ingested
- Civics
- —
Market trends
- HPI YoY
- ▼ -144.07%
- Current HPI
- 257.826
- Rent YoY
- ▲ 1.55%
- Metro
- Harrisburg-Carlisle, PA
- State GDP YoY
- ▲ 1.68%
- F500 in state
- 34
Industry mix (Fortune 500 HQ in PA)
| Industry | F500 HQs | Revenue |
|---|---|---|
| Healthcare | 2 | $309B |
|
||
| Insurance | 2 | $27B |
|
||
| Telecommunications / Media | 1 | $124B |
|
||
| Industrial Distribution | 1 | $22B |
|
||
| Financial Services | 1 | $20B |
|
||
| Chemicals / Materials | 1 | $18B |
|
||
Price history
+139.0% since first listed3 events — show timeline
- 2026-06-16 Listed $164,900 BRIGHT MLS
- 2001-06-22 Sold (Public Records) $69,000 Public Records
- 2001-06-22 Sold (Public Records) $69,000 Public Records
Property tax history
+3.1%/yrLatest (2026): $2,597 · +5.7% YoY. Source: county tax records.
Cash-flow waterfall
monthlySold comps — $/sqft
last 12 mo · ≤1 miLoading sold comps…