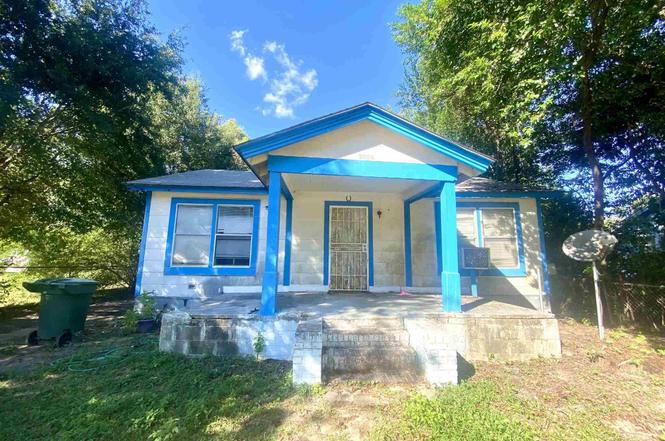
3008 W Lloyd St · West Pensacola, FL
Flood risk 1/10 · Minimal
- FEMA flood zone
- X (unshaded)
- Chance of flooding over 30 yrs
- 0.0%
- Est. flood insurance / yr
- $507 – $1,088
Fire risk 1/10 · Minimal
- Est. fire insurance / yr
- $947 – $1,759
Heat risk 10/10 · Severe
- Hot days now (above 105°F)
- 7 days/yr
- Hot days in 30 yrs
- 22 days/yr
Wind risk 9/10 · Severe
- Chance of severe wind over 30 yrs
- 99.0%
Air-quality risk 1/10 · Minimal
- Unhealthy air days now
- 0 days/yr
- Unhealthy air days in 30 yrs
- 0 days/yr
Risk factors via First Street. Map © Google.
Why this score? — see what drove the B+ grade
The composite is a weighted blend of 9 inputs, each scored 0–100. Each bar is that input's sub-score; the figure is the points it added to the 100-point composite (weight × sub-score).
- Cash flow +30.0/30.0
- ARV discount +15.0/15.0
- DSCR +10.0/10.0
- 1% rule +9.2/10.0
- Rent growth +3.7/5.0
- Schools +3.6/10.0
- Livability +3.3/5.0
- Condition / age +2.5/5.0
- Appreciation +0.0/10.0
$89,000
🖨 Deal sheet 📄 Offer letter ✓ Due diligence
Listing remarks
nvestor Special! 3008 W Lloyde — Great location near Walmart, Bien Dong Market, and Saigon Market. Features a new water heater (2024), cleared septic tank (2024), and working electricity and utilities. The large backyard offers plenty of space for a boat, RV, or multiple cars. This property is a fantastic opportunity for investors or flippers looking to add value in a prime area. Don’t miss out—schedule a viewing today!
Key facts
- Large backyard
- New water heater
- Working electricity
Tags
Neighborhood map
What this means for you Summary
Snapshot
- This is a 2-bed/1.0-bath single-family listed at $89k.
Deal economics
- At list price, monthly cash flow is $428 ($5k/yr) — positive.
- The deal already cash-flows at list — no discount required.
- Meets the 1% rule at list price ($1k rent vs $89k).
- Recommended offer: $78k (12.0% below list) — sets the bar for market timing.
- Cap rate 12.1% vs local median 7.7% in West Pensacola — top-decile yield for the area; either an underpriced asset or a hidden risk that comps aren't pricing in. Stress-test before assuming the spread holds.
Location & tenants
- Location reads 66/100 on livability (#629 in FL) — a middle-class / working-renter tenant base. Strengths: cost of living A+, housing A+, health & safety B+; Watch: crime D, schools F, amenities F.
- Escambia (suburban): math 40% / reading 45% proficiency, ranked #56 of 73 in FL (top 77%) — families likely to look elsewhere, expect single-tenant / working-renter base with shorter leases.
- Market conditions: Rents rising fast (+4.9%/yr); 198 active listings in the ZIP; 15 comparable units currently listed for rent nearby; rentals at typical pace (median 24d on market — plan ~3-4 weeks tenant-placement turnaround); lower-income renter base — watch delinquency; 1,479 units permitted in Escambia County in 2024 (0 in 5+ unit buildings).
- This rent runs 34% of the median local income ($45k/yr) — at the standard rent-burdened threshold; future hikes will face affordability resistance.
Forward outlook
- Local home prices are declining (-3.0%/yr); year-one equity from $615 of loan paydown is wiped out by about $3k of value loss. Plan a longer hold.
- Escambia County population projected at +13% by 2050 — modest demand growth; plan on rents tracking national, not racing it.
- At projected returns (-3.0% appreciation + 4.9% rent growth), your $25k cash investment doubles in ~6 years — after that, you're playing with house money.
Negotiation context
- It's been on market 162 days — a 12% lower offer ($78k) is reasonable based on typical stale-listing flexibility.
- Current owner paid $13k; list at $89k implies a 585% gain — meaningful room to come down on a strong offer.
Risks & watch-outs
- Watch-outs: built in 1940 — expect roof / HVAC / electrical / plumbing capex.
- Climate carrying-cost: severe wind risk, 99% chance of damaging wind over 30y; extreme-heat days projected 7→22/yr by 2055 (HVAC capex compounding) — expect insurance premiums to compound above CPI over the hold.
Questions for the listing agent
- It's been on market 162 days. Have you received any prior offers? Is the seller open to a 12% concession, seller financing, or rate buy-down credit?
- Built in 1940 — when were the roof, HVAC, electrical panel, plumbing, and water heater last replaced?
- Why hasn't it sold? Are there any deal-killer items the seller is aware of (foundation, flood, title, zoning, code violations)?
- Is there a deadline driving the sale (1031 exchange, divorce, estate, relocation)? That informs how much negotiation room exists.
- Schools are F-rated, which usually means shorter tenancies and higher turnover. Who's the typical renter profile here, and what's been the actual vacancy rate?
- Crime grade is D in this area — have there been break-ins, vandalism, or insurance claims at this property in the last 3 years? What carrier currently insures it and at what premium?
- What's the average days-on-market for RENTAL listings here right now (not sales)? A rising rental-DOM trend means longer vacancies and softer asking-rent achievability than the comps imply.
- What's the recent tenant-quality profile in this submarket — average credit score on applications, eviction rate, late-payment / NSF rate, and stable-employment percentage? A property-management company in the area should have these aggregated.
- How much new for-sale + rental construction is in the pipeline within 1–3 miles? Heavy new supply typically softens prices + rents 12–24 months out; constrained supply supports both.
Investment metrics
- 1% rule
- 1.42% ✓
- Cap rate
- 12.06%
- Cash-on-cash
- 20.61%
- DSCR
- 1.92
- GRM
- 5.9
CMA / ARV
- ARV (on-the-fly)
- $141,440
- Comps found
- 12
Show comp detail 12 sales within ~0.75 mi
| Address | Dist | Beds/Ba | Sqft | Sold | Price | $/sf | Match |
|---|---|---|---|---|---|---|---|
| 1219 N U St | 0.22mi | 2/1.0 | 782 (-6%) | 13mo | $100,000 | $128 | 69 |
| 2405 W Hernandez St | 0.64mi | 2/1.0 | 850 (+2%) | 3mo | $143,000 | $168 | 64 |
| 3715 W Brainerd St | 0.50mi | 2/1.0 | 800 (-4%) | 10mo | $130,000 | $163 | 62 |
| 1608 N S St | 0.42mi | 2/2.0 | 800 (-4%) | 11mo | $198,000 | $248 | 61 |
| 2624 W Lee St | 0.25mi | 2/2.0 | 940 (+13%) | 3mo | $193,000 | $205 | 60 |
| 1207 Grandview St | 0.37mi | 2/1.0 | 784 (-6%) | 16mo | $104,500 | $133 | 60 |
| 2916 W Lloyd St | 0.06mi | 2/1.0 | 955 (+15%) | 16mo | $151,000 | $158 | 60 |
| 1220 N Kirk St | 0.40mi | 2/1.0 | 868 (+4%) | 22mo | $165,000 | $190 | 56 |
| 1201 Grandview St | 0.37mi | 2/1.0 | 900 (+8%) | 16mo | $159,000 | $177 | 56 |
| 1507 N S St | 0.38mi | 2/1.0 | 746 (-10%) | 13mo | $126,500 | $170 | 54 |
| 3305 W La Rua St | 0.60mi | 3/1.0 (+1) | 921 (+11%) | 9mo | $55,000 | $60 | 42 |
| 3411 W Maxwell St | 0.69mi | 3/1.0 (+1) | 912 (+10%) | 16mo | $158,000 | $173 | 34 |
Match score weights: distance 35% · size 25% · config 20% · recency 20%. Top-matched comps best support the ARV.
Projected returns pro-forma
-3.0% appreciation · 4.92% rent growth · sell at horizon
- IRR
- 15.0%
- Equity multiple
- 1.61×
- Total profit
- $15,324
- Equity at exit
- $13,270
- IRR
- 25.0%
- Equity multiple
- 3.37×
- Total profit
- $59,047
- Equity at exit
- $7,695
Cash invested: $24,920 (down + closing). Projections, not guarantees.
Landlord ↔ Tenant lean methodology
- Overall (STATE)
- 87 Strongly Landlord-Friendly
- State Florida
- 87 Strongly Landlord-Friendly · R+3
- County
- — inherits STATE
- City
- — inherits STATE
ZIP-level market 32505
- Home prices YoY
- -26.5%
- Rents YoY
- 4.9%
- Active inventory
- 198
- Price-to-rent
- 5.9×
Monthly cashflow live
- Estimated rent
- $1,265 high interval (Pro) →
- Mortgage (P&I)
- −$467
- Tax from tax record
- −$68 /mo · $811/yr
- Insurance
- −$37
- HOA
- −$0
- Vacancy / Maint / Mgmt
- −$266
- Net cashflow
- $428
Break-even live
UW: 25.0% down · 7.5% · 30yr · 1.5% tax · 5.0% vac · 8.0% maint · 8.0% mgmt
Financing live
Cash to close
- Down payment
- $22,250
- Closing costs
- $2,670
- Reserves months
- —
- Total cash needed
- —
Loan-product check · same deal, 3 products live
Conventional
25% down · 7.5% · 30yr
- Down + closing
- —
- Monthly P&I
- —
- Monthly cashflow
- —
- DSCR
- —
- Eligible?
- —
Personal DTI + credit; lowest rate.
DSCR
20% down · 8.5% · 30yr
- Down + closing
- —
- Monthly P&I
- —
- Monthly cashflow
- —
- DSCR
- —
- Eligible?
- —
No personal income docs; deal must DSCR.
Hard money
10% down · 12.0% · 12mo
- Down + closing
- —
- Monthly P&I
- —
- Monthly cashflow
- —
- DSCR
- —
- Eligible?
- —
Short-term bridge; refi at stabilization.
Rent comps 15 comps
| Address | Beds | Baths | Sqft | Rent | $/sqft | DOM | Units | Dist |
|---|---|---|---|---|---|---|---|---|
| 3202 W Lee St Pensacola, FL | 2.0 | 1.0 | 680 | $995 | $1.46 | 13d | 1 | 0.13mi |
| 3206 W Lee St Unit A Pensacola, FL | 2.0 | 1.0 | 800 | $1,550 | $1.94 | 13d | 1 | 0.16mi |
| 1218 N Kirk St Pensacola, FL | 2.0 | 1.0 | 850 | $1,150 | $1.35 | 23d | 1 | 0.38mi |
| 2303 W Brainerd St Pensacola, FL | 2.0 | 1.0 | 955 | $1,100 | $1.15 | 23d | 1 | 0.51mi |
| 419 N Wentworth St Pensacola, FL | 2.0 | 1.0 | 1100 | $1,195 | $1.09 | 23d | 1 | 0.60mi |
| 406 N S St Pensacola, FL | 2.0 | 1.0 | 806 | $1,295 | $1.61 | 23d | 1 | 0.69mi |
| 3740 Frontera Cir Pensacola, FL | 3.0 | 1.0 | 1024 | $1,295 | $1.26 | 23d | 1 | 0.77mi |
| 1918 W Strong St Unit B Pensacola, FL | 2.0 | 1.0 | 870 | $950 | $1.09 | 13d | 1 | 0.78mi |
| 1717 W Cervantes St Pensacola, FL | 2.0 | 2.0 | 974 | $1,169 | $1.20 | 13d | 3 | 0.97mi |
| 3417 W Fisher St Unit C Pensacola, FL | 3.0 | 2.0 | 1106 | $1,350 | $1.22 | 23d | 1 | 1.02mi |
| 1804 W Belmont St Unit A Pensacola, FL | 3.0 | 1.0 | 925 | $995 | $1.08 | 21d | 1 | 1.03mi |
| 2101 W Romana St Unit A Pensacola, FL | 2.0 | 1.0 | 588 | $1,250 | $2.13 | 13d | 1 | 1.28mi |
| 2101 W Romana St Unit A Pensacola, FL | 2.0 | 1.0 | 588 | $1,250 | $2.13 | 23d | 1 | 1.28mi |
| 510 N G St Pensacola, FL | 2.0 | 1.0 | 704 | $850 | $1.21 | 23d | 1 | 1.30mi |
| 811 N D St Pensacola, FL | 2.0 | 2.0 | 1035 | $1,395 | $1.35 | 23d | 1 | 1.41mi |
Listing history 3 events
-
2026-04-04status Pending
-
2025-10-24$89,000 Active
-
1997-02-27soldstatus $13,000
ⓘ Source: listings_history table (triggers on properties + properties_extension) + one-shot
backfill from property_details.listing_events for pre-trigger history.
Tax reassessment forecast FL · Resets to sale price
- Current annual tax
- $811 · $68/mo
- Projected year-2 tax
- $811 · $68/mo
- Expected delta
- $0/yr ($0/mo · 0.0%)
ⓘ Screening estimate from a state-policy table — verify with the county assessor before closing.
Climate risk First Street
- Flood 1/10 Low FEMA zone X (unshaded) · 0% chance over 30 yrs
- Wildfire 1/10 Low
- Heat 10/10 Extreme 7 d/yr ≥105°F today · 22 d/yr by 30 yrs out
- Wind 9/10 Extreme 99% chance of damaging wind over 30 yrs
- Air quality 1/10 Low 0 unhealthy d/yr today · 0 by 30 yrs out
Nearby sold comps map
Loading sold comps map…
Walkable amenities ~0.75 mi
Loading nearby amenities…
Taxation est. · year 1
- Rental income
- $15,182
- − Mortgage interest
- −$4,985
- − Property taxes
- −$811
- − Insurance
- −$445
- − Repairs & maintenance
- −$1,215
- − Management
- −$1,215
- − Depreciation
- −$2,589
- Taxable income
- $3,922
- Est. tax owed @ 24.0%
- −$941
- After-tax cash flow
- $4,195/yr
For passive investors: Depreciation is non-cash, so a rental often shows a tax loss while cash-flowing — sheltering income. Rental losses are passive: they offset passive income freely, and up to $25,000/yr can offset ordinary (W-2) income if you actively participate and your MAGI is under $100k (phasing out to $0 by $150k); unused losses carry forward. On sale, claimed depreciation is recaptured at up to 25%, and gains may owe capital-gains tax (a 1031 exchange can defer both). Figures are a year-1 estimate at your 24.0% rate — not tax advice; consult a CPA.
Schools (NCES district)
- District
- Escambia
- NCES district ID
- 1200510
- Math proficiency
- 40% ▼ -9.00%
- Reading proficiency
- 45% ▼ -4.00%
- Median HH income
- $44,649
- Composite
- 36.04/100
- National rank
- #4773
- State rank
- #56 of 73 in FL
Livability — West Pensacola
- Score
- 66/100
- State rank
- #629
- US rank
- #12275
Category grades
Schools grade is shown separately in the Schools card above.
Census & demographics
- Census place
- West Pensacola, FL
- County
- Escambia County · 301,722 people
- Metro
- Pensacola-Ferry Pass-Brent, FL
- Population (ZIP)
- 27,877
- Household income
- $44,783
- Rent vs Own
- Severe rent burden
- 1458.0
Population outlook (Escambia County) Hauer SSP2
- Today (2025)
- 334,637 people
- By 2030
- 345,779 · +3.3%
- By 2040
- 364,828 · +9.0%
- By 2050
- 378,514 · +13.1%
- By 2075
- 403,220 · +20.5%
- By 2100
- 386,125 · +15.4%
Race, ethnicity, and origin ACS 2023
- Neighborhood character
- Diverse neighborhood (Simpson 0.66)
- Race & ethnicity
- Black 48% White 32% Hispanic / Latino 11% Two or more races 9% Asian 2%
- Hispanic origin (detail)
- Mexican 5% Cuban 2%
- Common ancestry
- Slovak 2% Italian 1% Serbian 1%
- Foreign-born
- 9% · Canada, Vietnam
- Languages at home
- 87% English-only · Spanish 9% Other Indo-European 1% Vietnamese 1%
Political lean MEDSL · Escambia
- 2024 margin
- R (+19.5) · D 39.7% · R 59.2% · Other 1.1%
- 2008→2024 swing
- -0.2pp no change · 2008: -19.3pp · 2024: -19.5pp
- All cycles
- 2024: R+19.5 2020: R+15.1 2016: R+20.6 2012: R+20.6 2008: R+19.3
Not yet ingested
- Civics
- —
Market trends
- HPI YoY
- ▼ -74.10%
- Current HPI
- 205.45
- Rent YoY
- ▲ 4.92%
- Metro
- Pensacola-Ferry Pass-Brent, FL
- State GDP YoY
- ▲ 3.28%
- F500 in state
- 36
Industry mix (Fortune 500 HQ in FL)
| Industry | F500 HQs | Revenue |
|---|---|---|
| Industrial Technology | 2 | $29B |
|
||
| Insurance | 2 | $17B |
|
||
| Retail | 1 | $60B |
|
||
| Technology Distribution | 1 | $58B |
|
||
| Homebuilding | 1 | $35B |
|
||
| Technology Manufacturing | 1 | $35B |
|
||
Price history
+584.6% since first listed3 events — show timeline
- 2026-04-04 Pending — PARMLS
- 2025-10-24 Listed $89,000 PARMLS
- 1997-02-27 Sold (Public Records) $13,000 Public Records
Property tax history
+6.8%/yrLatest (2025): $811 · +24.1% YoY. Source: county tax records.
Cash-flow waterfall
monthlySold comps — $/sqft
last 12 mo · ≤1 miLoading sold comps…