4537 Gaywood Dr · Fort Wayne, IN
Flood risk 1/10 · Minimal
- FEMA flood zone
- X (unshaded)
- Chance of flooding over 30 yrs
- 0.0%
- Est. flood insurance / yr
- $473 – $860
Fire risk 1/10 · Minimal
- Est. fire insurance / yr
- $717 – $1,331
Heat risk 2/10 · Minimal
- Hot days now (above 100°F)
- 6 days/yr
- Hot days in 30 yrs
- 14 days/yr
Wind risk 2/10 · Minimal
- Chance of severe wind over 30 yrs
- —
Air-quality risk 3/10 · Minor
- Unhealthy air days now
- 2 days/yr
- Unhealthy air days in 30 yrs
- 3 days/yr
Risk factors via First Street. Map © Google.
Why this score? — see what drove the C+ grade
The composite is a weighted blend of 9 inputs, each scored 0–100. Each bar is that input's sub-score; the figure is the points it added to the 100-point composite (weight × sub-score).
- Cash flow +22.7/30.0
- ARV discount +15.0/15.0
- DSCR +7.3/10.0
- 1% rule +6.0/10.0
- Livability +4.2/5.0
- Rent growth +3.7/5.0
- Condition / age +2.5/5.0
- Schools +2.2/10.0
- Appreciation +0.0/10.0
$90,000
🖨 Deal sheet (PDF) 📄 Offer letter ✓ Due diligence
Listing remarks MLS
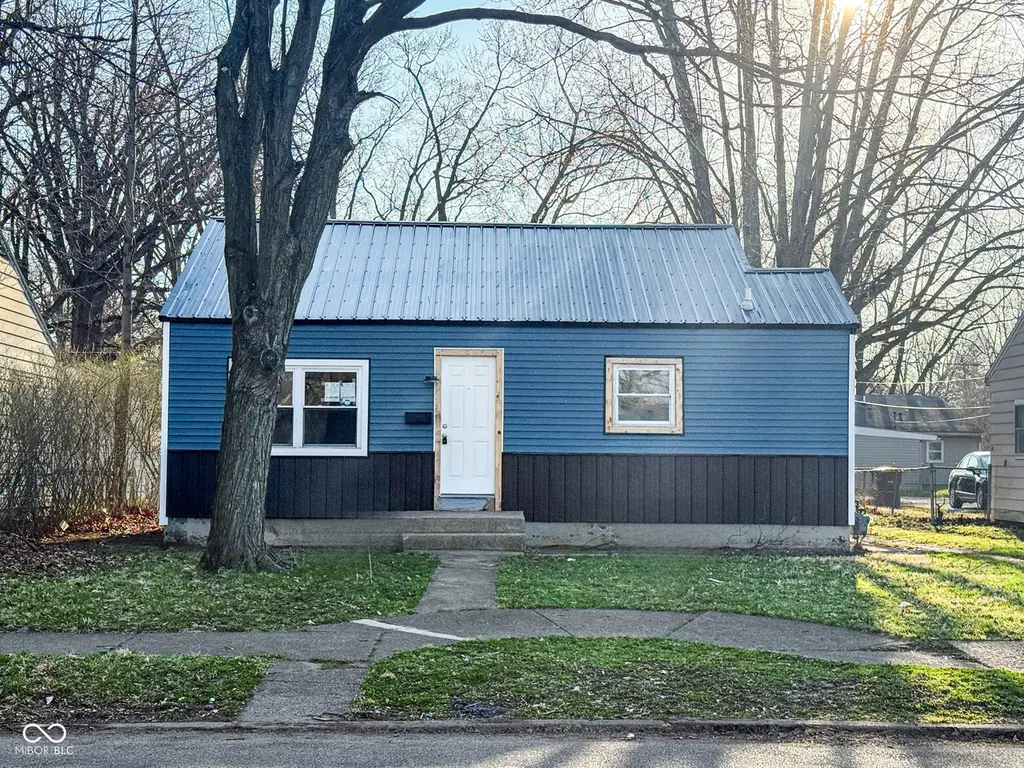
This cottage-style home has a warm, welcoming feel from the moment you arrive. Inside, the layout offers comfortable living with flexible space that can be set up to fit your needs. Whether you're looking for a place to settle into or something you can personalize, this home is worth a visit. Built in 1945, this single-level home offers 1,179 square feet per county records and features a low-maintenance vinyl exterior. The home can function as a two-bedroom with a larger living room, or as a three-bedroom with a wall already added-giving you the option to choose what works best for your lifestyle. One full bathroom completes the layout, along with a simple, easy-to-maintain setup for everyday living.
Key facts
- 6,384 sq ft lot
- Built 1945
- Listed 79 days
Neighborhood map
What this means for you Summary
Snapshot
- This is a 2-bed/1.0-bath single-family listed at $90k.
Deal economics
- At list price, monthly cash flow is $154 ($2k/yr) — positive.
- The deal already cash-flows at list — no discount required.
- Meets the 1% rule at list price ($994 rent vs $90k).
- Recommended offer: $85k (6.0% below list) — sets the bar for market timing.
- Cap rate 8.4% vs local median 4.7% in Fort Wayne — top-decile yield for the area; either an underpriced asset or a hidden risk that comps aren't pricing in. Stress-test before assuming the spread holds.
Location & tenants
- Location reads 84/100 on livability (#6 in IN, #676 nationally) — a professional / high-income tenant draw. Strengths: amenities A+, commute A+, cost of living A+; Watch: crime C-, schools D+, employment D+.
- Fort Wayne Community Schools (urban): math 22% / reading 29% proficiency, ranked #263 of 301 in IN (top 87%) — low school quality limits family demand, transient renter base, plan for 1-2y turnover; 60% free/reduced lunch — lower-income household profile, screen leases tightly.
- Market conditions: Rents rising fast (+4.9%/yr); 129 active listings in the ZIP; 27 comparable units currently listed for rent nearby; rentals at typical pace (median 23d on market — plan ~3-4 weeks tenant-placement turnaround); 41% of comp listings sitting > 30 days — soft ceiling on asking rent; 1,861 units permitted in Allen County in 2024 (576 in 5+ unit buildings).
Forward outlook
- Local home prices are declining (-3.0%/yr); year-one equity from $622 of loan paydown is wiped out by about $3k of value loss. Plan a longer hold.
- Allen County population projected at +10% by 2050 — modest demand growth; plan on rents tracking national, not racing it.
- At projected returns (-3.0% appreciation + 4.9% rent growth), your $25k cash investment doubles in ~10 years — after that, you're playing with house money.
Negotiation context
- It's been on market 79 days — a 6% lower offer ($85k) is reasonable based on typical stale-listing flexibility.
- 3 sale attempts since 10y ago; this cycle's ask has dropped $25k (22%) from the opening price — seller is motivated, your offer sets the floor, not the list.
- Current owner paid $24k; list at $90k implies a 275% gain — meaningful room to come down on a strong offer.
Risks & watch-outs
- Watch-outs: built in 1945 — expect roof / HVAC / electrical / plumbing capex.
Questions for the listing agent
- It's been on market 79 days. Have you received any prior offers? Is the seller open to a 6% concession, seller financing, or rate buy-down credit?
- Built in 1945 — when were the roof, HVAC, electrical panel, plumbing, and water heater last replaced?
- Why hasn't it sold? Are there any deal-killer items the seller is aware of (foundation, flood, title, zoning, code violations)?
- Is there a deadline driving the sale (1031 exchange, divorce, estate, relocation)? That informs how much negotiation room exists.
- Schools are D-rated, which usually means shorter tenancies and higher turnover. Who's the typical renter profile here, and what's been the actual vacancy rate?
- What's the average days-on-market for RENTAL listings here right now (not sales)? A rising rental-DOM trend means longer vacancies and softer asking-rent achievability than the comps imply.
- What's the recent tenant-quality profile in this submarket — average credit score on applications, eviction rate, late-payment / NSF rate, and stable-employment percentage? A property-management company in the area should have these aggregated.
- How much new for-sale + rental construction is in the pipeline within 1–3 miles? Heavy new supply typically softens prices + rents 12–24 months out; constrained supply supports both.
Investment metrics
- 1% rule
- 1.10% ✓
- Cap rate
- 8.35%
- Cash-on-cash
- 7.35%
- DSCR
- 1.33
- GRM
- 7.5
CMA / ARV
- ARV (median comp)
- $120,776
- List price
- $90,000
- Delta
- -25.48%
- Verdict
- UNDERPRICED
- Comps
- 20 within 1.0 mi
Show comp detail 12 sales within ~0.75 mi
| Address | Dist | Beds/Ba | Sqft | Sold | Price | $/sf | Match |
|---|---|---|---|---|---|---|---|
| 4817 South Park Dr | 0.23mi | 3/1.0 (+1) | 768 (-2%) | 3mo | $52,000 | $68 | 78 |
| 3920 Smith St | 0.47mi | 2/1.0 | 804 (+2%) | 4mo | $56,000 | $70 | 71 |
| 4821 Oliver St | 0.23mi | 3/1.0 (+1) | 825 (+5%) | 6mo | $114,900 | $139 | 71 |
| 4516 Spatz Ave | 0.09mi | 2/1.0 | 700 (-11%) | 8mo | $143,000 | $204 | 71 |
| 826 Baxter St | 0.39mi | 2/1.0 | 836 (+6%) | 1mo | $82,900 | $99 | 70 |
| 4605 Spatz Ave | 0.06mi | 3/1.0 (+1) | 878 (+12%) | 3mo | $71,500 | $81 | 70 |
| 4617 Avondale Dr | 0.44mi | 2/1.0 | 725 (-8%) | 1mo | $120,000 | $166 | 66 |
| 4343 Lillie St | 0.46mi | 2/1.0 | 825 (+5%) | 7mo | $84,500 | $102 | 65 |
| 4121 Monroe St | 0.46mi | 2/1.0 | 725 (-8%) | 5mo | $42,000 | $58 | 62 |
| 4315 S Colonial Ave | 0.69mi | 2/1.0 | 800 (+2%) | 7mo | $88,500 | $111 | 59 |
| 3805 Monroe St | 0.64mi | 2/1.0 | 874 (+11%) | 3mo | $129,000 | $148 | 49 |
| 3629 Robinwood Dr | 0.66mi | 2/1.0 | 880 (+12%) | 1mo | $130,000 | $148 | 49 |
Match score weights: distance 35% · size 25% · config 20% · recency 20%. Top-matched comps best support the ARV.
Projected returns pro-forma
-3.0% appreciation · 4.93% rent growth · sell at horizon
- IRR
- -2.9%
- Equity multiple
- 0.89×
- Total profit
- $-2,760
- Equity at exit
- $13,419
- IRR
- 8.9%
- Equity multiple
- 1.74×
- Total profit
- $18,746
- Equity at exit
- $7,782
Cash invested: $25,200 (down + closing). Projections, not guarantees.
Landlord ↔ Tenant lean methodology
- Overall (STATE)
- 90 Strongly Landlord-Friendly
- State Indiana
- 90 Strongly Landlord-Friendly · R+11
- County
- — inherits STATE
- City
- — inherits STATE
ZIP-level market 46806
- Home prices YoY
- -33.6%
- Rents YoY
- 4.9%
- Active inventory
- 129
- Price-to-rent
- 7.5×
Monthly cashflow live
- Estimated rent
- $994 high interval (Pro) →
- Mortgage (P&I)
- −$472
- Tax from tax record
- −$122 /mo · $1,461/yr
- Insurance
- −$38
- HOA
- −$0
- Vacancy / Maint / Mgmt
- −$209
- Net cashflow
- $154
Break-even live
Sensitivity live
| Price | -10% $205 | -5% $180 | +0% $154 | +5% $129 | +10% $103 |
|---|---|---|---|---|---|
| Rent | -10% $76 | -5% $115 | +0% $154 | +5% $194 | +10% $233 |
| Rate | -1.0pp $200 | -0.5pp $177 | base $154 | +0.5pp $131 | +1.0pp $107 |
UW: 25.0% down · 7.5% · 30yr · 1.5% tax · 5.0% vac · 8.0% maint · 8.0% mgmt
Financing live
Cash to close
- Down payment
- $22,500
- Closing costs
- $2,700
- Reserves months
- —
- Total cash needed
- —
Loan-product check · same deal, 3 products live
Conventional
25% down · 7.5% · 30yr
- Down + closing
- —
- Monthly P&I
- —
- Monthly cashflow
- —
- DSCR
- —
- Eligible?
- —
Personal DTI + credit; lowest rate.
DSCR
20% down · 8.5% · 30yr
- Down + closing
- —
- Monthly P&I
- —
- Monthly cashflow
- —
- DSCR
- —
- Eligible?
- —
No personal income docs; deal must DSCR.
Hard money
10% down · 12.0% · 12mo
- Down + closing
- —
- Monthly P&I
- —
- Monthly cashflow
- —
- DSCR
- —
- Eligible?
- —
Short-term bridge; refi at stabilization.
Rent comps 27 comps
| Address | Beds | Baths | Sqft | Rent | $/sqft | DOM | Units | Dist |
|---|---|---|---|---|---|---|---|---|
| 4522 Spatz Ave Fort Wayne, IN | 2.0 | 1.0 | 840 | $950 | $1.13 | 45d | 1 | 0.10mi |
| 4129 Bowser Ave Fort Wayne, IN | 3.0 | 1.5 | 850 | $1,250 | $1.47 | 22d | 1 | 0.32mi |
| 4014 Oliver St Fort Wayne, IN | 3.0 | 1.0 | 936 | $1,050 | $1.12 | 15d | 1 | 0.39mi |
| 4121 Monroe St Fort Wayne, IN | 2.0 | 1.0 | 725 | $1,100 | $1.52 | 15d | 1 | 0.46mi |
| 4330 S Anthony Blvd Unit 4402 Fort Wayne, IN | 1.0 | 1.0 | 575 | $900 | $1.57 | 15d | 1 | 0.46mi |
| 4655 Avondale Dr Fort Wayne, IN | 2.0 | 1.0 | 768 | $875 | $1.14 | 45d | 1 | 0.47mi |
| 4705 S Anthony Blvd Fort Wayne, IN | 3.0 | 1.0 | 1110 | $1,050 | $0.95 | 15d | 1 | 0.49mi |
| 3932 Winter St Fort Wayne, IN | 2.0 | 1.0 | 750 | $875 | $1.17 | 45d | 1 | 0.53mi |
| 4331 Lafayette St Fort Wayne, IN | 2.0 | 1.0 | 810 | $925 | $1.14 | 15d | 1 | 0.55mi |
| 4126 Lafayette St Fort Wayne, IN | 2.0 | 1.0 | 775 | $1,275 | $1.65 | 45d | 1 | 0.63mi |
| 4018 S Clinton St Fort Wayne, IN | 3.0 | 1.0 | 860 | $1,000 | $1.16 | 22d | 1 | 0.75mi |
| 3801 Lafayette St Fort Wayne, IN | 2.0 | 1.0 | 1116 | $995 | $0.89 | 15d | 1 | 0.76mi |
| 4325 Werling Dr Fort Wayne, IN | 1.0–3.0 | 1.0–2.0 | 923 | $1,008 | $1.09 | 45d | 1 | 0.76mi |
| 3410 S Anthony Blvd Fort Wayne, IN | 3.0 | 1.0 | 900 | $1,200 | $1.33 | 45d | 1 | 0.87mi |
| 5009 Hoagland Ave Fort Wayne, IN | 2.0 | 1.0 | 1000 | $1,300 | $1.30 | 45d | 1 | 1.09mi |
| 442 E Wildwood Ave Fort Wayne, IN | 2.0 | 1.0 | 864 | $875 | $1.01 | 22d | 1 | 1.09mi |
| 1004 Fayette Dr Fort Wayne, IN | 1.0–2.0 | 1.0 | 679 | $1,199 | $1.76 | 15d | 18 | 1.10mi |
| 227 W Darrow Ave Fort Wayne, IN | 3.0 | 1.0 | 995 | $1,000 | $1.01 | 45d | 1 | 1.17mi |
| 418 W Rudisill Blvd Unit 2 Fort Wayne, IN | 2.0 | 1.0 | 768 | $975 | $1.27 | 22d | 1 | 1.21mi |
| 6033 S Calhoun St Fort Wayne, IN | 3.0 | 1.0 | 1042 | $1,220 | $1.17 | 22d | 1 | 1.22mi |
| 5800 Turtle Creek Dr Unit 5840-5 Fort Wayne, IN | 1.0 | 1.0 | 570 | $639 | $1.12 | 22d | 1 | 1.24mi |
| 3113 S Harrison St Unit 2 Fort Wayne, IN | 2.0 | 1.0 | 600 | $850 | $1.42 | 15d | 1 | 1.27mi |
| 308 Pursley Dr Fort Wayne, IN | 3.0 | 1.0 | 850 | $1,100 | $1.29 | 45d | 1 | 1.32mi |
| 2754 E Paulding Rd Fort Wayne, IN | 1.0–3.0 | 1.0–2.5 | 997 | $894 | $0.90 | 15d | 14 | 1.35mi |
| 2919 S Harrison St Unit 2921 Fort Wayne, IN | 2.0 | 1.0 | 538 | $825 | $1.53 | 22d | 1 | 1.35mi |
| 405 Pursley Dr Fort Wayne, IN | 2.0 | 1.0 | 720 | $850 | $1.18 | 45d | 1 | 1.43mi |
| 3718 S Wayne Ave Fort Wayne, IN | 1.0 | 1.0 | 568 | $795 | $1.40 | 45d | 1 | 1.44mi |
Listing history 18 events
-
2026-06-18days on market $90,000 Active 79 DOM
-
2026-06-17days on market $90,000 Active 78 DOM
-
2026-06-16days on market $90,000 Active 77 DOM
-
2026-06-15days on market $90,000 Active 76 DOM
-
2026-06-14pricedays on market $90,000 Active 74 DOM
-
2026-06-10days on market $95,000 Active 71 DOM
-
2026-06-09days on market $95,000 Active 70 DOM
-
2026-06-08days on market $95,000 Active 69 DOM
-
2026-06-07days on market $95,000 Active 68 DOM
-
2026-06-03days on market $95,000 Active 64 DOM
-
2026-06-02days on market $95,000 Active 63 DOM
-
2026-06-01days on market $95,000 Active 62 DOM
-
2026-05-31days on market $95,000 Active 61 DOM
-
2026-05-30days on market $95,000 Active 60 DOM
-
2026-03-31$115,000 Active 712-char remark
Show marketing remark (741 chars)
Welcome to 4537 Gaywood Drive, a well-maintained 2-bedroom, 1-bath home offering 786 finished square feet of comfortable living space in Fort Wayne's established Summit Park neighborhood. Built in 1945, this site-built home blends classic character with practical features for everyday living. Inside, you'll find a functional layout with two main-level bedrooms, convenient main-level laundry, and gas forced-air heating to keep things comfortable year-round. — The home features durable vinyl siding and sits on a level 0.15-acre city lot with plenty of yard space for outdoor enjoyment, gardening, or entertaining. Seller financing available for qualified buyers with a large down payment — contact listing agent for details!
-
2026-03-31$115,000 Active 741-char remark
Show marketing remark (741 chars)
Welcome to 4537 Gaywood Drive, a well-maintained 2-bedroom, 1-bath home offering 786 finished square feet of comfortable living space in Fort Wayne's established Summit Park neighborhood. Built in 1945, this site-built home blends classic character with practical features for everyday living. Inside, you'll find a functional layout with two main-level bedrooms, convenient main-level laundry, and gas forced-air heating to keep things comfortable year-round. — The home features durable vinyl siding and sits on a level 0.15-acre city lot with plenty of yard space for outdoor enjoyment, gardening, or entertaining. Seller financing available for qualified buyers with a large down payment — contact listing agent for details!
-
2017-02-07soldstatus $24,000
-
2016-10-15$25,650
ⓘ Source: listings_history table (triggers on properties + properties_extension) + one-shot
backfill from property_details.listing_events for pre-trigger history.
Tax reassessment forecast IN · Partial reset (capped growth)
- Current annual tax
- $1,461 · $122/mo
- Projected year-2 tax
- $1,461 · $122/mo
- Expected delta
- $0/yr ($0/mo · 0.0%)
ⓘ Screening estimate from a state-policy table — verify with the county assessor before closing.
Climate risk First Street
- Flood 1/10 Low FEMA zone X (unshaded) · 0% chance over 30 yrs
- Wildfire 1/10 Low
- Heat 2/10 Low 6 d/yr ≥100°F today · 14 d/yr by 30 yrs out
- Wind 2/10 Low
- Air quality 3/10 Moderate 2 unhealthy d/yr today · 3 by 30 yrs out
Nearby sold comps map
Loading sold comps map…
Walkable amenities ~0.75 mi
Loading nearby amenities…
Taxation est. · year 1
- Rental income
- $11,934
- − Mortgage interest
- −$5,041
- − Property taxes
- −$1,461
- − Insurance
- −$450
- − Repairs & maintenance
- −$955
- − Management
- −$955
- − Depreciation
- −$2,618
- Taxable income
- $454
- Est. tax owed @ 24.0%
- −$109
- After-tax cash flow
- $1,744/yr
For passive investors: Depreciation is non-cash, so a rental often shows a tax loss while cash-flowing — sheltering income. Rental losses are passive: they offset passive income freely, and up to $25,000/yr can offset ordinary (W-2) income if you actively participate and your MAGI is under $100k (phasing out to $0 by $150k); unused losses carry forward. On sale, claimed depreciation is recaptured at up to 25%, and gains may owe capital-gains tax (a 1031 exchange can defer both). Figures are a year-1 estimate at your 24.0% rate — not tax advice; consult a CPA.
Schools (NCES district)
- District
- Fort Wayne Community Schools
- NCES district ID
- 1803630
- Math proficiency
- 22% ▼ -11.00%
- Reading proficiency
- 29% ▼ -7.00%
- Median HH income
- $41,951
- Composite
- 21.68/100
- National rank
- #8275
- State rank
- #263 of 301 in IN
Livability — Fort Wayne
- Score
- 84/100
- State rank
- #6
- US rank
- #676
Category grades
Schools grade is shown separately in the Schools card above.
Census & demographics
- Census place
- Fort Wayne, IN
- County
- Allen County · 326,813 people
- City population
- 326,813
- Metro
- Fort Wayne, IN
- Population (ZIP)
- 26,425
- Household income
- $47,895
- Rent vs Own
- Severe rent burden
- 1184.0
Population outlook (Allen County) Hauer SSP2
- Today (2025)
- 394,020 people
- By 2030
- 405,128 · +2.8%
- By 2040
- 423,476 · +7.5%
- By 2050
- 435,137 · +10.4%
- By 2075
- 450,293 · +14.3%
- By 2100
- 424,101 · +7.6%
Race, ethnicity, and origin ACS 2023
- Neighborhood character
- Highly diverse neighborhood (Simpson 0.74)
- Race & ethnicity
- Black 37% Hispanic / Latino 26% White 21% Asian 12% Two or more races 11% Native American 2%
- Hispanic origin (detail)
- Mexican 18% Puerto Rican 1%
- Common ancestry
- Italian 1% Romanian 1% Lithuanian 1%
- Foreign-born
- 19% · Canada, Philippines, South Korea
- Languages at home
- 71% English-only · Spanish 19% Other Asian/Pacific 9%
Political lean MEDSL · Allen
- 2024 margin
- R (+12.5) · D 42.9% · R 55.4% · Other 1.7%
- 2008→2024 swing
- -8.1pp toward R · 2008: -4.3pp · 2024: -12.5pp
- All cycles
- 2024: R+12.5 2020: R+11.2 2016: R+19.6 2012: R+16.8 2008: R+4.3
Not yet ingested
- Civics
- —
Market trends
- HPI YoY
- ▼ -148.00%
- Current HPI
- 291.8198
- Rent YoY
- ▲ 4.93%
- Metro
- Fort Wayne, IN
- State GDP YoY
- ▲ 2.90%
- F500 in state
- 18
Industry mix (Fortune 500 HQ in IN)
| Industry | F500 HQs | Revenue |
|---|---|---|
| Industrial Machinery | 2 | $37B |
|
||
| Healthcare | 1 | $177B |
|
||
| Pharmaceuticals | 1 | $45B |
|
||
| Metals / Steel | 1 | $18B |
|
||
| Agriculture | 1 | $17B |
|
||
| Packaging | 1 | $12B |
|
||
Price history
+348.3% since first listed4 events — show timeline
- 2026-03-31 Listed $115,000 IRMLS
- 2026-03-31 Listed $115,000 MIBOR as Distributed by MLS Grid
- 2017-02-07 Sold (MLS) $24,000 IRMLS
- 2016-10-15 Listed $25,650 IRMLS
Property tax history
+15.2%/yrLatest (2024): $1,461 · -3.6% YoY. Source: county tax records.
Cash-flow waterfall
monthlySold comps — $/sqft
last 12 mo · ≤1 miLoading sold comps…