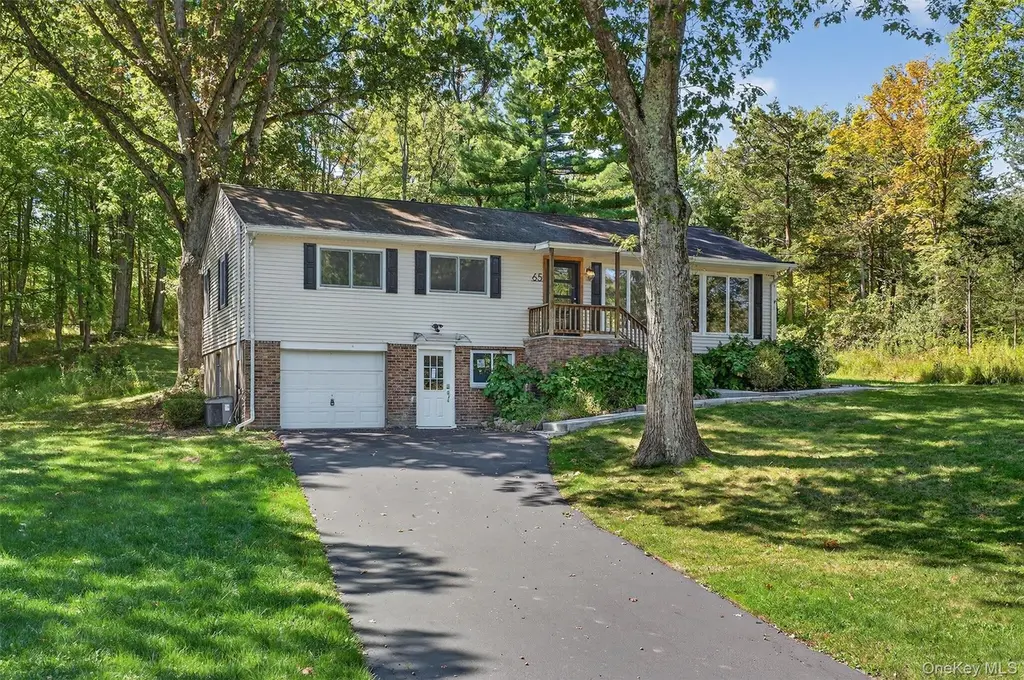
65 Hawxhurst Rd · Monroe, NY
Flood risk 1/10 · Minimal
- FEMA flood zone
- X (unshaded)
- Chance of flooding over 30 yrs
- 0.0%
- Est. flood insurance / yr
- $473 – $860
Fire risk 6/10 · Moderate
- Est. fire insurance / yr
- $691 – $1,283
Heat risk 4/10 · Minor
- Hot days now (above 96°F)
- 7 days/yr
- Hot days in 30 yrs
- 15 days/yr
Wind risk 4/10 · Minor
- Chance of severe wind over 30 yrs
- 15.0%
Air-quality risk 2/10 · Minimal
- Unhealthy air days now
- 2 days/yr
- Unhealthy air days in 30 yrs
- 2 days/yr
Risk factors via First Street. Map © Google.
Why this score? — see what drove the F grade
The composite is a weighted blend of 9 inputs, each scored 0–100. Each bar is that input's sub-score; the figure is the points it added to the 100-point composite (weight × sub-score).
- ARV discount +15.0/15.0
- Schools +5.0/10.0
- Cash flow +4.9/30.0
- Livability +3.6/5.0
- Rent growth +2.9/5.0
- Condition / age +2.5/5.0
- 1% rule +1.0/10.0
- DSCR +0.0/10.0
- Appreciation +0.0/10.0
$599,000
🖨 Deal sheet (PDF) 📄 Offer letter ✓ Due diligence
Listing remarks
Amazing Home, Amazing Price! Come see this beautiful home that perfectly combines style, comfort, and space. The modern design and fresh interior make it a place you’ll love coming home to every day. Bright, open rooms flow nicely for both family living and entertaining guests. Sitting on nearly an acre of land on a quiet, peaceful street, this property offers plenty of outdoor space for gardening, playing, or simply relaxing in your own private backyard. Located in a great neighborhood with easy access to schools, parks, and local shops—this home truly has it all. Don’t miss your chance to make it yours! The 4- and 5-bedroom will be completed after construction is finish
Key facts
- 0.92 acre lot
- Garage
- Built 1960
Property features AI
Exterior
- Parking: Attached parking; Driveway; 1-car garage
- Utilities: Septic tank; Electricity available
- Home design: Single-family residence; Updated/remodeled condition
- Construction: Frame construction
- Exterior features: Frame construction; Not waterfront
Interior
- Kitchen: Dishwasher; Oven; Range; Refrigerator; Stainless steel appliances
- Bedrooms: Bedroom on the first floor
- Flooring: Hardwood floors; Tile floors
- Bathrooms: 2 full bathrooms
- Heating & cooling: Forced air heating; Central air conditioning
- Interior features: First-floor bedroom; First-floor full bathroom; Finished full basement (see remarks); Pull-down attic stairs; attic unfinished; Two levels; 9 total rooms; Has fireplace
- Laundry & utility: Washer; Laundry located in the basement
Neighborhood map
What this means for you Summary
Snapshot
- This is a 3-bed/1.5-bath single-family listed at $599k.
Deal economics
- At list price, monthly cash flow is $-1k ($-17k/yr) — negative.
- To cash-flow at today's rent, offer at most $346k (42.2% below list).
- To meet the 1% rule (rent ≥ 1% of price), the offer needs to be $359k (40.0% below list).
- Recommended offer: $346k (42.2% below list) — sets the bar for cash-flow.
Location & tenants
- Location reads 72/100 on livability (#351 in NY) — a middle-class / working-renter tenant base. Strengths: employment A+, housing A+, health & safety A+; Watch: amenities F, commute F, cost of living F.
- Monroe-Woodbury Central School District (suburban): math 50% / reading 56% proficiency, ranked #250 of 590 in NY (top 42%) — acceptable for families but not a draw, mixed tenant base, ~2y average lease; only 15% free/reduced lunch — higher-income household profile.
- Zoned schools: Pine Tree Elementary School (math 43% / reading 48%, grade D-, #1,271 of 2,108 statewide, top 60%, 786 students, 42% FRL); Monroe-Woodbury Middle School (math 28% / reading 50%, grade F, #433 of 729 statewide, top 60%, 1,584 students, 40% FRL); Monroe-Woodbury High School (math 98% / reading 95%, grade A+, #56 of 1,100 statewide, top 5%, 2,353 students, 33% FRL) — zoned schools average 38% FRL vs 15% district-wide (24 pts higher); higher-poverty schools than district average — tighter screening recommended.
- Market conditions: Rents rising (+1.5%/yr); 322 active listings in the ZIP; 2 comparable units currently listed for rent nearby; solid renter incomes; 1,746 units permitted in Orange County in 2024 (1,265 in 5+ unit buildings).
- At $3,591/mo this rent would consume 55% of the median local household income ($79k/yr) (locally 3149% of renters already pay >50% of income on rent) — very limited rent-growth headroom before tenants either downsize or default.
Forward outlook
- Local home prices are declining (-3.0%/yr); year-one equity from $4k of loan paydown is wiped out by about $18k of value loss. Plan a longer hold.
Negotiation context
- It's been on market 57 days — a 3% lower offer ($581k) is reasonable based on typical stale-listing flexibility.
- 8 sale attempts since 10y ago with the ask held roughly flat each time — persistent listings suggest the price (not the market) is what's stuck; bring a comps-based counter.
- Current owner paid $435k; 38% above their basis — modest negotiation headroom, anchor on the comps not their cost.
Risks & watch-outs
- Climate carrying-cost: major wildfire risk — expect insurance premiums to compound above CPI over the hold.
Questions for the listing agent
- What do current leases actually rent for vs. the listed asking? Can we see a recent rent roll and the last 12 months of T-12 income?
- It's been on market 57 days. Have you received any prior offers? Is the seller open to a 42% concession, seller financing, or rate buy-down credit?
- Built in 1960 — when were the roof, HVAC, electrical panel, plumbing, and water heater last replaced?
- Is there a deadline driving the sale (1031 exchange, divorce, estate, relocation)? That informs how much negotiation room exists.
- Schools are B-rated — typically a magnet for longer-tenancy family renters. What's the average tenant stay here, and is there a school-zone premium baked into asking?
- The area grade is low — what's the realistic commute time and amenity access for the typical tenant pool here? Any planned neighborhood developments (good or bad) we should know about?
- What's the average days-on-market for RENTAL listings here right now (not sales)? A rising rental-DOM trend means longer vacancies and softer asking-rent achievability than the comps imply.
- What's the recent tenant-quality profile in this submarket — average credit score on applications, eviction rate, late-payment / NSF rate, and stable-employment percentage? A property-management company in the area should have these aggregated.
- How much new for-sale + rental construction is in the pipeline within 1–3 miles? Heavy new supply typically softens prices + rents 12–24 months out; constrained supply supports both.
Investment metrics
- 1% rule
- 0.60% ✗
- Cap rate
- 3.43%
- Cash-on-cash
- -10.24%
- DSCR
- 0.54
- GRM
- 13.9
CMA / ARV
- ARV (median comp)
- $968,851
- List price
- $599,000
- Delta
- -38.17%
- Verdict
- UNDERPRICED
- Comps
- 20 within 1.0 mi
Show comp detail 1 sale within ~0.75 mi
| Address | Dist | Beds/Ba | Sqft | Sold | Price | $/sf | Match |
|---|---|---|---|---|---|---|---|
| 11 High Ridge Rd | 0.46mi | 3/2.0 | 1,203 (-6%) | 10mo | $480,000 | $399 | 58 |
Match score weights: distance 35% · size 25% · config 20% · recency 20%. Top-matched comps best support the ARV.
Projected returns pro-forma
-3.0% appreciation · 1.5% rent growth · sell at horizon
- IRR
- -36.4%
- Equity multiple
- -0.15×
- Total profit
- $-193,423
- Equity at exit
- $89,313
- IRR
- -62.3%
- Equity multiple
- -0.83×
- Total profit
- $-306,523
- Equity at exit
- $51,791
Cash invested: $167,720 (down + closing). Projections, not guarantees.
Landlord ↔ Tenant lean methodology
- Overall (STATE)
- 15 Strongly Tenant-Friendly
- State New York
- 15 Strongly Tenant-Friendly · D+10
- County
- — inherits STATE
- City
- — inherits STATE
ZIP-level market 10950
- Rents YoY
- 1.5%
- Active inventory
- 322
- Price-to-rent
- 13.9×
Monthly cashflow live
- Estimated rent
- $3,591 medium interval (Pro) →
- Mortgage (P&I)
- −$3,141
- Tax from tax record
- −$877 /mo · $10,529/yr
- Insurance
- −$250
- HOA
- −$0
- Lot rent
- −$0
- Vacancy / Maint / Mgmt
- −$754
- Net cashflow
- $-1,431
Break-even live
Sensitivity live
| Price | -10% $-1,092 | -5% $-1,262 | +0% $-1,431 | +5% $-1,601 | +10% $-1,770 |
|---|---|---|---|---|---|
| Rent | -10% $-1,715 | -5% $-1,573 | +0% $-1,431 | +5% $-1,289 | +10% $-1,147 |
| Rate | -1.0pp $-1,130 | -0.5pp $-1,279 | base $-1,431 | +0.5pp $-1,586 | +1.0pp $-1,744 |
UW: 25.0% down · 7.5% · 30yr · 1.5% tax · 5.0% vac · 8.0% maint · 8.0% mgmt
Financing live
Cash to close
- Down payment
- $149,750
- Closing costs
- $17,970
- Reserves months
- —
- Total cash needed
- —
Loan-product check · same deal, 3 products live
Conventional
25% down · 7.5% · 30yr
- Down + closing
- —
- Monthly P&I
- —
- Monthly cashflow
- —
- DSCR
- —
- Eligible?
- —
Personal DTI + credit; lowest rate.
DSCR
20% down · 8.5% · 30yr
- Down + closing
- —
- Monthly P&I
- —
- Monthly cashflow
- —
- DSCR
- —
- Eligible?
- —
No personal income docs; deal must DSCR.
Hard money
10% down · 12.0% · 12mo
- Down + closing
- —
- Monthly P&I
- —
- Monthly cashflow
- —
- DSCR
- —
- Eligible?
- —
Short-term bridge; refi at stabilization.
Rent comps 2 comps
| Address | Beds | Baths | Sqft | Rent | $/sqft | DOM | Units | Dist |
|---|---|---|---|---|---|---|---|---|
| 98 Ludlam Rd Monroe, NY | 3.0 | 2.0 | 1848 | $3,350 | $1.81 | 46d | 1 | 1.02mi |
| 50 Bonney Ct Unit 50 Monroe, NY | 2.0 | 2.0 | 1235 | $2,900 | $2.35 | 25d | 1 | 1.18mi |
Listing history 39 events
-
2026-06-21days on market $599,000 Active 57 DOM
-
2026-06-18days on market $599,000 Active 54 DOM
-
2026-06-17days on market $599,000 Active 53 DOM
-
2026-06-16days on market $599,000 Active 52 DOM
-
2026-06-15days on market $599,000 Active 51 DOM
-
2026-06-14days on market $599,000 Active 49 DOM
-
2026-06-10days on market $599,000 Active 46 DOM
-
2026-06-09days on market $599,000 Active 45 DOM
-
2026-06-08days on market $599,000 Active 44 DOM
-
2026-06-07days on market $599,000 Active 43 DOM
-
2026-06-05days on market $599,000 Active 40 DOM
-
2026-06-02days on market $599,000 Active 38 DOM
-
2026-06-01days on market $599,000 Active 37 DOM
-
2026-05-31days on market $599,000 Active 36 DOM
-
2026-05-30days on market $599,000 Active 35 DOM
-
2026-04-26$599,000 Active 768-char remark
-
2026-04-23historical $599,000 768-char remark
-
2025-12-30status Active
-
2025-12-30price $599,000
-
2025-12-20historical
-
2025-11-18price $639,000
-
2025-10-16$649,000 Active
-
2025-10-06historical
-
2025-09-01historical
-
2025-08-11price $699,000
-
2025-07-14$789,000 Active
-
2024-08-05soldstatus $435,000
-
2024-07-17soldstatus $435,000 Closed
-
2024-06-05status Pending
-
2024-05-03$449,999 Active
-
2024-04-29historical $449,999
-
2016-09-28soldstatus $205,000
-
2016-07-01soldstatus $205,000 Sold
-
2016-07-01price $205,000
-
2016-06-30soldstatus $205,000
-
2016-05-27historical Pending
-
2016-05-26price $219,000
-
2016-04-16$219,000 Active
-
2016-04-15$219,000
ⓘ Source: listings_history table (triggers on properties + properties_extension) + one-shot
backfill from property_details.listing_events for pre-trigger history.
Tax reassessment forecast NY · Partial reset (capped growth)
- Current annual tax
- $10,529 · $877/mo
- Projected year-2 tax
- $10,529 · $877/mo
- Expected delta
- $0/yr ($0/mo · 0.0%)
ⓘ Screening estimate from a state-policy table — verify with the county assessor before closing.
Climate risk First Street
- Flood 1/10 Low FEMA zone X (unshaded) · 0% chance over 30 yrs
- Wildfire 6/10 Major
- Heat 4/10 Moderate 7 d/yr ≥96°F today · 15 d/yr by 30 yrs out
- Wind 4/10 Moderate 15% chance of damaging wind over 30 yrs
- Air quality 2/10 Low 2 unhealthy d/yr today · 2 by 30 yrs out
Nearby sold comps map
Loading sold comps map…
Walkable amenities ~0.75 mi
Loading nearby amenities…
Taxation est. · year 1
- Rental income
- $43,094
- − Mortgage interest
- −$33,553
- − Property taxes
- −$10,529
- − Insurance
- −$2,995
- − Repairs & maintenance
- −$3,448
- − Management
- −$3,448
- − Depreciation
- −$17,425
- Taxable loss
- −$28,303
- Est. tax savings @ 24.0%
- +$6,793
- After-tax cash flow
- $-10,381/yr
For passive investors: Depreciation is non-cash, so a rental often shows a tax loss while cash-flowing — sheltering income. Rental losses are passive: they offset passive income freely, and up to $25,000/yr can offset ordinary (W-2) income if you actively participate and your MAGI is under $100k (phasing out to $0 by $150k); unused losses carry forward. On sale, claimed depreciation is recaptured at up to 25%, and gains may owe capital-gains tax (a 1031 exchange can defer both). Figures are a year-1 estimate at your 24.0% rate — not tax advice; consult a CPA.
Schools (NCES district)
- District
- Monroe-Woodbury Central School District
- NCES district ID
- 3619650
- Math proficiency
- 50% ▼ -17.00%
- Reading proficiency
- 56% ▼ -1.00%
- Median HH income
- $104,681
- Composite
- 50.48/100
- National rank
- #1855
- State rank
- #250 of 590 in NY
Livability — Monroe
- Score
- 72/100
- State rank
- #351
- US rank
- #5919
Category grades
Schools grade is shown separately in the Schools card above.
Census & demographics
- County
- Orange County · 267,004 people
- City population
- 68,136
- Metro
- Poughkeepsie-Newburgh-Middletown, NY
- Population (ZIP)
- 68,136
- Household income
- $78,931
- Rent vs Own
- Severe rent burden
- 3149.0
Population outlook (Orange County) Hauer SSP2
- Today (2025)
- 379,830 people
- By 2030
- 378,955 · -0.2%
- By 2040
- 375,444 · -1.2%
- By 2050
- 369,311 · -2.8%
- By 2075
- 354,233 · -6.7%
- By 2100
- 318,150 · -16.2%
Race, ethnicity, and origin ACS 2023
- Neighborhood character
- Predominantly White (81%)
- Race & ethnicity
- White 81% Hispanic / Latino 12% Two or more races 6% Black 3% Asian 1%
- Hispanic origin (detail)
- Puerto Rican 5% Dominican 2%
- Common ancestry
- Romanian 3% Scandinavian 2% Italian 2%
- Foreign-born
- 11% · Canada, Dominican Republic
- Languages at home
- 33% English-only · German/W. Germanic 52% Spanish 9% Russian/Polish/Slavic 1%
Political lean MEDSL · Orange
- 2024 margin
- Lean R (+8.4) · D 45.8% · R 54.2%
- 2008→2024 swing
- -12.5pp toward R · 2008: 4.1pp · 2024: -8.4pp
- All cycles
- 2024: R+8.4 2020: R+0.2 2016: R+6.5 2012: D+5.2 2008: D+4.1
Not yet ingested
- Civics
- —
Market trends
- HPI YoY
- ▼ -309.81%
- Current HPI
- 314.2081
- Rent YoY
- ▲ 1.50%
- Metro
- Poughkeepsie-Newburgh-Middletown, NY
- State GDP YoY
- ▲ 2.60%
- F500 in state
- 92
Industry mix (Fortune 500 HQ in NY)
| Industry | F500 HQs | Revenue |
|---|---|---|
| Financial Services | 10 | $950B |
|
||
| Consumer Goods | 9 | $162B |
|
||
| Insurance | 4 | $225B |
|
||
| Telecommunications | 2 | $144B |
|
||
| Pharmaceuticals | 2 | $112B |
|
||
| Media / Entertainment | 2 | $69B |
|
||
Price history
+173.5% since first listed25 events — show timeline
- 2026-06-03 Relisted — OneKey® MLS as Distributed by MLS Grid
- 2026-04-26 Listed $599,000 OneKey® MLS as Distributed by MLS Grid
- 2026-04-23 Coming Soon $599,000 OneKey® MLS as Distributed by MLS Grid
- 2025-12-30 Relisted — OneKey® MLS as Distributed by MLS Grid
- 2025-12-30 Price Changed $599,000 OneKey® MLS as Distributed by MLS Grid
- 2025-12-20 Listing Removed — OneKey® MLS as Distributed by MLS Grid
- 2025-11-18 Price Changed $639,000 OneKey® MLS as Distributed by MLS Grid
- 2025-10-16 Listed $649,000 OneKey® MLS as Distributed by MLS Grid
- 2025-10-06 Coming Soon — OneKey® MLS as Distributed by MLS Grid
- 2025-09-01 Listing Removed — OneKey® MLS as Distributed by MLS Grid
- 2025-08-11 Price Changed $699,000 OneKey® MLS as Distributed by MLS Grid
- 2025-07-14 Listed $789,000 OneKey® MLS as Distributed by MLS Grid
- 2024-08-05 Sold (Public Records) $435,000 Public Records
- 2024-07-17 Sold (MLS) $435,000 OneKey® MLS as Distributed by MLS Grid
- 2024-06-05 Pending — OneKey® MLS as Distributed by MLS Grid
- 2024-05-03 Listed $449,999 OneKey® MLS as Distributed by MLS Grid
- 2024-04-29 Coming Soon $449,999 OneKey® MLS as Distributed by MLS Grid
- 2016-09-28 Sold (Public Records) $205,000 Public Records
- 2016-07-01 Price Changed $205,000 HGMLS
- 2016-07-01 Sold (MLS) $205,000 HGMLS
- 2016-06-30 Sold (MLS) $205,000 OneKey® MLS as Distributed by MLS Grid
- 2016-05-27 Contingent — HGMLS
- 2016-05-26 Price Changed $219,000 HGMLS
- 2016-04-16 Listed $219,000 HGMLS
- 2016-04-15 Listed $219,000 OneKey® MLS as Distributed by MLS Grid
Property tax history
+3.7%/yrLatest (2025): $10,529 · +2.9% YoY. Source: county tax records.
Cash-flow waterfall
monthlySold comps — $/sqft
last 12 mo · ≤1 miLoading sold comps…