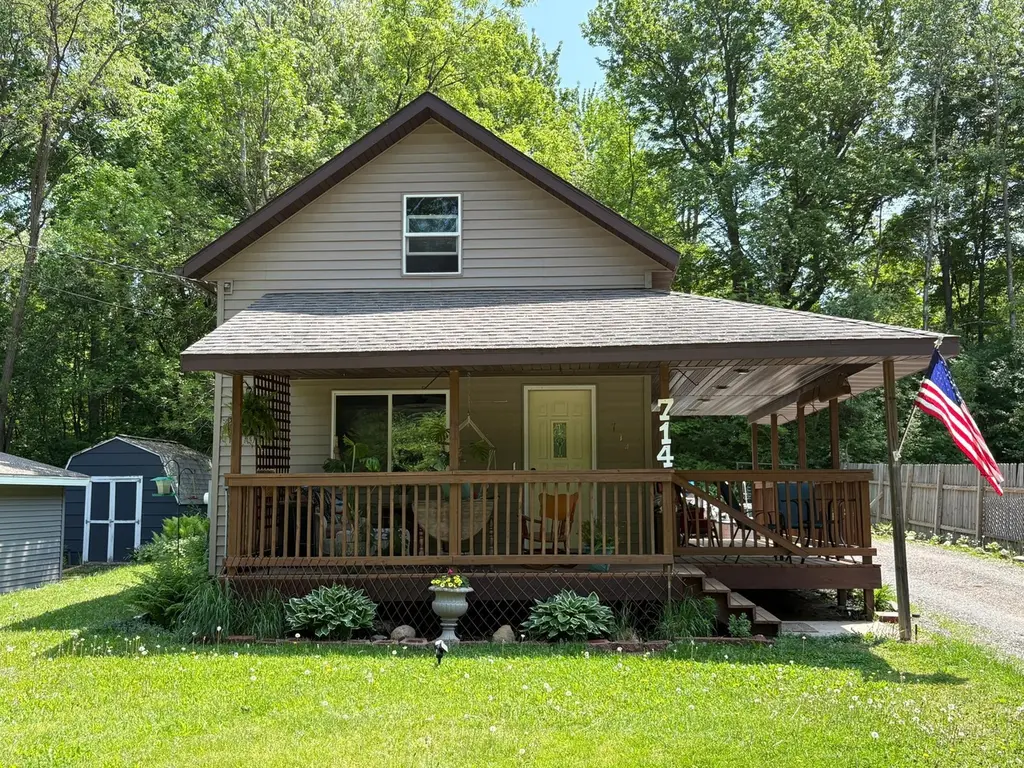
714 Wisconsin Ave · Amery, WI
Flood risk 9/10 · Severe
- FEMA flood zone
- X (unshaded)
- Chance of flooding over 30 yrs
- 0.99%
- Est. flood insurance / yr
- $473 – $860
Fire risk 1/10 · Minimal
- Est. fire insurance / yr
- $636 – $1,182
Heat risk 1/10 · Minimal
- Hot days now (above 97°F)
- 7 days/yr
- Hot days in 30 yrs
- 14 days/yr
Wind risk 1/10 · Minimal
- Chance of severe wind over 30 yrs
- —
Air-quality risk 2/10 · Minimal
- Unhealthy air days now
- 1 days/yr
- Unhealthy air days in 30 yrs
- 1 days/yr
Risk factors via First Street. Map © Google.
Why this score? — see what drove the C+ grade
The composite is a weighted blend of 9 inputs, each scored 0–100. Each bar is that input's sub-score; the figure is the points it added to the 100-point composite (weight × sub-score).
- Cash flow +26.5/30.0
- DSCR +9.1/10.0
- ARV discount +7.5/15.0
- 1% rule +7.0/10.0
- Livability +4.0/5.0
- Schools +3.7/10.0
- Rent growth +2.5/5.0
- Condition / age +2.5/5.0
- Appreciation +0.0/10.0
$150,000
🖨 Deal sheet (PDF) 📄 Offer letter ✓ Due diligence
Listing remarks MLS
Great starter or rental. Newer siding but interior needs some work.
Key facts
- 6,969 sq ft lot
- Built 1930
Property features AI
Exterior
- Parking: Gravel parking
- Utilities: City water connected; City sewer connected; Natural gas
- Home design: Residential property; Main level finished area about 600; Above-grade finished area about 1,100; Total building area about 1,500; Facing/entry information not provided
- Construction: Shallow foundation (block); Built features include one and one-half stories
- Exterior features: Vinyl exterior
Interior
- Kitchen: Kitchen approximately 17.5 x 11
- Bedrooms: 3 bedrooms (one on main level; two on upper level); Bedroom sizes approximately 13 x 12, 11 x 10, and 14 x 10.5
- Bathrooms: One three-quarter bathroom
- Heating & cooling: Forced air heating; No central air
- Interior features: Unfinished basement; Block foundation; One and one-half story
Neighborhood map
What this means for you Summary
Snapshot
- This is a 3-bed/1.0-bath other listed at $150k.
Deal economics
- At list price, monthly cash flow is $343 ($4k/yr) — positive.
- The deal already cash-flows at list — no discount required.
- Meets the 1% rule at list price ($2k rent vs $150k).
- Cap rate 9.5% vs local median 2.9% in Amery — top-decile yield for the area; either an underpriced asset or a hidden risk that comps aren't pricing in. Stress-test before assuming the spread holds.
Location & tenants
- Location reads 80/100 on livability (#66 in WI, #1,752 nationally) — a professional / high-income tenant draw. Strengths: crime A+, cost of living A+, housing A+; Watch: schools D+, commute F.
- Amery School District (rural): math 41% / reading 44% proficiency, ranked #126 of 342 in WI (top 37%) — families likely to look elsewhere, expect single-tenant / working-renter base with shorter leases.
- Market conditions: 58 active listings in the ZIP; 1 comparable units currently listed for rent nearby; 238 units permitted in Polk County in 2024 (0 in 5+ unit buildings).
Forward outlook
- Local home prices are declining (-3.0%/yr); year-one equity from $1k of loan paydown is wiped out by about $4k of value loss. Plan a longer hold.
- Polk County population projected at -24% by 2050 — secular population decline; favor cash flow + early exit over multi-decade hold.
Negotiation context
- Only 1 days on market — expect competitive offers; lowballing is unlikely to land.
- 3 sale attempts since 13y ago with the ask held roughly flat each time — persistent listings suggest the price (not the market) is what's stuck; bring a comps-based counter.
- Current owner paid $95k; list at $150k implies a 58% gain — meaningful room to come down on a strong offer.
Risks & watch-outs
- Watch-outs: flood insurance adds $56/mo; built in 1930 — expect roof / HVAC / electrical / plumbing capex.
- Climate carrying-cost: severe flood risk — expect insurance premiums to compound above CPI over the hold.
Questions for the listing agent
- Built in 1930 — when were the roof, HVAC, electrical panel, plumbing, and water heater last replaced?
- What's the actual annual flood-insurance premium (NFIP or private), and is the property in a SFHA with mandatory coverage?
- Is there a deadline driving the sale (1031 exchange, divorce, estate, relocation)? That informs how much negotiation room exists.
- Schools are D-rated, which usually means shorter tenancies and higher turnover. Who's the typical renter profile here, and what's been the actual vacancy rate?
- What's the average days-on-market for RENTAL listings here right now (not sales)? A rising rental-DOM trend means longer vacancies and softer asking-rent achievability than the comps imply.
- What's the recent tenant-quality profile in this submarket — average credit score on applications, eviction rate, late-payment / NSF rate, and stable-employment percentage? A property-management company in the area should have these aggregated.
- How much new for-sale + rental construction is in the pipeline within 1–3 miles? Heavy new supply typically softens prices + rents 12–24 months out; constrained supply supports both.
Investment metrics
- 1% rule
- 1.20% ✓
- Cap rate
- 9.48%
- Cash-on-cash
- 11.38%
- DSCR
- 1.51
- GRM
- 7.0
CMA / ARV
No comps found within radius.
Projected returns pro-forma
-3.0% appreciation · 3.0% rent growth · sell at horizon
- IRR
- -1.5%
- Equity multiple
- 0.94×
- Total profit
- $-2,421
- Equity at exit
- $22,365
- IRR
- 8.2%
- Equity multiple
- 1.62×
- Total profit
- $26,215
- Equity at exit
- $12,969
Cash invested: $42,000 (down + closing). Projections, not guarantees.
Landlord ↔ Tenant lean methodology
- Overall (STATE)
- 73 Landlord-Friendly
- State Wisconsin
- 73 Landlord-Friendly · R+2
- County
- — inherits STATE
- City
- — inherits STATE
ZIP-level market 54001
- Active inventory
- 58
- Price-to-rent
- 7.0×
Monthly cashflow live
- Estimated rent
- $1,795 medium interval (Pro) →
- Mortgage (P&I)
- −$787
- Tax from tax record
- −$171 /mo · $2,047/yr
- Insurance
- −$62
- Flood insurance flood zone
- −$56 /mo · $666/yr
- HOA
- −$0
- Vacancy / Maint / Mgmt
- −$377
- Net cashflow
- $343
Break-even live
Sensitivity live
| Price | -10% $428 | -5% $385 | +0% $343 | +5% $300 | +10% $258 |
|---|---|---|---|---|---|
| Rent | -10% $201 | -5% $272 | +0% $343 | +5% $414 | +10% $485 |
| Rate | -1.0pp $418 | -0.5pp $381 | base $343 | +0.5pp $304 | +1.0pp $264 |
UW: 25.0% down · 7.5% · 30yr · 1.5% tax · 5.0% vac · 8.0% maint · 8.0% mgmt
Financing live
Cash to close
- Down payment
- $37,500
- Closing costs
- $4,500
- Reserves months
- —
- Total cash needed
- —
Loan-product check · same deal, 3 products live
Conventional
25% down · 7.5% · 30yr
- Down + closing
- —
- Monthly P&I
- —
- Monthly cashflow
- —
- DSCR
- —
- Eligible?
- —
Personal DTI + credit; lowest rate.
DSCR
20% down · 8.5% · 30yr
- Down + closing
- —
- Monthly P&I
- —
- Monthly cashflow
- —
- DSCR
- —
- Eligible?
- —
No personal income docs; deal must DSCR.
Hard money
10% down · 12.0% · 12mo
- Down + closing
- —
- Monthly P&I
- —
- Monthly cashflow
- —
- DSCR
- —
- Eligible?
- —
Short-term bridge; refi at stabilization.
Rent comps 1 comps
| Address | Beds | Baths | Sqft | Rent | $/sqft | DOM | Units | Dist |
|---|---|---|---|---|---|---|---|---|
| 318 Keller Ave N Amery, WI | 3.0 | 1.0 | 1270 | $1,795 | $1.41 | 2d | 1 | 0.46mi |
Listing history 8 events
-
2026-05-28status Pending
-
2026-05-28status Pending
-
2026-05-28$150,000 Active
-
2026-05-28$150,000 Active
-
2021-04-09soldstatus $95,000
-
2013-04-24soldstatus $25,799 67-char remark
Show marketing remark (67 chars)
Great starter or rental. Newer siding but interior needs some work.
-
2013-03-23historical 67-char remark
Show marketing remark (67 chars)
Great starter or rental. Newer siding but interior needs some work.
-
2013-01-14$24,000 67-char remark
Show marketing remark (67 chars)
Great starter or rental. Newer siding but interior needs some work.
ⓘ Source: listings_history table (triggers on properties + properties_extension) + one-shot
backfill from property_details.listing_events for pre-trigger history.
Tax reassessment forecast WI · Partial reset (capped growth)
- Current annual tax
- $2,047 · $171/mo
- Projected year-2 tax
- $2,411 · $201/mo
- Expected delta
- +$364/yr (+$30/mo · 17.8%)
ⓘ Screening estimate from a state-policy table — verify with the county assessor before closing.
Climate risk First Street
- Flood 9/10 Extreme FEMA zone X (unshaded) · 99% chance over 30 yrs
- Wildfire 1/10 Low
- Heat 1/10 Low 7 d/yr ≥97°F today · 14 d/yr by 30 yrs out
- Wind 1/10 Low
- Air quality 2/10 Low 1 unhealthy d/yr today · 1 by 30 yrs out
Nearby sold comps map
Loading sold comps map…
Walkable amenities ~0.75 mi
Loading nearby amenities…
Taxation est. · year 1
- Rental income
- $21,540
- − Mortgage interest
- −$8,402
- − Property taxes
- −$2,047
- − Insurance
- −$1,416
- − Repairs & maintenance
- −$1,723
- − Management
- −$1,723
- − Depreciation
- −$4,364
- Taxable income
- $1,864
- Est. tax owed @ 24.0%
- −$447
- After-tax cash flow
- $3,667/yr
For passive investors: Depreciation is non-cash, so a rental often shows a tax loss while cash-flowing — sheltering income. Rental losses are passive: they offset passive income freely, and up to $25,000/yr can offset ordinary (W-2) income if you actively participate and your MAGI is under $100k (phasing out to $0 by $150k); unused losses carry forward. On sale, claimed depreciation is recaptured at up to 25%, and gains may owe capital-gains tax (a 1031 exchange can defer both). Figures are a year-1 estimate at your 24.0% rate — not tax advice; consult a CPA.
Schools (NCES district)
- District
- Amery School District
- NCES district ID
- 5500300
- Math proficiency
- 41% ▼ -12.00%
- Reading proficiency
- 44% ▼ -6.00%
- Median HH income
- $52,000
- Composite
- 36.75/100
- National rank
- #4584
- State rank
- #126 of 342 in WI
Livability — Amery
- Score
- 80/100
- State rank
- #66
- US rank
- #1752
Category grades
Schools grade is shown separately in the Schools card above.
Census & demographics
- Census place
- Amery, WI
- Population (ZIP)
- 7,947
Population outlook (Polk County) Hauer SSP2
- Today (2025)
- 41,581 people
- By 2030
- 40,019 · -3.8%
- By 2040
- 36,152 · -13.1%
- By 2050
- 31,823 · -23.5%
- By 2075
- 24,193 · -41.8%
- By 2100
- 18,586 · -55.3%
Race, ethnicity, and origin ACS 2023
- Neighborhood character
- Predominantly White (97%)
- Race & ethnicity
- White 97% Two or more races 2%
- Common ancestry
- Portuguese 16% Romanian 6% Scottish 4%
- Foreign-born
- 2% · Canada
Political lean MEDSL · Polk
- 2024 margin
- Solid R (+30.9) · D 33.9% · R 64.8% · Other 1.2%
- 2008→2024 swing
- -29.1pp toward R · 2008: -1.8pp · 2024: -30.9pp
- All cycles
- 2024: R+30.9 2020: R+27.5 2016: R+27.8 2012: R+9.0 2008: R+1.8
Not yet ingested
- Civics
- —
Market trends
- HPI YoY
- ▼ -144.50%
- Current HPI
- 233.4767
- Rent YoY
- —
- Metro
- —
- State GDP YoY
- ▲ 2.10%
- F500 in state
- 20
Industry mix (Fortune 500 HQ in WI)
| Industry | F500 HQs | Revenue |
|---|---|---|
| Industrial Machinery | 4 | $23B |
|
||
| Industrial Technology | 2 | $36B |
|
||
| Insurance | 1 | $36B |
|
||
| Professional Services | 1 | $19B |
|
||
| Utilities | 1 | $9B |
|
||
| Consumer Goods | 1 | $3B |
|
||
Price history
+525.0% since first listed8 events — show timeline
- 2026-05-28 Pending — WWRA
- 2026-05-28 Pending — NORTHSTARMLS as Distributed by MLS Grid
- 2026-05-28 Listed $150,000 NORTHSTARMLS as Distributed by MLS Grid
- 2026-05-28 Listed $150,000 WWRA
- 2021-04-09 Sold (Public Records) $95,000 Public Records
- 2013-04-24 Sold (MLS) $25,799 NORTHSTARMLS as Distributed by MLS Grid
- 2013-03-23 Listing Removed — NORTHSTARMLS as Distributed by MLS Grid
- 2013-01-14 Listed $24,000 NORTHSTARMLS as Distributed by MLS Grid
Property tax history
+8.9%/yrLatest (2025): $2,047 · +4.7% YoY. Source: county tax records.
Cash-flow waterfall
monthlySold comps — $/sqft
last 12 mo · ≤1 miLoading sold comps…