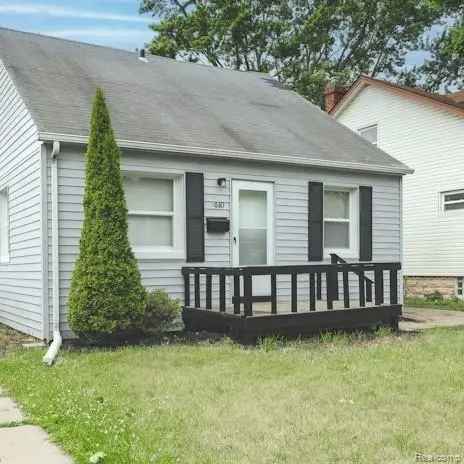
440 Jewell St · Ferndale, MI
Flood risk 1/10 · Minimal
- FEMA flood zone
- X (unshaded)
- Chance of flooding over 30 yrs
- 0.0%
- Est. flood insurance / yr
- $507 – $1,088
Fire risk 1/10 · Minimal
- Est. fire insurance / yr
- $784 – $1,456
Heat risk 3/10 · Minor
- Hot days now (above 97°F)
- 7 days/yr
- Hot days in 30 yrs
- 15 days/yr
Wind risk 2/10 · Minimal
- Chance of severe wind over 30 yrs
- —
Air-quality risk 3/10 · Minor
- Unhealthy air days now
- 3 days/yr
- Unhealthy air days in 30 yrs
- 5 days/yr
Risk factors via First Street. Map © Google.
Why this score? — see what drove the C grade
The composite is a weighted blend of 9 inputs, each scored 0–100. Each bar is that input's sub-score; the figure is the points it added to the 100-point composite (weight × sub-score).
- Cash flow +19.1/30.0
- ARV discount +15.0/15.0
- DSCR +6.0/10.0
- 1% rule +5.8/10.0
- Livability +4.5/5.0
- Rent growth +4.1/5.0
- Schools +2.5/10.0
- Condition / age +2.5/5.0
- Appreciation +0.0/10.0
$229,000
🖨 Deal sheet 📄 Offer letter ✓ Due diligence
Listing remarks MLS
Cute 4 bedroom 2 bath home located in Ferndale. Close to shopping and expressways. Ready for move in
Key facts
- 4,356 sq ft lot
- Garage
- Built 1948
Neighborhood map
What this means for you Summary
Snapshot
- This is a 7-bed/2.0-bath single-family listed at $229k.
Deal economics
- At list price, monthly cash flow is $245 ($3k/yr) — positive.
- The deal already cash-flows at list — no discount required.
- Meets the 1% rule at list price ($2k rent vs $229k).
- Recommended offer: $202k (12.0% below list) — sets the bar for market timing.
- Cap rate 7.6% vs local median 4.5% in Ferndale — top-decile yield for the area; either an underpriced asset or a hidden risk that comps aren't pricing in. Stress-test before assuming the spread holds.
Location & tenants
- Location reads 90/100 on livability (#8 in MI, #103 nationally) — a professional / high-income tenant draw. Strengths: amenities A+, commute A+, employment A+; Watch: schools D+.
- Ferndale Public Schools (suburban): math 18% / reading 39% proficiency, ranked #366 of 540 in MI (top 68%) — low school quality limits family demand, transient renter base, plan for 1-2y turnover.
- Market conditions: Rents rising fast (+6.2%/yr); 171 active listings in the ZIP; solid renter incomes; 2,614 units permitted in Oakland County in 2024 (721 in 5+ unit buildings).
- This rent runs 33% of the median local income ($90k/yr) — at the standard rent-burdened threshold; future hikes will face affordability resistance.
Forward outlook
- Local home prices are declining (-3.0%/yr); year-one equity from $2k of loan paydown is wiped out by about $7k of value loss. Plan a longer hold.
- Oakland County population projected at +10% by 2050 — modest demand growth; plan on rents tracking national, not racing it.
Negotiation context
- It's been on market 344 days — a 12% lower offer ($202k) is reasonable based on typical stale-listing flexibility.
- 8 sale attempts since 16y ago; this cycle's ask has dropped $90k (28%) from the opening price — seller is motivated, your offer sets the floor, not the list.
- Current owner paid $22k; list at $229k implies a 941% gain — meaningful room to come down on a strong offer.
Risks & watch-outs
- Watch-outs: built in 1948 — expect roof / HVAC / electrical / plumbing capex.
Questions for the listing agent
- It's been on market 344 days. Have you received any prior offers? Is the seller open to a 12% concession, seller financing, or rate buy-down credit?
- Built in 1948 — when were the roof, HVAC, electrical panel, plumbing, and water heater last replaced?
- Why hasn't it sold? Are there any deal-killer items the seller is aware of (foundation, flood, title, zoning, code violations)?
- Is there a deadline driving the sale (1031 exchange, divorce, estate, relocation)? That informs how much negotiation room exists.
- Schools are D-rated, which usually means shorter tenancies and higher turnover. Who's the typical renter profile here, and what's been the actual vacancy rate?
- What's the average days-on-market for RENTAL listings here right now (not sales)? A rising rental-DOM trend means longer vacancies and softer asking-rent achievability than the comps imply.
- What's the recent tenant-quality profile in this submarket — average credit score on applications, eviction rate, late-payment / NSF rate, and stable-employment percentage? A property-management company in the area should have these aggregated.
- How much new for-sale + rental construction is in the pipeline within 1–3 miles? Heavy new supply typically softens prices + rents 12–24 months out; constrained supply supports both.
Investment metrics
- 1% rule
- 1.08% ✓
- Cap rate
- 7.58%
- Cash-on-cash
- 4.59%
- DSCR
- 1.20
- GRM
- 7.7
CMA / ARV
- ARV (median comp)
- $285,007
- List price
- $229,000
- Delta
- -19.65%
- Verdict
- UNDERPRICED
- Comps
- 20 within 1.0 mi
Projected returns pro-forma
-3.0% appreciation · 6.24% rent growth · sell at horizon
- IRR
- -5.3%
- Equity multiple
- 0.80×
- Total profit
- $-13,064
- Equity at exit
- $34,145
- IRR
- 8.1%
- Equity multiple
- 1.71×
- Total profit
- $45,685
- Equity at exit
- $19,800
Cash invested: $64,120 (down + closing). Projections, not guarantees.
Landlord ↔ Tenant lean methodology
- Overall (STATE)
- 62 Landlord-Friendly
- State Michigan
- 62 Landlord-Friendly · EVEN
- County
- — inherits STATE
- City
- — inherits STATE
ZIP-level market 48220
- Rents YoY
- 6.2%
- Active inventory
- 171
- Price-to-rent
- 7.7×
Monthly cashflow live
- Estimated rent
- $2,472 medium interval (Pro) →
- Mortgage (P&I)
- −$1,201
- Tax from tax record
- −$412 /mo · $4,941/yr
- Insurance
- −$95
- HOA
- −$0
- Vacancy / Maint / Mgmt
- −$519
- Net cashflow
- $245
Break-even live
UW: 25.0% down · 7.5% · 30yr · 1.5% tax · 5.0% vac · 8.0% maint · 8.0% mgmt
Financing live
Cash to close
- Down payment
- $57,250
- Closing costs
- $6,870
- Reserves months
- —
- Total cash needed
- —
Loan-product check · same deal, 3 products live
Conventional
25% down · 7.5% · 30yr
- Down + closing
- —
- Monthly P&I
- —
- Monthly cashflow
- —
- DSCR
- —
- Eligible?
- —
Personal DTI + credit; lowest rate.
DSCR
20% down · 8.5% · 30yr
- Down + closing
- —
- Monthly P&I
- —
- Monthly cashflow
- —
- DSCR
- —
- Eligible?
- —
No personal income docs; deal must DSCR.
Hard money
10% down · 12.0% · 12mo
- Down + closing
- —
- Monthly P&I
- —
- Monthly cashflow
- —
- DSCR
- —
- Eligible?
- —
Short-term bridge; refi at stabilization.
Listing history 37 events
-
2026-06-04days on market $229,000 Active 344 DOM
-
2026-06-03days on market $229,000 Active 343 DOM
-
2026-06-02days on market $229,000 Active 342 DOM
-
2026-06-01days on market $229,000 Active 341 DOM
-
2026-05-31days on market $229,000 Active 340 DOM
-
2026-04-24price $229,000 100-char remark
Show marketing remark (100 chars)
Cute 4 bedroom 2 bath home located in Ferndale. Close to shopping and expressways. Ready for move in
-
2026-04-23price $229,000 100-char remark
Show marketing remark (100 chars)
Cute 4 bedroom 2 bath home located in Ferndale. Close to shopping and expressways. Ready for move in
-
2026-03-31price $234,000 100-char remark
Show marketing remark (100 chars)
Cute 4 bedroom 2 bath home located in Ferndale. Close to shopping and expressways. Ready for move in
-
2026-03-31price $234,000 100-char remark
Show marketing remark (100 chars)
Cute 4 bedroom 2 bath home located in Ferndale. Close to shopping and expressways. Ready for move in
-
2025-11-05price $239,900 100-char remark
Show marketing remark (100 chars)
Cute 4 bedroom 2 bath home located in Ferndale. Close to shopping and expressways. Ready for move in
-
2025-11-05price $239,900 100-char remark
Show marketing remark (100 chars)
Cute 4 bedroom 2 bath home located in Ferndale. Close to shopping and expressways. Ready for move in
-
2025-10-03price $249,900 100-char remark
Show marketing remark (100 chars)
Cute 4 bedroom 2 bath home located in Ferndale. Close to shopping and expressways. Ready for move in
-
2025-10-03price $249,900 100-char remark
Show marketing remark (100 chars)
Cute 4 bedroom 2 bath home located in Ferndale. Close to shopping and expressways. Ready for move in
-
2025-09-10price $259,900 100-char remark
Show marketing remark (100 chars)
Cute 4 bedroom 2 bath home located in Ferndale. Close to shopping and expressways. Ready for move in
-
2025-09-10price $259,900 100-char remark
Show marketing remark (100 chars)
Cute 4 bedroom 2 bath home located in Ferndale. Close to shopping and expressways. Ready for move in
-
2025-08-28price $269,900 100-char remark
Show marketing remark (100 chars)
Cute 4 bedroom 2 bath home located in Ferndale. Close to shopping and expressways. Ready for move in
-
2025-08-28price $269,900 100-char remark
Show marketing remark (100 chars)
Cute 4 bedroom 2 bath home located in Ferndale. Close to shopping and expressways. Ready for move in
-
2025-07-16price $279,000 100-char remark
Show marketing remark (100 chars)
Cute 4 bedroom 2 bath home located in Ferndale. Close to shopping and expressways. Ready for move in
-
2025-07-16price $279,000 100-char remark
Show marketing remark (100 chars)
Cute 4 bedroom 2 bath home located in Ferndale. Close to shopping and expressways. Ready for move in
-
2025-07-02price $299,900 100-char remark
Show marketing remark (100 chars)
Cute 4 bedroom 2 bath home located in Ferndale. Close to shopping and expressways. Ready for move in
-
2025-07-02price $299,900 100-char remark
Show marketing remark (100 chars)
Cute 4 bedroom 2 bath home located in Ferndale. Close to shopping and expressways. Ready for move in
-
2025-06-25$319,000 Active 100-char remark
Show marketing remark (100 chars)
Cute 4 bedroom 2 bath home located in Ferndale. Close to shopping and expressways. Ready for move in
-
2025-06-25$319,000 Active 100-char remark
Show marketing remark (100 chars)
Cute 4 bedroom 2 bath home located in Ferndale. Close to shopping and expressways. Ready for move in
-
2011-04-18soldstatus $22,000
-
2011-04-18soldstatus $22,000
-
2011-03-15historical
-
2011-01-26$27,800
-
2011-01-26$27,800
-
2011-01-06historical
-
2011-01-06historical
-
2010-11-16$39,999
-
2010-11-16$39,999
-
2010-11-16historical
-
2010-07-20$44,999
-
2010-07-20historical
-
2010-04-25$54,000
-
1983-11-01soldstatus $20,500
ⓘ Source: listings_history table (triggers on properties + properties_extension) + one-shot
backfill from property_details.listing_events for pre-trigger history.
Tax reassessment forecast MI · Partial reset (capped growth)
- Current annual tax
- $4,941 · $412/mo
- Projected year-2 tax
- $4,941 · $412/mo
- Expected delta
- $0/yr ($0/mo · 0.0%)
ⓘ Screening estimate from a state-policy table — verify with the county assessor before closing.
Climate risk First Street
- Flood 1/10 Low FEMA zone X (unshaded) · 0% chance over 30 yrs
- Wildfire 1/10 Low
- Heat 3/10 Moderate 7 d/yr ≥97°F today · 15 d/yr by 30 yrs out
- Wind 2/10 Low
- Air quality 3/10 Moderate 3 unhealthy d/yr today · 5 by 30 yrs out
Nearby sold comps map
Loading sold comps map…
Walkable amenities ~0.75 mi
Loading nearby amenities…
Taxation est. · year 1
- Rental income
- $29,668
- − Mortgage interest
- −$12,828
- − Property taxes
- −$4,941
- − Insurance
- −$1,145
- − Repairs & maintenance
- −$2,373
- − Management
- −$2,373
- − Depreciation
- −$6,662
- Taxable loss
- −$654
- Est. tax savings @ 24.0%
- +$157
- After-tax cash flow
- $3,098/yr
For passive investors: Depreciation is non-cash, so a rental often shows a tax loss while cash-flowing — sheltering income. Rental losses are passive: they offset passive income freely, and up to $25,000/yr can offset ordinary (W-2) income if you actively participate and your MAGI is under $100k (phasing out to $0 by $150k); unused losses carry forward. On sale, claimed depreciation is recaptured at up to 25%, and gains may owe capital-gains tax (a 1031 exchange can defer both). Figures are a year-1 estimate at your 24.0% rate — not tax advice; consult a CPA.
Schools (NCES district)
- District
- Ferndale Public Schools
- NCES district ID
- 2614280
- Math proficiency
- 18% ▼ -3.00%
- Reading proficiency
- 39% ▲ 5.00%
- Median HH income
- $56,069
- Composite
- 25.46/100
- National rank
- #7449
- State rank
- #366 of 540 in MI
Livability — Ferndale
- Score
- 90/100
- State rank
- #8
- US rank
- #103
Category grades
Schools grade is shown separately in the Schools card above.
Census & demographics
- Census place
- Ferndale, MI
- County
- Oakland County · 1,009,092 people
- City population
- 21,527
- Metro
- Detroit-Warren-Dearborn, MI
- Population (ZIP)
- 21,527
- Household income
- $89,881
- Rent vs Own
- Severe rent burden
- 670.0
Population outlook (Oakland County) Hauer SSP2
- Today (2025)
- 1,335,747 people
- By 2030
- 1,375,100 · +2.9%
- By 2040
- 1,435,385 · +7.5%
- By 2050
- 1,469,250 · +10.0%
- By 2075
- 1,531,946 · +14.7%
- By 2100
- 1,450,485 · +8.6%
Race, ethnicity, and origin ACS 2023
- Neighborhood character
- Predominantly White (72%)
- Race & ethnicity
- White 72% Black 15% Two or more races 6% Hispanic / Latino 5% Asian 3%
- Common ancestry
- Romanian 11% Lithuanian 6% Slovak 3%
- Foreign-born
- 4% · Canada, South Korea
- Languages at home
- 95% English-only · Spanish 2% Other Indo-European 1% German/W. Germanic 1%
Political lean MEDSL · Oakland
- 2024 margin
- D (+10.6) · D 54.4% · R 43.8% · Other 1.9%
- 2008→2024 swing
- -3.9pp toward R · 2008: 14.5pp · 2024: 10.6pp
- All cycles
- 2024: D+10.6 2020: D+14.1 2016: D+8.1 2012: D+8.1 2008: D+14.5
Not yet ingested
- Civics
- —
Market trends
- HPI YoY
- ▼ -394.92%
- Current HPI
- 273.0986
- Rent YoY
- ▲ 6.24%
- Metro
- Detroit-Warren-Dearborn, MI
- State GDP YoY
- ▲ 1.37%
- F500 in state
- 28
Industry mix (Fortune 500 HQ in MI)
| Industry | F500 HQs | Revenue |
|---|---|---|
| Automotive Parts | 3 | $48B |
|
||
| Automotive | 2 | $372B |
|
||
| Chemicals | 1 | $45B |
|
||
| Automotive Retail | 1 | $29B |
|
||
| Healthcare / Medical Devices | 1 | $23B |
|
||
| Automotive Technology | 1 | $20B |
|
||
Price history
+1017.1% since first listed32 events — show timeline
- 2026-04-24 Price Changed $229,000 MiRealSource-MiMLS
- 2026-04-23 Price Changed $229,000 REALCOMP
- 2026-03-31 Price Changed $234,000 MiRealSource-MiMLS
- 2026-03-31 Price Changed $234,000 REALCOMP
- 2025-11-05 Price Changed $239,900 MiRealSource-MiMLS
- 2025-11-05 Price Changed $239,900 REALCOMP
- 2025-10-03 Price Changed $249,900 MiRealSource-MiMLS
- 2025-10-03 Price Changed $249,900 REALCOMP
- 2025-09-10 Price Changed $259,900 MiRealSource-MiMLS
- 2025-09-10 Price Changed $259,900 REALCOMP
- 2025-08-28 Price Changed $269,900 MiRealSource-MiMLS
- 2025-08-28 Price Changed $269,900 REALCOMP
- 2025-07-16 Price Changed $279,000 MiRealSource-MiMLS
- 2025-07-16 Price Changed $279,000 REALCOMP
- 2025-07-02 Price Changed $299,900 MiRealSource-MiMLS
- 2025-07-02 Price Changed $299,900 REALCOMP
- 2025-06-25 Listed $319,000 REALCOMP
- 2025-06-25 Listed $319,000 MiRealSource-MiMLS
- 2011-04-18 Sold (MLS) $22,000 REALCOMP
- 2011-04-18 Sold (MLS) $22,000 MiRealSource-MiMLS
- 2011-03-15 Listing Removed — MiRealSource-MiMLS
- 2011-01-26 Listed $27,800 REALCOMP
- 2011-01-26 Listed $27,800 MiRealSource-MiMLS
- 2011-01-06 Listing Removed — REALCOMP
- 2011-01-06 Listing Removed — MiRealSource-MiMLS
- 2010-11-16 Listing Removed — REALCOMP
- 2010-11-16 Listed $39,999 REALCOMP
- 2010-11-16 Listed $39,999 MiRealSource-MiMLS
- 2010-07-20 Listing Removed — REALCOMP
- 2010-07-20 Listed $44,999 REALCOMP
- 2010-04-25 Listed $54,000 REALCOMP
- 1983-11-01 Sold (Public Records) $20,500 Public Records
Property tax history
+1.5%/yrLatest (2025): $4,941 · -0.8% YoY. Source: county tax records.
Cash-flow waterfall
monthlySold comps — $/sqft
last 12 mo · ≤1 miLoading sold comps…