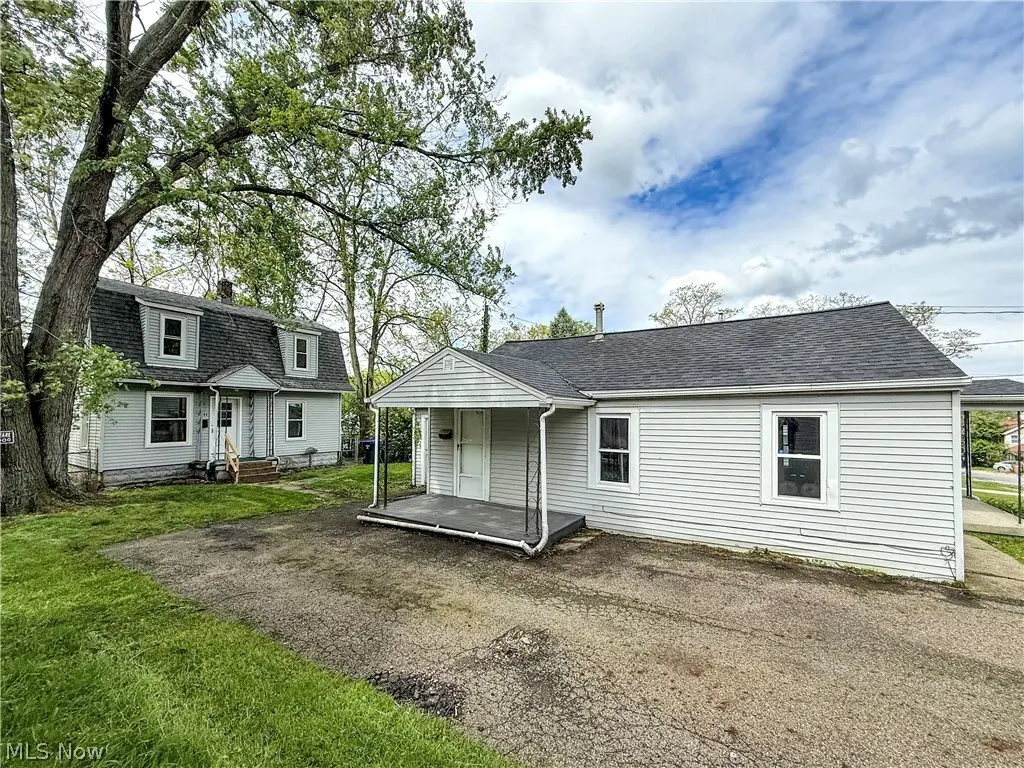
242 Orchard Ave · Cuyahoga Falls, OH
Flood risk 1/10 · Minimal
- FEMA flood zone
- X (unshaded)
- Chance of flooding over 30 yrs
- 0.0%
- Est. flood insurance / yr
- $473 – $860
Fire risk 1/10 · Minimal
- Est. fire insurance / yr
- $713 – $1,323
Heat risk 3/10 · Minor
- Hot days now (above 97°F)
- 7 days/yr
- Hot days in 30 yrs
- 17 days/yr
Wind risk 1/10 · Minimal
- Chance of severe wind over 30 yrs
- —
Air-quality risk 3/10 · Minor
- Unhealthy air days now
- 2 days/yr
- Unhealthy air days in 30 yrs
- 4 days/yr
Risk factors via First Street. Map © Google.
Why this score? — see what drove the F grade
The composite is a weighted blend of 9 inputs, each scored 0–100. Each bar is that input's sub-score; the figure is the points it added to the 100-point composite (weight × sub-score).
- Cash flow +5.4/30.0
- Schools +4.5/10.0
- Rent growth +4.2/5.0
- Livability +4.2/5.0
- Condition / age +2.5/5.0
- 1% rule +0.9/10.0
- DSCR +0.0/10.0
- ARV discount +0.0/15.0
- Appreciation +0.0/10.0
$269,900
🖨 Deal sheet 📄 Offer letter ✓ Due diligence
Listing remarks MLS
Great investment in Cuyahoga Falls. 2 houses on one parcel located in Cuyahoga Falls. The front property is a 2 bedroom, 1 bath slab home, with a new roof. The back property is a 3 bedroom, 1 bath home with a full basement. Each building has their separate utilities. The properties need some TLC, but a fantastic opportuity to had sweat equity and earn cash flow. The property is being sold as is.
Key facts
- New appliance suites
- Completely remodeled
- Soft-close cabinetry
Tags
Property features AI
Exterior
- Parking: Asphalt off-street parking
- Utilities: Public water; Public sewer
- Home design: 2-story home
- Construction: Vinyl siding; Asphalt/fiberglass roof
- Exterior features: Updated/remodeled condition
Interior
- Bedrooms: Total rooms: 12
- Bathrooms: 2 full bathrooms
- Heating & cooling: Forced air heating
- Interior features: Unfinished basement
- Laundry & utility: In-unit laundry
Neighborhood map
What this means for you Summary
Snapshot
- This is a 3-bed/1.0-bath single-family listed at $270k.
Deal economics
- At list price, monthly cash flow is $-592 ($-7k/yr) — negative.
- To cash-flow at today's rent, offer at most $165k (38.8% below list).
- To meet the 1% rule (rent ≥ 1% of price), the offer needs to be $159k (41.2% below list).
- Recommended offer: $159k (41.2% below list) — sets the bar for 1% rule.
- Cap rate 3.7% vs local median 4.6% in Cuyahoga Falls — below-typical yield; the buyer is paying a premium for something (appreciation thesis, condition, location) that the cap rate doesn't capture.
Location & tenants
- Location reads 83/100 on livability (#60 in OH, #870 nationally) — a professional / high-income tenant draw. Strengths: cost of living A+, housing A+, health & safety A+; Watch: commute F.
- Cuyahoga Falls City (suburban): math 47% / reading 58% proficiency, ranked #408 of 656 in OH (top 62%) — acceptable for families but not a draw, mixed tenant base, ~2y average lease.
- Market conditions: Rents rising fast (+7.0%/yr); 90 active listings in the ZIP; 20 comparable units currently listed for rent nearby; rentals at typical pace (median 22d on market — plan ~3-4 weeks tenant-placement turnaround); 1,114 units permitted in Summit County in 2024 (397 in 5+ unit buildings).
- This rent runs 30% of the median local income ($63k/yr) — at the standard rent-burdened threshold; future hikes will face affordability resistance.
Forward outlook
- Local home prices are declining (-3.0%/yr); year-one equity from $2k of loan paydown is wiped out by about $8k of value loss. Plan a longer hold.
- Summit County population projected to shrink 6% by 2050 — rents likely to lag national; underwrite the cash flow, not the appreciation.
Negotiation context
- It's been on market 23 days — a 2% lower offer ($266k) is reasonable based on typical stale-listing flexibility.
- 4 sale attempts with the ask held roughly flat each time — persistent listings suggest the price (not the market) is what's stuck; bring a comps-based counter.
- Current owner paid $148k; list at $270k implies a 82% gain — meaningful room to come down on a strong offer.
Risks & watch-outs
- Watch-outs: built in 1918 — expect roof / HVAC / electrical / plumbing capex.
Questions for the listing agent
- What do current leases actually rent for vs. the listed asking? Can we see a recent rent roll and the last 12 months of T-12 income?
- Built in 1918 — when were the roof, HVAC, electrical panel, plumbing, and water heater last replaced?
- Is there a deadline driving the sale (1031 exchange, divorce, estate, relocation)? That informs how much negotiation room exists.
- Schools are A-rated — typically a magnet for longer-tenancy family renters. What's the average tenant stay here, and is there a school-zone premium baked into asking?
- The area grade is low — what's the realistic commute time and amenity access for the typical tenant pool here? Any planned neighborhood developments (good or bad) we should know about?
- What's the average days-on-market for RENTAL listings here right now (not sales)? A rising rental-DOM trend means longer vacancies and softer asking-rent achievability than the comps imply.
- What's the recent tenant-quality profile in this submarket — average credit score on applications, eviction rate, late-payment / NSF rate, and stable-employment percentage? A property-management company in the area should have these aggregated.
- How much new for-sale + rental construction is in the pipeline within 1–3 miles? Heavy new supply typically softens prices + rents 12–24 months out; constrained supply supports both.
Investment metrics
- 1% rule
- 0.59% ✗
- Cap rate
- 3.66%
- Cash-on-cash
- -9.40%
- DSCR
- 0.58
- GRM
- 14.2
CMA / ARV
- ARV (on-the-fly)
- $218,400
- Comps found
- 12
Show comp detail 12 sales within ~0.75 mi
| Address | Dist | Beds/Ba | Sqft | Sold | Price | $/sf | Match |
|---|---|---|---|---|---|---|---|
| 619 Tallmadge Rd | 0.50mi | 3/1.0 | 1,284 (+3%) | 4mo | $224,900 | $175 | 68 |
| 120 Grant Ave | 0.29mi | 3/1.0 | 1,125 (-10%) | 6mo | $165,000 | $147 | 65 |
| 416 Prospect Ave | 0.43mi | 3/2.0 | 1,320 (+6%) | 3mo | $205,000 | $155 | 64 |
| 1616 Union St | 0.22mi | 2/1.0 (-1) | 1,100 (-12%) | 2mo | $160,000 | $145 | 64 |
| 300 May Ave | 0.39mi | 3/1.0 | 1,144 (-8%) | 6mo | $200,000 | $175 | 63 |
| 714 Grant Ave | 0.55mi | 3/1.0 | 1,144 (-8%) | 2mo | $190,000 | $166 | 59 |
| 923 Elizabeth Ct | 0.68mi | 2/2.0 (-1) | 1,265 (+1%) | 0mo | $259,900 | $205 | 57 |
| 800 Viewpoint Ave | 0.56mi | 2/1.0 (-1) | 1,182 (-5%) | 5mo | $175,000 | $148 | 56 |
| 1944 High St | 0.61mi | 3/1.5 | 1,130 (-10%) | 6mo | $200,000 | $177 | 48 |
| 1918 Tudor St | 0.59mi | 3/1.5 | 1,120 (-10%) | 7mo | $181,000 | $162 | 48 |
| 1757 Windsor St | 0.75mi | 4/1.5 (+1) | 1,120 (-10%) | 2mo | $230,000 | $205 | 40 |
| 1840 6th St | 0.68mi | 2/1.0 (-1) | 1,080 (-14%) | 3mo | $193,000 | $179 | 38 |
Match score weights: distance 35% · size 25% · config 20% · recency 20%. Top-matched comps best support the ARV.
Projected returns pro-forma
-3.0% appreciation · 6.95% rent growth · sell at horizon
- IRR
- -28.9%
- Equity multiple
- 0.01×
- Total profit
- $-74,880
- Equity at exit
- $40,243
- IRR
- -17.7%
- Equity multiple
- -0.12×
- Total profit
- $-84,515
- Equity at exit
- $23,336
Cash invested: $75,572 (down + closing). Projections, not guarantees.
Landlord ↔ Tenant lean methodology
- Overall (STATE)
- 73 Landlord-Friendly
- State Ohio
- 73 Landlord-Friendly · R+6
- County
- — inherits STATE
- City
- — inherits STATE
ZIP-level market 44221
- Rents YoY
- 7.0%
- Active inventory
- 90
- Price-to-rent
- 14.2×
Monthly cashflow live
- Estimated rent
- $1,588 high interval (Pro) →
- Mortgage (P&I)
- −$1,415
- Tax from tax record
- −$319 /mo · $3,823/yr
- Insurance
- −$112
- HOA
- −$0
- Vacancy / Maint / Mgmt
- −$333
- Net cashflow
- $-592
Break-even live
UW: 25.0% down · 7.5% · 30yr · 1.5% tax · 5.0% vac · 8.0% maint · 8.0% mgmt
Financing live
Cash to close
- Down payment
- $67,475
- Closing costs
- $8,097
- Reserves months
- —
- Total cash needed
- —
Loan-product check · same deal, 3 products live
Conventional
25% down · 7.5% · 30yr
- Down + closing
- —
- Monthly P&I
- —
- Monthly cashflow
- —
- DSCR
- —
- Eligible?
- —
Personal DTI + credit; lowest rate.
DSCR
20% down · 8.5% · 30yr
- Down + closing
- —
- Monthly P&I
- —
- Monthly cashflow
- —
- DSCR
- —
- Eligible?
- —
No personal income docs; deal must DSCR.
Hard money
10% down · 12.0% · 12mo
- Down + closing
- —
- Monthly P&I
- —
- Monthly cashflow
- —
- DSCR
- —
- Eligible?
- —
Short-term bridge; refi at stabilization.
Rent comps 20 comps
| Address | Beds | Baths | Sqft | Rent | $/sqft | DOM | Units | Dist |
|---|---|---|---|---|---|---|---|---|
| 467 Lynn Dr Cuyahoga Falls, OH | 3.0 | 1.0 | 1414 | $1,600 | $1.13 | 14d | 1 | 0.15mi |
| 1928 3rd St Unit 4 Cuyahoga Falls, OH | 2.0 | 1.0 | 1150 | $1,300 | $1.13 | 44d | 1 | 0.62mi |
| 1382 9th St Cuyahoga Falls, OH | 2.0 | 1.0 | 862 | $1,050 | $1.22 | 44d | 1 | 0.66mi |
| 1823 7th St Cuyahoga Falls, OH | 3.0 | 1.5 | 1248 | $2,850 | $2.28 | 44d | 1 | 0.68mi |
| 1015 Howe Ave Cuyahoga Falls, OH | 2.0 | 1.0 | 768 | $1,100 | $1.43 | 21d | 1 | 0.73mi |
| 1015 Howe Ave Apt 7 Cuyahoga Falls, OH | 2.0 | 1.0 | 768 | $1,200 | $1.56 | 21d | 1 | 0.73mi |
| 1015 Howe Ave Apt 7 Cuyahoga Falls, OH | 2.0 | 1.0 | 768 | $1,100 | $1.43 | 14d | 1 | 0.73mi |
| 1791 Windsor St Cuyahoga Falls, OH | 3.0 | 1.0 | 1120 | $1,929 | $1.72 | 14d | 1 | 0.75mi |
| 1975 Tudor St Cuyahoga Falls, OH | 3.0 | 1.0 | 1120 | $1,475 | $1.32 | 44d | 1 | 0.78mi |
| 1522 Campbell St Unit 2 Cuyahoga Falls, OH | 2.0 | 1.0 | 900 | $1,300 | $1.44 | 21d | 1 | 0.79mi |
| 1276 Bailey Rd Cuyahoga Falls, OH | 3.0 | 2.0 | 1188 | $1,800 | $1.52 | 44d | 1 | 0.88mi |
| 1059 Jean Ave Akron, OH | 3.0 | 1.0 | 1012 | $1,300 | $1.28 | 44d | 1 | 0.89mi |
| 2220 High St Cuyahoga Falls, OH | 1.0–2.0 | 1.0–2.0 | 870 | $1,215 | $1.40 | 14d | 1 | 0.98mi |
| 513 Center Ave Cuyahoga Falls, OH | 2.0 | 1.0 | 587 | $964 | $1.64 | 23d | 2 | 1.01mi |
| 1832 15th St Cuyahoga Falls, OH | 3.0 | 1.0 | 1000 | $1,495 | $1.50 | 23d | 1 | 1.12mi |
| 1305 Buckingham Gate Blvd Cuyahoga Falls, OH | 1.0–2.0 | 1.0–2.0 | 894 | $1,650 | $1.84 | 14d | 1 | 1.17mi |
| 1088 Lexington Ave Akron, OH | 3.0 | 1.0 | 1008 | $1,600 | $1.59 | 14d | 1 | 1.18mi |
| 1180 Murray Ave Akron, OH | 3.0 | 2.0 | 1340 | $1,175 | $0.88 | 21d | 1 | 1.18mi |
| 539 E Cuyahoga Falls Ave Unit 1 Akron, OH | 2.0 | 1.0 | 1000 | $895 | $0.90 | 23d | 1 | 1.20mi |
| 1207 Hunters Lake Dr W Cuyahoga Falls, OH | 1.0–2.0 | 1.0–2.0 | 864 | $1,472 | $1.70 | 14d | 19 | 1.38mi |
Listing history 21 events
-
2026-06-10days on market $269,900 Active 23 DOM
-
2026-06-09days on market $269,900 Active 22 DOM
-
2026-06-08days on market $269,900 Active 21 DOM
-
2026-06-07days on market $269,900 Active 20 DOM
-
2026-06-05days on market $269,900 Active 17 DOM
-
2026-06-03days on market $269,900 Active 16 DOM
-
2026-06-02days on market $269,900 Active 15 DOM
-
2026-06-01days on market $269,900 Active 14 DOM
-
2026-05-31days on market $269,900 Active 13 DOM
-
2026-05-31days on market $269,900 Active 12 DOM
-
2026-05-15$269,900 Active
-
2026-05-11status Active
-
2026-05-11historical
-
2026-04-01historical Contingent
-
2026-03-17price $269,900
-
2026-02-23$279,900 Active
-
2025-12-01soldstatus $148,000
-
2025-11-26soldstatus $148,000 Closed 398-char remark
Show marketing remark (398 chars)
Great investment in Cuyahoga Falls. 2 houses on one parcel located in Cuyahoga Falls. The front property is a 2 bedroom, 1 bath slab home, with a new roof. The back property is a 3 bedroom, 1 bath home with a full basement. Each building has their separate utilities. The properties need some TLC, but a fantastic opportuity to had sweat equity and earn cash flow. The property is being sold as is.
-
2025-11-13status Pending 398-char remark
Show marketing remark (398 chars)
Great investment in Cuyahoga Falls. 2 houses on one parcel located in Cuyahoga Falls. The front property is a 2 bedroom, 1 bath slab home, with a new roof. The back property is a 3 bedroom, 1 bath home with a full basement. Each building has their separate utilities. The properties need some TLC, but a fantastic opportuity to had sweat equity and earn cash flow. The property is being sold as is.
-
2025-11-11$150,000 Active 398-char remark
Show marketing remark (398 chars)
Great investment in Cuyahoga Falls. 2 houses on one parcel located in Cuyahoga Falls. The front property is a 2 bedroom, 1 bath slab home, with a new roof. The back property is a 3 bedroom, 1 bath home with a full basement. Each building has their separate utilities. The properties need some TLC, but a fantastic opportuity to had sweat equity and earn cash flow. The property is being sold as is.
-
2025-07-25soldstatus $90,000
ⓘ Source: listings_history table (triggers on properties + properties_extension) + one-shot
backfill from property_details.listing_events for pre-trigger history.
Tax reassessment forecast OH · Partial reset (capped growth)
- Current annual tax
- $3,823 · $319/mo
- Projected year-2 tax
- $4,017 · $335/mo
- Expected delta
- +$194/yr (+$16/mo · 5.1%)
ⓘ Screening estimate from a state-policy table — verify with the county assessor before closing.
Climate risk First Street
- Flood 1/10 Low FEMA zone X (unshaded) · 0% chance over 30 yrs
- Wildfire 1/10 Low
- Heat 3/10 Moderate 7 d/yr ≥97°F today · 17 d/yr by 30 yrs out
- Wind 1/10 Low
- Air quality 3/10 Moderate 2 unhealthy d/yr today · 4 by 30 yrs out
Nearby sold comps map
Loading sold comps map…
Walkable amenities ~0.75 mi
Loading nearby amenities…
Taxation est. · year 1
- Rental income
- $19,052
- − Mortgage interest
- −$15,119
- − Property taxes
- −$3,823
- − Insurance
- −$1,350
- − Repairs & maintenance
- −$1,524
- − Management
- −$1,524
- − Depreciation
- −$7,852
- Taxable loss
- −$12,139
- Est. tax savings @ 24.0%
- +$2,913
- After-tax cash flow
- $-4,193/yr
For passive investors: Depreciation is non-cash, so a rental often shows a tax loss while cash-flowing — sheltering income. Rental losses are passive: they offset passive income freely, and up to $25,000/yr can offset ordinary (W-2) income if you actively participate and your MAGI is under $100k (phasing out to $0 by $150k); unused losses carry forward. On sale, claimed depreciation is recaptured at up to 25%, and gains may owe capital-gains tax (a 1031 exchange can defer both). Figures are a year-1 estimate at your 24.0% rate — not tax advice; consult a CPA.
Schools (NCES district)
- District
- Cuyahoga Falls City
- NCES district ID
- 3904383
- Math proficiency
- 47% ▼ -18.00%
- Reading proficiency
- 58% ▼ -7.00%
- Median HH income
- $49,587
- Composite
- 44.78/100
- National rank
- #2746
- State rank
- #408 of 656 in OH
Livability — Cuyahoga Falls
- Score
- 83/100
- State rank
- #60
- US rank
- #870
Category grades
Schools grade is shown separately in the Schools card above.
Census & demographics
- Census place
- Cuyahoga Falls, OH
- County
- Summit County · 440,783 people
- City population
- 47,005
- Metro
- Akron, OH
- Population (ZIP)
- 28,546
- Household income
- $63,342
- Rent vs Own
- Severe rent burden
- 1080.0
Population outlook (Summit County) Hauer SSP2
- Today (2025)
- 546,583 people
- By 2030
- 544,028 · -0.5%
- By 2040
- 531,363 · -2.8%
- By 2050
- 514,923 · -5.8%
- By 2075
- 481,765 · -11.9%
- By 2100
- 432,265 · -20.9%
Race, ethnicity, and origin ACS 2023
- Neighborhood character
- Predominantly White (81%)
- Race & ethnicity
- White 81% Asian 7% Black 5% Two or more races 5% Hispanic / Latino 2%
- Common ancestry
- Romanian 4% Lithuanian 2% Scotch-Irish 2%
- Foreign-born
- 7% · India, China, Canada
- Languages at home
- 90% English-only · Other Indo-European 6% Other Asian/Pacific 1% German/W. Germanic 1%
Political lean MEDSL · Summit
- 2024 margin
- Lean D (+7.0) · D 53.0% · R 46.0%
- 2008→2024 swing
- -9.6pp toward R · 2008: 16.6pp · 2024: 7.0pp
- All cycles
- 2024: D+7.0 2020: D+9.6 2016: D+8.2 2012: D+14.8 2008: D+16.6
Not yet ingested
- Civics
- —
Market trends
- HPI YoY
- ▼ -222.74%
- Current HPI
- 213.5428
- Rent YoY
- ▲ 6.95%
- Metro
- Akron, OH
- State GDP YoY
- ▲ 1.98%
- F500 in state
- 48
Industry mix (Fortune 500 HQ in OH)
| Industry | F500 HQs | Revenue |
|---|---|---|
| Insurance | 3 | $145B |
|
||
| Industrial Machinery | 3 | $49B |
|
||
| Financial Services | 3 | $24B |
|
||
| Consumer Goods | 2 | $93B |
|
||
| Aerospace / Defense | 2 | $47B |
|
||
| Utilities | 2 | $33B |
|
||
Price history
+199.9% since first listed11 events — show timeline
- 2026-05-15 Listed $269,900 MLSNOW
- 2026-05-11 Relisted — MLSNOW
- 2026-05-11 Listing Removed — MLSNOW
- 2026-04-01 Contingent — MLSNOW
- 2026-03-17 Price Changed $269,900 MLSNOW
- 2026-02-23 Listed $279,900 MLSNOW
- 2025-12-01 Sold (Public Records) $148,000 Public Records
- 2025-11-26 Sold (MLS) $148,000 MLSNOW
- 2025-11-13 Pending — MLSNOW
- 2025-11-11 Listed $150,000 MLSNOW
- 2025-07-25 Sold (Public Records) $90,000 Public Records
Property tax history
+3.8%/yrLatest (2025): $3,823 · -1.8% YoY. Source: county tax records.
Cash-flow waterfall
monthlySold comps — $/sqft
last 12 mo · ≤1 miLoading sold comps…