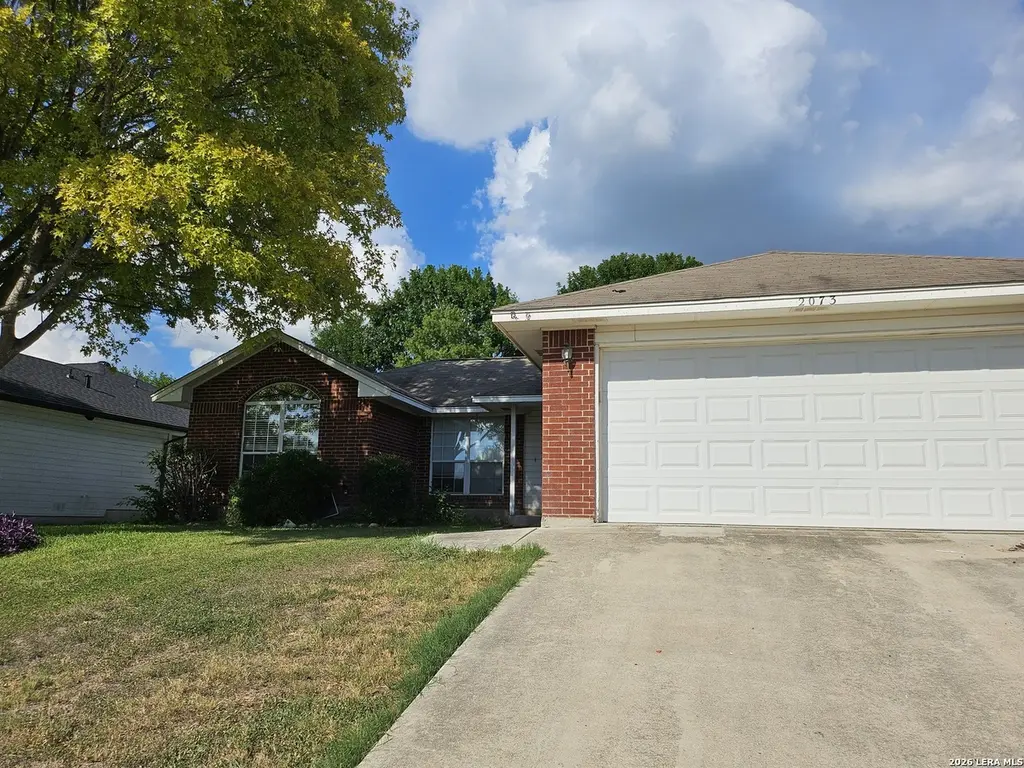
2073 Bentwood · New Braunfels, TX
Flood risk 1/10 · Minimal
- FEMA flood zone
- X (unshaded)
- Chance of flooding over 30 yrs
- 0.0%
- Est. flood insurance / yr
- $507 – $1,088
Fire risk 5/10 · Moderate
- Est. fire insurance / yr
- $1,222 – $2,270
Heat risk 8/10 · Major
- Hot days now (above 108°F)
- 7 days/yr
- Hot days in 30 yrs
- 22 days/yr
Wind risk 8/10 · Major
- Chance of severe wind over 30 yrs
- 80.0%
Air-quality risk 1/10 · Minimal
- Unhealthy air days now
- 0 days/yr
- Unhealthy air days in 30 yrs
- 0 days/yr
Risk factors via First Street. Map © Google.
Why this score? — see what drove the D grade
The composite is a weighted blend of 9 inputs, each scored 0–100. Each bar is that input's sub-score; the figure is the points it added to the 100-point composite (weight × sub-score).
- ARV discount +15.0/15.0
- Cash flow +7.8/30.0
- Schools +4.4/10.0
- Livability +4.2/5.0
- Condition / age +2.5/5.0
- 1% rule +2.4/10.0
- Rent growth +2.0/5.0
- DSCR +1.9/10.0
- Appreciation +0.0/10.0
$239,000
🖨 Deal sheet (PDF) 📄 Offer letter ✓ Due diligence
Listing remarks MLS
3 bedroom, 2 bath home in established neighborhood. Close to shopping, schools, and restaurants. High ceilings, large covered back porch, fenced back yard with mature trees. Garage features extra storage shelving. Laundry hook-us in garage. NBISD school. Pictures are from previous. Foundation repair in 2021. Currently rented. Current lease expires 7/31/26.
Key facts
- Fenced back yard
- Close to shopping
- Mature trees
Tags
Neighborhood map
What this means for you Summary
Snapshot
- This is a 3-bed/2.0-bath single-family listed at $239k.
Deal economics
- At list price, monthly cash flow is $-266 ($-3k/yr) — negative.
- To cash-flow at today's rent, offer at most $192k (19.7% below list).
- To meet the 1% rule (rent ≥ 1% of price), the offer needs to be $176k (26.4% below list).
- Recommended offer: $176k (26.4% below list) — sets the bar for 1% rule.
- Cap rate 5.0% vs local median 3.3% in New Braunfels — top-decile yield for the area; either an underpriced asset or a hidden risk that comps aren't pricing in. Stress-test before assuming the spread holds.
Location & tenants
- Location reads 83/100 on livability (#9 in TX, #925 nationally) — a professional / high-income tenant draw. Strengths: amenities A+, housing A+, health & safety A+; Watch: commute F.
- New Braunfels ISD (urban): math 47% / reading 53% proficiency, ranked #157 of 826 in TX (top 19%) — acceptable for families but not a draw, mixed tenant base, ~2y average lease.
- Zoned schools: County Line El (math 42% / reading 47%, grade F, #1,155 of 4,322 statewide, top 29%, 392 students, 40% FRL); New Braunfels Middle (math 44% / reading 46%, grade D, #479 of 1,662 statewide, top 29%, 1,301 students, 44% FRL); New Braunfels H S (math 53% / reading 10%, grade F, #1,073 of 1,632 statewide, top 66%, 1,926 students, 32% FRL) — zoned schools at 39% FRL track the district average.
- Market conditions: Rents soft (-2.0%/yr); 1931 active listings in the ZIP; 40 comparable units currently listed for rent nearby; rentals at typical pace (median 19d on market — plan ~3-4 weeks tenant-placement turnaround); solid renter incomes; 2,064 units permitted in Guadalupe County in 2024 (133 in 5+ unit buildings).
Forward outlook
- Local home prices are declining (-3.0%/yr); year-one equity from $2k of loan paydown is wiped out by about $7k of value loss. Plan a longer hold.
- Guadalupe County population projected at +61% by 2050 — long-run rental-demand tailwind backs the buy-and-hold thesis.
Negotiation context
- It's been on market 79 days — a 6% lower offer ($225k) is reasonable based on typical stale-listing flexibility.
- 11 sale attempts since 14y ago; this cycle's ask has dropped $90k (27%) from the opening price — seller is motivated, your offer sets the floor, not the list.
- Current owner paid $126k; list at $239k implies a 89% gain — meaningful room to come down on a strong offer.
Risks & watch-outs
- Climate carrying-cost: severe wind risk, 80% chance of damaging wind over 30y; moderate wildfire risk; extreme-heat days projected 7→22/yr by 2055 (HVAC capex compounding) — expect insurance premiums to compound above CPI over the hold.
Questions for the listing agent
- What do current leases actually rent for vs. the listed asking? Can we see a recent rent roll and the last 12 months of T-12 income?
- It's been on market 79 days. Have you received any prior offers? Is the seller open to a 26% concession, seller financing, or rate buy-down credit?
- Why hasn't it sold? Are there any deal-killer items the seller is aware of (foundation, flood, title, zoning, code violations)?
- Is there a deadline driving the sale (1031 exchange, divorce, estate, relocation)? That informs how much negotiation room exists.
- Schools are B-rated — typically a magnet for longer-tenancy family renters. What's the average tenant stay here, and is there a school-zone premium baked into asking?
- The area grade is low — what's the realistic commute time and amenity access for the typical tenant pool here? Any planned neighborhood developments (good or bad) we should know about?
- What's the average days-on-market for RENTAL listings here right now (not sales)? A rising rental-DOM trend means longer vacancies and softer asking-rent achievability than the comps imply.
- What's the recent tenant-quality profile in this submarket — average credit score on applications, eviction rate, late-payment / NSF rate, and stable-employment percentage? A property-management company in the area should have these aggregated.
- How much new for-sale + rental construction is in the pipeline within 1–3 miles? Heavy new supply typically softens prices + rents 12–24 months out; constrained supply supports both.
Investment metrics
- 1% rule
- 0.74% ✗
- Cap rate
- 4.96%
- Cash-on-cash
- -4.77%
- DSCR
- 0.79
- GRM
- 11.3
CMA / ARV
- ARV (median comp)
- $287,997
- List price
- $239,000
- Delta
- -17.01%
- Verdict
- UNDERPRICED
- Comps
- 20 within 1.0 mi
Show comp detail 12 sales within ~0.75 mi
| Address | Dist | Beds/Ba | Sqft | Sold | Price | $/sf | Match |
|---|---|---|---|---|---|---|---|
| 2069 Bentwood | 0.01mi | 3/2.0 | 1,260 (-2%) | 7mo | $224,000 | $178 | 90 |
| 2135 Bentwood | 0.13mi | 3/2.0 | 1,313 (+2%) | 3mo | $254,900 | $194 | 88 |
| 2121 Keystone | 0.37mi | 3/2.0 | 1,327 (+3%) | 4mo | $239,000 | $180 | 75 |
| 2120 Stonecrest | 0.10mi | 3/2.0 | 1,462 (+13%) | 2mo | $285,000 | $195 | 71 |
| 2075 Sungate Dr | 0.36mi | 3/2.0 | 1,239 (-4%) | 9mo | $269,000 | $217 | 70 |
| 2139 Cornerstone | 0.33mi | 3/2.0 | 1,362 (+6%) | 8mo | $268,000 | $197 | 68 |
| 2326 N Ranch Ests | 0.56mi | 3/2.0 | 1,264 (-2%) | 8mo | $260,000 | $206 | 64 |
| 2020 Sungate | 0.41mi | 3/2.0 | 1,169 (-9%) | 2mo | $240,000 | $205 | 64 |
| 2113 Sungate | 0.37mi | 3/2.0 | 1,416 (+10%) | 5mo | $256,000 | $181 | 62 |
| 1614 Calvin Loop | 0.66mi | 3/2.0 | 1,432 (+11%) | 2mo | $269,900 | $188 | 49 |
| 1352 Lauren St | 0.63mi | 3/2.0 | 1,419 (+10%) | 8mo | $369,900 | $261 | 47 |
| 1713 Pahmeyer Path | 0.62mi | 3/2.0 | 1,454 (+13%) | 8mo | $265,000 | $182 | 44 |
Match score weights: distance 35% · size 25% · config 20% · recency 20%. Top-matched comps best support the ARV.
Projected returns pro-forma
-3.0% appreciation · 0.0% rent growth · sell at horizon
- IRR
- -27.8%
- Equity multiple
- 0.09×
- Total profit
- $-60,796
- Equity at exit
- $35,636
- IRR
- -42.6%
- Equity multiple
- -0.41×
- Total profit
- $-94,560
- Equity at exit
- $20,664
Cash invested: $66,920 (down + closing). Projections, not guarantees.
Landlord ↔ Tenant lean methodology
- Overall (STATE)
- 87 Strongly Landlord-Friendly
- State Texas
- 87 Strongly Landlord-Friendly · R+5
- County
- — inherits STATE
- City
- — inherits STATE
ZIP-level market 78130
- Rents YoY
- -2.0%
- Active inventory
- 1931
- Price-to-rent
- 11.3×
Monthly cashflow live
- Estimated rent
- $1,759 high interval (Pro) →
- Mortgage (P&I)
- −$1,253
- Tax from tax record
- −$303 /mo · $3,634/yr
- Insurance
- −$100
- HOA
- −$0
- Vacancy / Maint / Mgmt
- −$369
- Net cashflow
- $-266
Break-even live
Sensitivity live
| Price | -10% $-131 | -5% $-198 | +0% $-266 | +5% $-334 | +10% $-401 |
|---|---|---|---|---|---|
| Rent | -10% $-405 | -5% $-335 | +0% $-266 | +5% $-197 | +10% $-127 |
| Rate | -1.0pp $-146 | -0.5pp $-205 | base $-266 | +0.5pp $-328 | +1.0pp $-391 |
UW: 25.0% down · 7.5% · 30yr · 1.5% tax · 5.0% vac · 8.0% maint · 8.0% mgmt
Financing live
Cash to close
- Down payment
- $59,750
- Closing costs
- $7,170
- Reserves months
- —
- Total cash needed
- —
Loan-product check · same deal, 3 products live
Conventional
25% down · 7.5% · 30yr
- Down + closing
- —
- Monthly P&I
- —
- Monthly cashflow
- —
- DSCR
- —
- Eligible?
- —
Personal DTI + credit; lowest rate.
DSCR
20% down · 8.5% · 30yr
- Down + closing
- —
- Monthly P&I
- —
- Monthly cashflow
- —
- DSCR
- —
- Eligible?
- —
No personal income docs; deal must DSCR.
Hard money
10% down · 12.0% · 12mo
- Down + closing
- —
- Monthly P&I
- —
- Monthly cashflow
- —
- DSCR
- —
- Eligible?
- —
Short-term bridge; refi at stabilization.
Rent comps 40 comps
| Address | Beds | Baths | Sqft | Rent | $/sqft | DOM | Units | Dist |
|---|---|---|---|---|---|---|---|---|
| 2062 N Ranch Estates Blvd New Braunfels, TX | 3.0 | 2.0 | 1346 | $1,775 | $1.32 | 25d | 1 | 0.16mi |
| 2010 N Ranch Estates Blvd New Braunfels, TX | 3.0 | 2.0 | 1169 | $1,649 | $1.41 | 45d | 1 | 0.23mi |
| 2172 Bentwood Dr New Braunfels, TX | 3.0 | 2.0 | 1542 | $1,800 | $1.17 | 45d | 1 | 0.24mi |
| 1611 Sunnycrest Cir New Braunfels, TX | 3.0 | 2.0 | 1779 | $1,995 | $1.12 | 6d | 1 | 0.36mi |
| 1898 Baron Dr New Braunfels, TX | 3.0 | 2.0 | 1593 | $1,950 | $1.22 | 45d | 1 | 0.37mi |
| 1360 W County Line Rd Unit 2212 New Braunfels, TX | 2.0 | 2.0 | 896 | $1,105 | $1.23 | 0d | 1 | 0.38mi |
| 1360 W County Line Rd Unit 3212 New Braunfels, TX | 3.0 | 2.0 | 1150 | $1,545 | $1.34 | 0d | 1 | 0.38mi |
| 1632 Sunnycrest Cir New Braunfels, TX | 3.0 | 2.0 | 1371 | $1,625 | $1.19 | 19d | 1 | 0.42mi |
| 1619 Sunspur Dr New Braunfels, TX | 3.0 | 2.0 | 1210 | $1,750 | $1.45 | 6d | 1 | 0.43mi |
| 1642 W County Line Rd New Braunfels, TX | 2.0 | 2.0 | 1238 | $1,495 | $1.21 | 6d | 1 | 0.46mi |
| 2028 Rueben Rd New Braunfels, TX | 3.0 | 2.5 | 1380 | $1,595 | $1.16 | 5d | 1 | 0.50mi |
| 2014 Rueben Rd New Braunfels, TX | 3.0 | 2.5 | 1380 | $1,595 | $1.16 | 45d | 1 | 0.51mi |
| 1648 Sunfire Cir New Braunfels, TX | 3.0 | 2.0 | 1299 | $1,850 | $1.42 | 45d | 1 | 0.52mi |
| 1666 Lantana Cir New Braunfels, TX | 3.0 | 2.0 | 1502 | $1,745 | $1.16 | 45d | 1 | 0.55mi |
| 1337 Lauren St New Braunfels, TX | 3.0 | 2.0 | 1798 | $2,245 | $1.25 | 18d | 1 | 0.61mi |
| 2441 Fayette Dr New Braunfels, TX | 3.0 | 2.0 | 1220 | $1,650 | $1.35 | 19d | 1 | 0.63mi |
| 268 Goliad Dr New Braunfels, TX | 3.0 | 2.0 | 1668 | $1,845 | $1.11 | 4d | 1 | 0.65mi |
| 268 Goliad Dr New Braunfels, TX | 3.0 | 2.0 | 1668 | $1,845 | $1.11 | 3d | 1 | 0.65mi |
| 237 Val Verde Dr New Braunfels, TX | 3.0 | 2.0 | 1562 | $1,696 | $1.09 | 21d | 1 | 0.69mi |
| 1935 Hilltop Summit Rd Unit 2NB-2 New Braunfels, TX | 2.0 | 2.0 | 1060 | $1,329 | $1.25 | 3d | 1 | 0.72mi |
| 1041 Lauren St New Braunfels, TX | 4.0 | 2.0 | 1776 | $1,995 | $1.12 | 25d | 1 | 0.73mi |
| 2207 Allison Dr New Braunfels, TX | 4.0 | 2.0 | 1850 | $1,745 | $0.94 | 14d | 1 | 0.80mi |
| 1911 Kallijo Ln New Braunfels, TX | 3.0 | 2.0 | 1552 | $1,800 | $1.16 | 18d | 1 | 0.85mi |
| 1213 Camellia Ln New Braunfels, TX | 4.0 | 2.0 | 1701 | $2,400 | $1.41 | 25d | 1 | 0.87mi |
| 2119 Hidden Mdw New Braunfels, TX | 3.0 | 2.0 | 1640 | $1,895 | $1.16 | 6d | 1 | 0.90mi |
| 227 Eagle Pass Dr New Braunfels, TX | 3.0 | 2.5 | 1503 | $1,825 | $1.21 | 45d | 1 | 0.91mi |
| 1302 S Mesquite Ave New Braunfels, TX | 3.0 | 2.0 | 1426 | $1,775 | $1.24 | 25d | 1 | 0.94mi |
| 2575 Pahmeyer Rd New Braunfels, TX | 3.0 | 2.0 | 1370 | $1,499 | $1.09 | 45d | 1 | 0.99mi |
| 2562 Pahmeyer Rd New Braunfels, TX | 3.0 | 2.0 | 1370 | $1,320 | $0.96 | 6d | 1 | 1.00mi |
| 2564 Pahmeyer Rd New Braunfels, TX | 3.0 | 2.0 | 1370 | $1,320 | $0.96 | 6d | 1 | 1.00mi |
| 2595 Pahmeyer Rd New Braunfels, TX | 3.0 | 2.0 | 1375 | $1,395 | $1.01 | 0d | 1 | 1.02mi |
| 222 Redbud Ln Unit A New Braunfels, TX | 2.0 | 1.0 | 962 | $995 | $1.03 | 0d | 1 | 1.08mi |
| 1915 Chiffchaff New Braunfels, TX | 3.0 | 2.0 | 1217 | $1,650 | $1.36 | 25d | 1 | 1.16mi |
| 935 Linde Ave Unit H New Braunfels, TX | 2.0 | 2.0 | 972 | $975 | $1.00 | 45d | 1 | 1.18mi |
| 1906 Fieldfare New Braunfels, TX | 3.0 | 2.0 | 1454 | $1,775 | $1.22 | 25d | 1 | 1.18mi |
| 1972 Bluethroat New Braunfels, TX | 3.0 | 2.0 | 1560 | $1,795 | $1.15 | 45d | 1 | 1.22mi |
| 1973 Bluethroat New Braunfels, TX | 3.0 | 2.0 | 1458 | $1,750 | $1.20 | 18d | 1 | 1.23mi |
| 2321 Brittany Grace New Braunfels, TX | 3.0 | 3.0 | 1641 | $2,095 | $1.28 | 6d | 1 | 1.26mi |
| 2373 Brittany Grace New Braunfels, TX | 3.0 | 2.0 | 1726 | $1,795 | $1.04 | 25d | 1 | 1.29mi |
| 322 Franchi Way New Braunfels, TX | 3.0 | 2.0 | 1633 | $1,750 | $1.07 | 3d | 1 | 1.34mi |
Listing history 44 events
-
2026-06-21days on market $239,000 Active 79 DOM
-
2026-06-18days on market $239,000 Active 76 DOM
-
2026-06-17days on market $239,000 Active 75 DOM
-
2026-06-16days on market $239,000 Active 74 DOM
-
2026-06-15days on market $239,000 Active 73 DOM
-
2026-06-13days on market $239,000 Active 71 DOM
-
2026-06-09days on market $239,000 Active 67 DOM
-
2026-06-08days on market $239,000 Active 66 DOM
-
2026-06-07days on market $239,000 Active 65 DOM
-
2026-06-04days on market $239,000 Active 62 DOM
-
2026-06-03days on market $239,000 Active 61 DOM
-
2026-06-02days on market $239,000 Active 60 DOM
-
2026-06-02days on market $239,000 Active 59 DOM
-
2026-05-31days on market $239,000 Active 58 DOM
-
2026-04-11price $239,000 367-char remark
Show marketing remark (367 chars)
3 bedroom, 2 bath home in established neighborhood. Close to shopping, schools, and restaurants. High ceilings, large covered back porch, fenced back yard with mature trees. Garage features extra storage shelving. Laundry hook-us in garage. NBISD school. Pictures are from previous. Foundation repair in 2021. Currently rented. Current lease expires 7/31/26.
-
2026-04-03$329,000 New 367-char remark
Show marketing remark (367 chars)
3 bedroom, 2 bath home in established neighborhood. Close to shopping, schools, and restaurants. High ceilings, large covered back porch, fenced back yard with mature trees. Garage features extra storage shelving. Laundry hook-us in garage. NBISD school. Pictures are from previous. Foundation repair in 2021. Currently rented. Current lease expires 7/31/26.
-
2025-02-04historical $1,500
-
2025-02-01historical $1,500
-
2025-02-01$1,500
-
2025-01-30$1,500
-
2025-01-29historical $1,500
-
2025-01-15price $1,500
-
2024-12-19price $1,595
-
2024-12-03price $1,700
-
2024-10-02historical
-
2024-10-02historical
-
2024-09-15$1,800
-
2024-08-24price $249,000
-
2024-08-23$249,000 Active
-
2024-06-17$270,900 New
-
2023-10-26historical
-
2023-05-26$295,000 New
-
2022-11-22historical
-
2012-08-22soldstatus
-
2012-08-13soldstatus
-
2012-08-13soldstatus $126,500
-
2012-07-30historical
-
2012-06-01$128,900
-
2012-05-31historical
-
2012-05-31$128,900
-
2012-05-01$134,000
-
2012-05-01historical
-
2012-04-18$138,500
-
2000-12-14soldstatus
ⓘ Source: listings_history table (triggers on properties + properties_extension) + one-shot
backfill from property_details.listing_events for pre-trigger history.
Tax reassessment forecast TX · Resets to sale price
- Current annual tax
- $3,634 · $303/mo
- Projected year-2 tax
- $4,374 · $364/mo
- Expected delta
- +$740/yr (+$62/mo · 20.4%)
ⓘ Screening estimate from a state-policy table — verify with the county assessor before closing.
Climate risk First Street
- Flood 1/10 Low FEMA zone X (unshaded) · 0% chance over 30 yrs
- Wildfire 5/10 Major
- Heat 8/10 Severe 7 d/yr ≥108°F today · 22 d/yr by 30 yrs out
- Wind 8/10 Severe 80% chance of damaging wind over 30 yrs
- Air quality 1/10 Low 0 unhealthy d/yr today · 0 by 30 yrs out
Nearby sold comps map
Loading sold comps map…
Walkable amenities ~0.75 mi
Loading nearby amenities…
Taxation est. · year 1
- Rental income
- $21,110
- − Mortgage interest
- −$13,388
- − Property taxes
- −$3,634
- − Insurance
- −$1,195
- − Repairs & maintenance
- −$1,689
- − Management
- −$1,689
- − Depreciation
- −$6,953
- Taxable loss
- −$7,437
- Est. tax savings @ 24.0%
- +$1,785
- After-tax cash flow
- $-1,407/yr
For passive investors: Depreciation is non-cash, so a rental often shows a tax loss while cash-flowing — sheltering income. Rental losses are passive: they offset passive income freely, and up to $25,000/yr can offset ordinary (W-2) income if you actively participate and your MAGI is under $100k (phasing out to $0 by $150k); unused losses carry forward. On sale, claimed depreciation is recaptured at up to 25%, and gains may owe capital-gains tax (a 1031 exchange can defer both). Figures are a year-1 estimate at your 24.0% rate — not tax advice; consult a CPA.
Schools (NCES district)
- District
- New Braunfels ISD
- NCES district ID
- 4832370
- Math proficiency
- 47% ▼ -10.00%
- Reading proficiency
- 53% ▼ -2.00%
- Median HH income
- $60,945
- Composite
- 43.81/100
- National rank
- #2931
- State rank
- #157 of 826 in TX
Livability — New Braunfels
- Score
- 83/100
- State rank
- #9
- US rank
- #925
Category grades
Schools grade is shown separately in the Schools card above.
Census & demographics
- Census place
- New Braunfels, TX
- County
- Comal County · 206,262 people
- City population
- 144,962
- Metro
- San Antonio-New Braunfels, TX
- Population (ZIP)
- 104,009
- Household income
- $83,064
- Rent vs Own
- Severe rent burden
- 2912.0
Population outlook (Guadalupe County) Hauer SSP2
- Today (2025)
- 196,854 people
- By 2030
- 220,210 · +11.9%
- By 2040
- 268,004 · +36.1%
- By 2050
- 316,333 · +60.7%
- By 2075
- 434,747 · +120.8%
- By 2100
- 520,447 · +164.4%
Race, ethnicity, and origin ACS 2023
- Neighborhood character
- Majority White (58%)
- Race & ethnicity
- White 58% Hispanic / Latino 37% Two or more races 19% Black 2%
- Hispanic origin (detail)
- Mexican 32%
- Common ancestry
- Romanian 2% Lithuanian 2% Slovak 2%
- Foreign-born
- 7% · Canada
- Languages at home
- 78% English-only · Spanish 20% German/W. Germanic 1%
Political lean MEDSL · Guadalupe
- 2024 margin
- Strong R (+29.5) · D 34.8% · R 64.3%
- 2008→2024 swing
- +1.5pp toward D · 2008: -31.0pp · 2024: -29.5pp
- All cycles
- 2024: R+29.5 2020: R+24.2 2016: R+31.8 2012: R+35.1 2008: R+31.0
Not yet ingested
- Civics
- —
Market trends
- HPI YoY
- ▼ -190.61%
- Current HPI
- 173.7128
- Rent YoY
- ▼ -1.97%
- Metro
- San Antonio-New Braunfels, TX
- State GDP YoY
- ▲ 3.95%
- F500 in state
- 110
Industry mix (Fortune 500 HQ in TX)
| Industry | F500 HQs | Revenue |
|---|---|---|
| Energy | 16 | $1,198B |
|
||
| Technology | 5 | $198B |
|
||
| Engineering / Construction | 4 | $72B |
|
||
| Energy Services | 3 | $60B |
|
||
| Utilities | 3 | $41B |
|
||
| Healthcare | 2 | $330B |
|
||
Price history
+72.6% since first listed30 events — show timeline
- 2026-04-11 Price Changed $239,000 LERA
- 2026-04-03 Listed $329,000 LERA
- 2025-02-04 Rental Removed $1,500 RENTALBEAST
- 2025-02-01 Rental Removed $1,500 BUILDIUM
- 2025-02-01 Listed for Rent $1,500 RENTALBEAST
- 2025-01-30 Listed for Rent $1,500 BUILDIUM
- 2025-01-29 Rental Removed $1,500 SABOR
- 2025-01-15 Price Changed $1,500 SABOR
- 2024-12-19 Price Changed $1,595 SABOR
- 2024-12-03 Price Changed $1,700 SABOR
- 2024-10-02 Listing Removed — LERA
- 2024-10-02 Listing Removed — CTXMLS
- 2024-09-15 Listed for Rent $1,800 SABOR
- 2024-08-24 Price Changed $249,000 LERA
- 2024-08-23 Listed $249,000 CTXMLS
- 2024-06-17 Listed $270,900 LERA
- 2023-10-26 Listing Removed — LERA
- 2023-05-26 Listed $295,000 LERA
- 2022-11-22 Rental Removed — BUILDIUM
- 2012-08-22 Sold (Public Records) — Public Records
- 2012-08-13 Sold (MLS) — LERA
- 2012-08-13 Sold (MLS) $126,500 CTXMLS
- 2012-07-30 Listing Removed — LERA
- 2012-06-01 Listed $128,900 LERA
- 2012-05-31 Listing Removed — LERA
- 2012-05-31 Listed $128,900 CTXMLS
- 2012-05-01 Listing Removed — LERA
- 2012-05-01 Listed $134,000 LERA
- 2012-04-18 Listed $138,500 LERA
- 2000-12-14 Sold (Public Records) — Public Records
Property tax history
+0.2%/yrLatest (2026): $3,634 · -3.4% YoY. Source: county tax records.
Cash-flow waterfall
monthlySold comps — $/sqft
last 12 mo · ≤1 miLoading sold comps…