 Fourplex
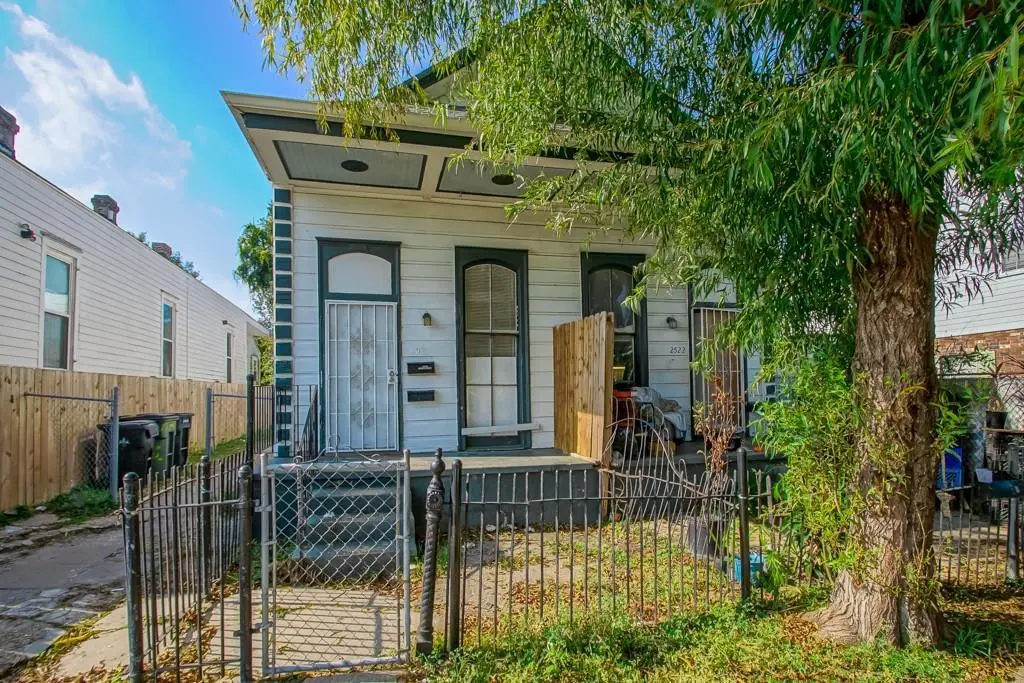
2520 22 2nd St · New Orleans, LA
Flood risk No data
- FEMA flood zone
- —
- Chance of flooding over 30 yrs
- —
- Est. flood insurance / yr
- —
Fire risk No data
- Est. fire insurance / yr
- —
Heat risk No data
- Hot days now (above threshold)
- —
- Hot days in 30 yrs
- —
Wind risk No data
- Chance of severe wind over 30 yrs
- —
Air-quality risk No data
- Unhealthy air days now
- —
- Unhealthy air days in 30 yrs
- —
Risk factors via First Street. Map © Google.
Why this score? — see what drove the C+ grade
The composite is a weighted blend of 9 inputs, each scored 0–100. Each bar is that input's sub-score; the figure is the points it added to the 100-point composite (weight × sub-score).
- Cash flow +15.0/30.0
- ARV discount +15.0/15.0
- Appreciation +10.0/10.0
- 1% rule +5.0/10.0
- DSCR +5.0/10.0
- Rent growth +4.0/5.0
- Livability +4.0/5.0
- Schools +1.6/10.0
- Condition / age +1.0/5.0
$299,900
🖨 Deal sheet 📄 Offer letter ✓ Due diligence
Multi-family units
County records classify this as Multi-Family (2-4 Unit). Listing-text estimate: 4 units. confirmed
Listing remarks MLS
This AMAZING fourplex Central City area- a true New Orleans GEM. Comprising four spacious units, Totaling 4 bedrooms and 4 bathrooms this property offers tenants comfortable and roomy living spaces, off street parking and more! Can collect up to $4400 a month in rent, great first time investing! Bring all offers
Key facts
- Built 1946
- Listed 21 days
Neighborhood map
What this means for you Summary
Snapshot
- This is a 4 × 4-bed/4.0-bath units multifamily listed at $300k. Condition is rated poor.
Deal economics
- At list price, monthly cash flow is $11k ($132k/yr) — positive. Per door: $3k/mo.
- The deal already cash-flows at list — no discount required.
- Meets the 1% rule at list price ($17k rent vs $300k).
- Recommended offer: $295k (1.5% below list) — sets the bar for market timing.
- Cap rate 50.2% vs local median 4.4% in New Orleans — top-decile yield for the area; either an underpriced asset or a hidden risk that comps aren't pricing in. Stress-test before assuming the spread holds.
Location & tenants
- Location reads 81/100 on livability (#3 in LA, #1,383 nationally) — a professional / high-income tenant draw. Strengths: amenities A+, commute A+, health & safety A+; Watch: crime C-, employment D.
- Orleans Parish (urban): math 11% / reading 27% proficiency, ranked #69 of 98 in LA (top 70%) — low school quality limits family demand, transient renter base, plan for 1-2y turnover; 68% free/reduced lunch — lower-income household profile, screen leases tightly.
- Market conditions: Rents rising fast (+6.0%/yr); 137 active listings in the ZIP; lower-income renter base — watch delinquency; 710 units permitted in Orleans Parish in 2024 (244 in 5+ unit buildings).
- At $16,523/mo this rent would consume 504% of the median local household income ($39k/yr) (locally 714% of renters already pay >50% of income on rent) — very limited rent-growth headroom before tenants either downsize or default.
Forward outlook
- In year one you build about $32k of equity ($2k loan paydown + $30k appreciation (10.0% local appreciation)).
- Orleans County population projected at +61% by 2050 — long-run rental-demand tailwind backs the buy-and-hold thesis.
- At projected returns (10.0% appreciation + 6.0% rent growth), your $84k cash investment doubles in ~1 year — after that, you're playing with house money.
- By year 2, paydown + projected appreciation supports a ~$52k cash-out refi (75% LTV) — recoverable capital for the next deal without selling this one.
Negotiation context
- It's been on market 21 days — a 2% lower offer ($295k) is reasonable based on typical stale-listing flexibility.
- 2 sale attempts since 13y ago; this cycle's ask has dropped $25k (8%) from the opening price — seller is motivated, your offer sets the floor, not the list.
- Current owner paid $10k; list at $300k implies a 2899% gain — meaningful room to come down on a strong offer.
Risks & watch-outs
- Watch-outs: built in 1946 — expect roof / HVAC / electrical / plumbing capex.
Questions for the listing agent
- Can we see the unit-by-unit rent roll, current vacancy, and any below-market leases? What's the average tenancy length?
- What capital expenditures (roof, boiler, parking lot, exteriors) have been made in the last 5 years, and what's planned in the next 2?
- Have any recent inspections been done? Can we get a copy of the seller's disclosures and any deferred-maintenance estimates?
- Built in 1946 — when were the roof, HVAC, electrical panel, plumbing, and water heater last replaced?
- Is there a deadline driving the sale (1031 exchange, divorce, estate, relocation)? That informs how much negotiation room exists.
- What's the average days-on-market for RENTAL listings here right now (not sales)? A rising rental-DOM trend means longer vacancies and softer asking-rent achievability than the comps imply.
- What's the recent tenant-quality profile in this submarket — average credit score on applications, eviction rate, late-payment / NSF rate, and stable-employment percentage? A property-management company in the area should have these aggregated.
- How much new apartment / multifamily construction is in the pipeline within 1–3 miles? Heavy new supply (>2% of stock underway) typically softens rents 12–24 months out; light construction supports rent growth.
Investment metrics
- 1% rule
- 5.51% ✓
- Cap rate
- 50.23%
- Cash-on-cash
- 156.92%
- DSCR
- 7.98
- GRM
- 1.5
CMA / ARV
- ARV (median comp)
- $392,316
- List price
- $299,900
- Delta
- -23.56%
- Verdict
- UNDERPRICED
- Comps
- 20 within 1.0 mi
Projected returns pro-forma
10.0% appreciation · 5.98% rent growth · sell at horizon
- IRR
- —
- Equity multiple
- 11.88×
- Total profit
- $913,963
- Equity at exit
- $270,174
- IRR
- —
- Equity multiple
- 27.90×
- Total profit
- $2,258,749
- Equity at exit
- $582,640
Cash invested: $83,972 (down + closing). Projections, not guarantees.
Landlord ↔ Tenant lean methodology
- Overall (STATE)
- 90 Strongly Landlord-Friendly
- State Louisiana
- 90 Strongly Landlord-Friendly · R+12
- County
- — inherits STATE
- City
- — inherits STATE
ZIP-level market 70113
- Rents YoY
- 6.0%
- Active inventory
- 137
- Price-to-rent
- 6.1×
Monthly cashflow live
- Estimated rent
- $16,523 medium interval (Pro) →
- Mortgage (P&I)
- −$1,573
- Tax est. 1.5%
- −$375 /mo · $4,498/yr
- Insurance
- −$125
- HOA
- −$0
- Vacancy / Maint / Mgmt
- −$3,470
- Net cashflow
- $10,981
Break-even live
4-unit breakdown (identical units grouped — click to expand)
| Units | Beds | Baths | Est. rent |
|---|---|---|---|
| 4× units | 4 | 4 | $16,524 |
| #1 | 4 | 4 | $4,131 |
| #2 | 4 | 4 | $4,131 |
| #3 | 4 | 4 | $4,131 |
| #4 | 4 | 4 | $4,131 |
| Total (4 units) | $16,523 | ||
UW: 25.0% down · 7.5% · 30yr · 1.5% tax · 5.0% vac · 8.0% maint · 8.0% mgmt
Financing live
Cash to close
- Down payment
- $74,975
- Closing costs
- $8,997
- Reserves months
- —
- Total cash needed
- —
Loan-product check · same deal, 3 products live
Conventional
25% down · 7.5% · 30yr
- Down + closing
- —
- Monthly P&I
- —
- Monthly cashflow
- —
- DSCR
- —
- Eligible?
- —
Personal DTI + credit; lowest rate.
DSCR
20% down · 8.5% · 30yr
- Down + closing
- —
- Monthly P&I
- —
- Monthly cashflow
- —
- DSCR
- —
- Eligible?
- —
No personal income docs; deal must DSCR.
Hard money
10% down · 12.0% · 12mo
- Down + closing
- —
- Monthly P&I
- —
- Monthly cashflow
- —
- DSCR
- —
- Eligible?
- —
Short-term bridge; refi at stabilization.
Listing history 19 events
-
2026-06-18days on market $299,900 Active 21 DOM
-
2026-06-17days on market $299,900 Active 20 DOM
-
2026-06-16days on market $299,900 Active 19 DOM
-
2026-06-15days on market $299,900 Active 18 DOM
-
2026-06-13days on market $299,900 Active 16 DOM
-
2026-06-10days on market $299,900 Active 13 DOM
-
2026-06-09days on market $299,900 Active 12 DOM
-
2026-06-08days on market $299,900 Active 11 DOM
-
2026-06-07days on market $299,900 Active 10 DOM
-
2026-06-05days on market $299,900 Active 7 DOM
-
2026-06-03days on market $299,900 Active 6 DOM
-
2026-06-02days on market $299,900 Active 5 DOM
-
2026-06-01days on market $299,900 Active 4 DOM
-
2026-05-31days on market $299,900 Active 3 DOM
-
2026-04-08price $299,900 314-char remark
Show marketing remark (314 chars)
This AMAZING fourplex Central City area- a true New Orleans GEM. Comprising four spacious units, Totaling 4 bedrooms and 4 bathrooms this property offers tenants comfortable and roomy living spaces, off street parking and more! Can collect up to $4400 a month in rent, great first time investing! Bring all offers
-
2026-01-02price $320,000 314-char remark
Show marketing remark (314 chars)
This AMAZING fourplex Central City area- a true New Orleans GEM. Comprising four spacious units, Totaling 4 bedrooms and 4 bathrooms this property offers tenants comfortable and roomy living spaces, off street parking and more! Can collect up to $4400 a month in rent, great first time investing! Bring all offers
-
2025-11-25$325,000 Active 314-char remark
Show marketing remark (314 chars)
This AMAZING fourplex Central City area- a true New Orleans GEM. Comprising four spacious units, Totaling 4 bedrooms and 4 bathrooms this property offers tenants comfortable and roomy living spaces, off street parking and more! Can collect up to $4400 a month in rent, great first time investing! Bring all offers
-
2014-01-13soldstatus $10,000 252-char remark
Show marketing remark (252 chars)
Traditional style double; potential to be owner occupant or investment property. Lots of activity in the neighborhood; No interior access will be given- property is unsafe to enter. No utilities will be provided. This is a Fannie Mae HomePath property.
-
2013-09-10$14,900 252-char remark
Show marketing remark (252 chars)
Traditional style double; potential to be owner occupant or investment property. Lots of activity in the neighborhood; No interior access will be given- property is unsafe to enter. No utilities will be provided. This is a Fannie Mae HomePath property.
ⓘ Source: listings_history table (triggers on properties + properties_extension) + one-shot
backfill from property_details.listing_events for pre-trigger history.
Nearby sold comps map
Loading sold comps map…
Walkable amenities ~0.75 mi
Loading nearby amenities…
Taxation est. · year 1
- Rental income
- $198,276
- − Mortgage interest
- −$16,799
- − Property taxes
- −$4,498
- − Insurance
- −$1,500
- − Repairs & maintenance
- −$15,862
- − Management
- −$15,862
- − Depreciation
- −$8,724
- Taxable income
- $135,030
- Est. tax owed @ 24.0%
- −$32,407
- After-tax cash flow
- $99,360/yr
For passive investors: Depreciation is non-cash, so a rental often shows a tax loss while cash-flowing — sheltering income. Rental losses are passive: they offset passive income freely, and up to $25,000/yr can offset ordinary (W-2) income if you actively participate and your MAGI is under $100k (phasing out to $0 by $150k); unused losses carry forward. On sale, claimed depreciation is recaptured at up to 25%, and gains may owe capital-gains tax (a 1031 exchange can defer both). Figures are a year-1 estimate at your 24.0% rate — not tax advice; consult a CPA.
Condition & rehab AI · 12 photos
This fourplex in the Central City area is in poor condition and requires extensive renovations to become move-in ready.
Repairs flagged
- Major kitchen appliances — need replacement
- Major bathroom fixtures — need replacement
- Major roof — visible wear
- Major exterior siding — overgrown and worn
- Major flooring — worn and in need of replacement
- Major interior walls/paint — dated and in need of fresh paint
Value-add opportunities
- Both kitchen renovation — modernizing the kitchen would increase both resale and rental value
- Both bathroom renovation — modernizing the bathrooms would increase both resale and rental value
- Both exterior landscaping — improving the landscaping would increase both resale and rental value
- Both paint job — fresh paint would improve the home's curb appeal and increase both resale and rental value
Renovation cost estimate screening
| Repair item | Severity | Est. cost |
|---|---|---|
| kitchen appliances · need replacement | Major | $15,000–50,000 |
| bathroom fixtures · need replacement | Major | $15,000–50,000 |
| roof · visible wear | Major | $15,000–50,000 |
| exterior siding · overgrown and worn | Major | $15,000–50,000 |
| flooring · worn and in need of replacement | Major | $15,000–50,000 |
| interior walls/paint · dated and in need of fresh paint | Major | $15,000–50,000 |
| Total estimated repair cost · 6 items | $90,000–300,000 |
Value-add ROI direction
- Both kitchen renovation — modernizing the kitchen would increase both resale and rental value ↑
- Both bathroom renovation — modernizing the bathrooms would increase both resale and rental value ↑
- Both exterior landscaping — improving the landscaping would increase both resale and rental value ↑
- Both paint job — fresh paint would improve the home's curb appeal and increase both resale and rental value ↑
ⓘ Cost ranges are severity-bucket heuristics (US national rule-of-thumb). Get contractor quotes + a written scope before underwriting a rehab budget.
Schools (NCES district)
- District
- Orleans Parish
- NCES district ID
- 2201170
- Math proficiency
- 11% ▼ -52.00%
- Reading proficiency
- 27% ▼ -46.00%
- Median HH income
- $37,011
- Composite
- 15.78/100
- National rank
- #9271
- State rank
- #69 of 98 in LA
Livability — New Orleans
- Score
- 81/100
- State rank
- #3
- US rank
- #1383
Category grades
Schools grade is shown separately in the Schools card above.
Census & demographics
- Census place
- New Orleans, LA
- County
- Orleans Parish · 338,817 people
- City population
- 338,817
- Metro
- New Orleans-Metairie, LA
- Population (ZIP)
- 9,387
- Household income
- $39,333
- Rent vs Own
- Severe rent burden
- 714.0
Population outlook (Orleans County) Hauer SSP2
- Today (2025)
- 513,025 people
- By 2030
- 575,781 · +12.2%
- By 2040
- 700,174 · +36.5%
- By 2050
- 826,541 · +61.1%
- By 2075
- 1,123,374 · +119.0%
- By 2100
- 1,355,609 · +164.2%
Race, ethnicity, and origin ACS 2023
- Neighborhood character
- Diverse neighborhood (Simpson 0.57)
- Race & ethnicity
- Black 61% White 20% Hispanic / Latino 13% Two or more races 11% Asian 2%
- Hispanic origin (detail)
- Mexican 2%
- Common ancestry
- Lithuanian 2% Portuguese 1% Slovak 1%
- Foreign-born
- 13% · Canada, Vietnam, China
- Languages at home
- 86% English-only · Spanish 11% Other Indo-European 1% Vietnamese 1%
Political lean MEDSL · Orleans
- 2024 margin
- Solid D (+67.0) · D 82.2% · R 15.2% · Other 2.7%
- 2008→2024 swing
- +6.7pp toward D · 2008: 60.3pp · 2024: 67.0pp
- All cycles
- 2024: D+67.0 2020: D+68.2 2016: D+66.2 2012: D+62.5 2008: D+60.3
Not yet ingested
- Civics
- —
Market trends
- HPI YoY
- ▲ 65.92%
- Current HPI
- 229.3968
- Rent YoY
- ▲ 5.98%
- Metro
- New Orleans-Metairie, LA
- State GDP YoY
- ▲ 3.29%
- F500 in state
- 10
Industry mix (Fortune 500 HQ in LA)
| Industry | F500 HQs | Revenue |
|---|---|---|
| Telecommunications | 2 | $23B |
|
||
| Utilities | 1 | $12B |
|
||
| Wholesale / Distribution | 1 | $5B |
|
||
| Advertising | 1 | $2B |
|
||
Price history
+1912.8% since first listed5 events — show timeline
- 2026-04-08 Price Changed $299,900 GSREIN
- 2026-01-02 Price Changed $320,000 GSREIN
- 2025-11-25 Listed $325,000 GSREIN
- 2014-01-13 Sold (MLS) $10,000 GSREIN
- 2013-09-10 Listed $14,900 GSREIN
Cash-flow waterfall
monthlySold comps — $/sqft
last 12 mo · ≤1 miLoading sold comps…