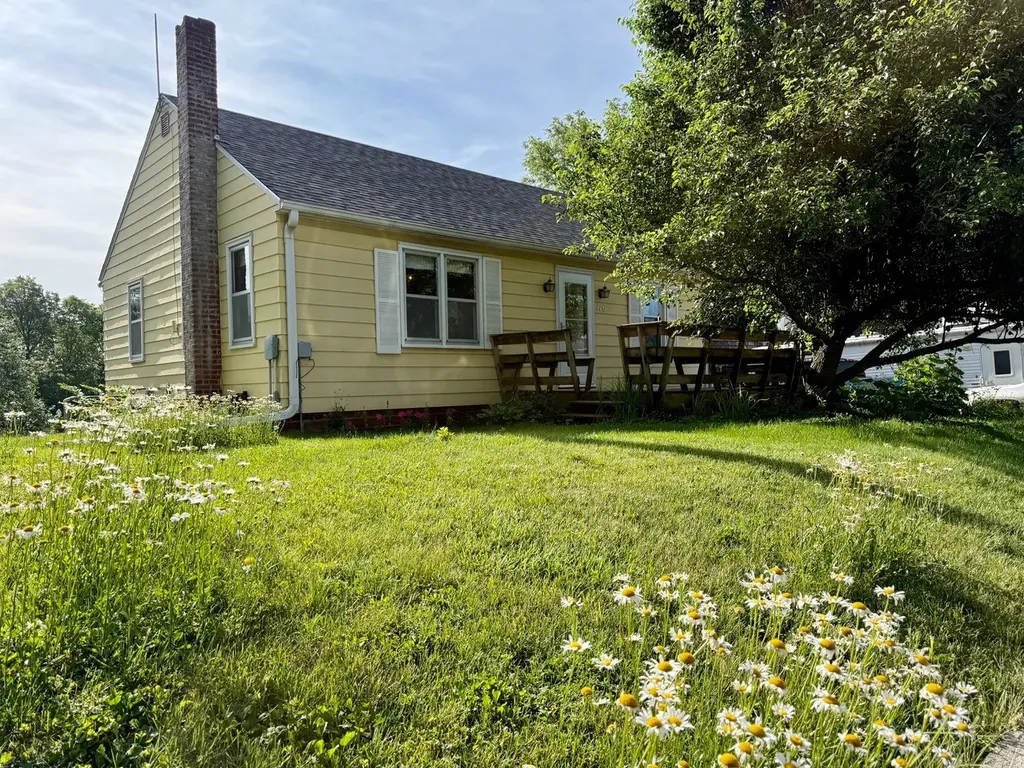
116 East St · Kellogg, IA
Flood risk 1/10 · Minimal
- FEMA flood zone
- X (unshaded)
- Chance of flooding over 30 yrs
- 0.0%
- Est. flood insurance / yr
- $473 – $860
Fire risk 1/10 · Minimal
- Est. fire insurance / yr
- $902 – $1,676
Heat risk 3/10 · Minor
- Hot days now (above 103°F)
- 7 days/yr
- Hot days in 30 yrs
- 15 days/yr
Wind risk 2/10 · Minimal
- Chance of severe wind over 30 yrs
- —
Air-quality risk 1/10 · Minimal
- Unhealthy air days now
- 0 days/yr
- Unhealthy air days in 30 yrs
- 0 days/yr
Risk factors via First Street. Map © Google.
Why this score? — see what drove the D+ grade
The composite is a weighted blend of 9 inputs, each scored 0–100. Each bar is that input's sub-score; the figure is the points it added to the 100-point composite (weight × sub-score).
- ARV discount +15.0/15.0
- Cash flow +8.8/30.0
- Appreciation +8.7/10.0
- Schools +5.1/10.0
- Livability +2.9/5.0
- Rent growth +2.5/5.0
- Condition / age +2.5/5.0
- DSCR +2.4/10.0
- 1% rule +2.2/10.0
$120,000
🖨 Deal sheet (PDF) 📄 Offer letter ✓ Due diligence
Listing remarks
Enjoy a home with a backyard setting that lets you enjoy the countryside. Sellers often sit on the top of playset/gazebo to enjoy the view. There are 3 Northstar cherry trees that make the best Cherry pies. Greenhouse was built with UV resistant plastic. Sellers have updated the kitchen in 2003, the appliances will stay. The A/C was replaced in 2020 and new roof in 2023. Hardwood under carpet. Easy access to I-80 for your commuting needs. Taxes are only $1196 a year, helps with affordable living.
Key facts
- Updated kitchen
- Backyard setting
- Greenhouse
Tags
Property features AI
Exterior
- Parking: Attached one-car garage
- Utilities: Public water; Public sewer
- Home design: Single-story; Residential zoning
- Construction: Metal siding; Asphalt shingle roof
- Exterior features: Rectangular lot; Concrete road frontage
Interior
- Kitchen: Refrigerator; Stove
- Bedrooms: 2 main-level bedrooms
- Flooring: Carpet; Laminate; Tile; Vinyl
- Bathrooms: 1 full bathroom
- Heating & cooling: Forced air heating (natural gas); Central air conditioning
- Interior features: Basement (unfinished); Play structure in yard
- Laundry & utility: Washer; Dryer
Neighborhood map
What this means for you Summary
Snapshot
- This is a 2-bed/1.0-bath single-family listed at $120k.
Deal economics
- At list price, monthly cash flow is $-99 ($-1k/yr) — negative.
- To cash-flow at today's rent, offer at most $102k (14.6% below list).
- To meet the 1% rule (rent ≥ 1% of price), the offer needs to be $86k (28.3% below list).
- Recommended offer: $86k (28.3% below list) — sets the bar for 1% rule.
Location & tenants
- Location reads 57/100 on livability (#904 in IA) — a working-class tenant base; expect higher turnover. Strengths: cost of living A+, housing B+; Watch: amenities F, commute F, employment F.
- Newton Community School District (town): math 59% / reading 62% proficiency, ranked #245 of 289 in IA (top 85%) — acceptable for families but not a draw, mixed tenant base, ~2y average lease.
- Zoned schools: Berg Middle School (math 55% / reading 61%, grade B, #195 of 246 statewide, top 79%, 841 students, 55% FRL); Newton Senior High School (math 60% / reading 62%, grade C+, #258 of 336 statewide, top 78%, 818 students, 47% FRL).
- Market conditions: 19 active listings in the ZIP; 16 units permitted in Jasper County in 2024 (0 in 5+ unit buildings).
Forward outlook
- In year one you build about $10k of equity ($830 loan paydown + $9k appreciation (7.3% local appreciation)).
- Jasper County population projected to shrink 7% by 2050 — rents likely to lag national; underwrite the cash flow, not the appreciation.
- By year 4, paydown + projected appreciation supports a ~$33k cash-out refi (75% LTV) — recoverable capital for the next deal without selling this one.
Negotiation context
- It's been on market 18 days — a 2% lower offer ($118k) is reasonable based on typical stale-listing flexibility.
Risks & watch-outs
- Watch-outs: built in 1948 — expect roof / HVAC / electrical / plumbing capex.
Questions for the listing agent
- What do current leases actually rent for vs. the listed asking? Can we see a recent rent roll and the last 12 months of T-12 income?
- Built in 1948 — when were the roof, HVAC, electrical panel, plumbing, and water heater last replaced?
- Is there a deadline driving the sale (1031 exchange, divorce, estate, relocation)? That informs how much negotiation room exists.
- Schools are F-rated, which usually means shorter tenancies and higher turnover. Who's the typical renter profile here, and what's been the actual vacancy rate?
- The area grade is low — what's the realistic commute time and amenity access for the typical tenant pool here? Any planned neighborhood developments (good or bad) we should know about?
- What's the average days-on-market for RENTAL listings here right now (not sales)? A rising rental-DOM trend means longer vacancies and softer asking-rent achievability than the comps imply.
- What's the recent tenant-quality profile in this submarket — average credit score on applications, eviction rate, late-payment / NSF rate, and stable-employment percentage? A property-management company in the area should have these aggregated.
- How much new for-sale + rental construction is in the pipeline within 1–3 miles? Heavy new supply typically softens prices + rents 12–24 months out; constrained supply supports both.
Investment metrics
- 1% rule
- 0.72% ✗
- Cap rate
- 5.30%
- Cash-on-cash
- -3.55%
- DSCR
- 0.84
- GRM
- 11.6
CMA / ARV
- ARV (on-the-fly)
- $150,592
- Comps found
- 5
Show comp detail 5 sales within ~0.75 mi
| Address | Dist | Beds/Ba | Sqft | Sold | Price | $/sf | Match |
|---|---|---|---|---|---|---|---|
| 10171 Illinois Ave | 0.30mi | 2/1.0 | 864 (+4%) | 11mo | $130,000 | $150 | 71 |
| 506 Reuel Ave | 0.59mi | 3/2.0 (+1) | 836 (+0%) | 4mo | $151,000 | $181 | 60 |
| 917 Streeter St | 0.69mi | 3/2.0 (+1) | 810 (-3%) | 1mo | $248,500 | $307 | 54 |
| 524 2nd St | 0.43mi | 2/1.0 | 912 (+10%) | 22mo | $28,000 | $31 | 46 |
| 918 Reuel Ave | 0.71mi | 3/2.0 (+1) | 904 (+9%) | 14mo | $204,900 | $227 | 32 |
Match score weights: distance 35% · size 25% · config 20% · recency 20%. Top-matched comps best support the ARV.
Projected returns pro-forma
7.33% appreciation · 3.0% rent growth · sell at horizon
- IRR
- 15.7%
- Equity multiple
- 2.13×
- Total profit
- $37,967
- Equity at exit
- $85,728
- IRR
- 15.4%
- Equity multiple
- 4.42×
- Total profit
- $114,865
- Equity at exit
- $165,227
Cash invested: $33,600 (down + closing). Projections, not guarantees.
Landlord ↔ Tenant lean methodology
- Overall (STATE)
- 83 Strongly Landlord-Friendly
- State Iowa
- 83 Strongly Landlord-Friendly · R+6
- County
- — inherits STATE
- City
- — inherits STATE
ZIP-level market 50135
- Home prices YoY
- 2.4%
- Active inventory
- 19
- Price-to-rent
- 11.6×
Monthly cashflow live
- Estimated rent
- $860 medium interval (Pro) →
- Mortgage (P&I)
- −$629
- Tax from tax record
- −$100 /mo · $1,196/yr
- Insurance
- −$50
- HOA
- −$0
- Vacancy / Maint / Mgmt
- −$181
- Net cashflow
- $-99
Break-even live
Sensitivity live
| Price | -10% $-32 | -5% $-66 | +0% $-99 | +5% $-133 | +10% $-167 |
|---|---|---|---|---|---|
| Rent | -10% $-167 | -5% $-133 | +0% $-99 | +5% $-65 | +10% $-32 |
| Rate | -1.0pp $-39 | -0.5pp $-69 | base $-99 | +0.5pp $-131 | +1.0pp $-162 |
UW: 25.0% down · 7.5% · 30yr · 1.5% tax · 5.0% vac · 8.0% maint · 8.0% mgmt
Financing live
Cash to close
- Down payment
- $30,000
- Closing costs
- $3,600
- Reserves months
- —
- Total cash needed
- —
Loan-product check · same deal, 3 products live
Conventional
25% down · 7.5% · 30yr
- Down + closing
- —
- Monthly P&I
- —
- Monthly cashflow
- —
- DSCR
- —
- Eligible?
- —
Personal DTI + credit; lowest rate.
DSCR
20% down · 8.5% · 30yr
- Down + closing
- —
- Monthly P&I
- —
- Monthly cashflow
- —
- DSCR
- —
- Eligible?
- —
No personal income docs; deal must DSCR.
Hard money
10% down · 12.0% · 12mo
- Down + closing
- —
- Monthly P&I
- —
- Monthly cashflow
- —
- DSCR
- —
- Eligible?
- —
Short-term bridge; refi at stabilization.
Listing history 13 events
-
2026-06-21days on market $120,000 Active 18 DOM
-
2026-06-18days on market $120,000 Active 15 DOM
-
2026-06-17days on market $120,000 Active 14 DOM
-
2026-06-16days on market $120,000 Active 13 DOM
-
2026-06-15days on market $120,000 Active 12 DOM
-
2026-06-14days on market $120,000 Active 10 DOM
-
2026-06-13days on market $120,000 Active 9 DOM
-
2026-06-10days on market $120,000 Active 7 DOM
-
2026-06-09days on market $120,000 Active 6 DOM
-
2026-06-08days on market $120,000 Active 5 DOM
-
2026-06-07days on market $120,000 Active 4 DOM
-
2026-06-05remarks 501-char remark
-
2026-06-05$120,000 Active 1 DOM
ⓘ Source: listings_history table (triggers on properties + properties_extension) + one-shot
backfill from property_details.listing_events for pre-trigger history.
Tax reassessment forecast IA · Partial reset (capped growth)
- Current annual tax
- $1,196 · $100/mo
- Projected year-2 tax
- $1,540 · $128/mo
- Expected delta
- +$344/yr (+$29/mo · 28.8%)
ⓘ Screening estimate from a state-policy table — verify with the county assessor before closing.
Climate risk First Street
- Flood 1/10 Low FEMA zone X (unshaded) · 0% chance over 30 yrs
- Wildfire 1/10 Low
- Heat 3/10 Moderate 7 d/yr ≥103°F today · 15 d/yr by 30 yrs out
- Wind 2/10 Low
- Air quality 1/10 Low 0 unhealthy d/yr today · 0 by 30 yrs out
Nearby sold comps map
Loading sold comps map…
Walkable amenities ~0.75 mi
Loading nearby amenities…
Taxation est. · year 1
- Rental income
- $10,321
- − Mortgage interest
- −$6,722
- − Property taxes
- −$1,196
- − Insurance
- −$600
- − Repairs & maintenance
- −$826
- − Management
- −$826
- − Depreciation
- −$3,491
- Taxable loss
- −$3,339
- Est. tax savings @ 24.0%
- +$801
- After-tax cash flow
- $-392/yr
For passive investors: Depreciation is non-cash, so a rental often shows a tax loss while cash-flowing — sheltering income. Rental losses are passive: they offset passive income freely, and up to $25,000/yr can offset ordinary (W-2) income if you actively participate and your MAGI is under $100k (phasing out to $0 by $150k); unused losses carry forward. On sale, claimed depreciation is recaptured at up to 25%, and gains may owe capital-gains tax (a 1031 exchange can defer both). Figures are a year-1 estimate at your 24.0% rate — not tax advice; consult a CPA.
Schools (NCES district)
- District
- Newton Community School District
- NCES district ID
- 1920610
- Math proficiency
- 59% ▼ -13.00%
- Reading proficiency
- 62% ▼ -9.00%
- Median HH income
- $46,447
- Composite
- 51.15/100
- National rank
- #1762
- State rank
- #245 of 289 in IA
Livability — Kellogg
- Score
- 57/100
- State rank
- #904
- US rank
- #21560
Category grades
Schools grade is shown separately in the Schools card above.
Census & demographics
- Census place
- Kellogg, IA
- Population (ZIP)
- 1,777
Population outlook (Jasper County) Hauer SSP2
- Today (2025)
- 36,216 people
- By 2030
- 35,730 · -1.3%
- By 2040
- 34,727 · -4.1%
- By 2050
- 33,802 · -6.7%
- By 2075
- 33,382 · -7.8%
- By 2100
- 32,761 · -9.5%
Race, ethnicity, and origin ACS 2023
- Neighborhood character
- Predominantly White (96%)
- Race & ethnicity
- White 96% Hispanic / Latino 3% Two or more races 2%
- Common ancestry
- Iranian 6% Portuguese 5% Slovak 4%
- Foreign-born
- 1% · Canada
Political lean MEDSL · Jasper
- 2024 margin
- Strong R (+27.6) · D 35.4% · R 63.0% · Other 1.5%
- 2008→2024 swing
- -35.1pp toward R · 2008: 7.5pp · 2024: -27.6pp
- All cycles
- 2024: R+27.6 2020: R+21.5 2016: R+18.4 2012: D+7.1 2008: D+7.5
Not yet ingested
- Civics
- —
Market trends
- HPI YoY
- ▲ 7.33%
- Current HPI
- 312.7639
- Rent YoY
- —
- Metro
- —
- State GDP YoY
- ▲ 2.48%
- F500 in state
- 4
Industry mix (Fortune 500 HQ in IA)
| Industry | F500 HQs | Revenue |
|---|---|---|
| Financial Services | 1 | $16B |
|
||
| Retail / Convenience | 1 | $15B |
|
||
Price history
1 event — show timeline
- 2026-06-03 Listed $120,000 DMMLS
Property tax history
+4.3%/yrLatest (2025): $1,196 · -0.5% YoY. Source: county tax records.
Cash-flow waterfall
monthlySold comps — $/sqft
last 12 mo · ≤1 miLoading sold comps…